Abstract
Food industry is the production sector with the highest energy consumption. In Europe, the energy used to produce food accounts for 26% of total energy consumption. Over 28% is used in indus-trial processes. Recently, European food companies have increased their efforts to make their production processes more sustainable, also by giving preference to the use of renewable energy sources. In Italy, the total energy consumption in agricul-ture and food sectors decreased between 2013 and 2014, passing from 16.79 to 13.3 Mtep. Since energy consumption in food industry is nearly twice the one in agriculture (8.57 and 4.73 Mtep, respectively), it is very important to improve energy efficiency and use green technologies in all the phases of food processing and conservation. In Italy, a recent law (Legislative Decree 102, 04/07/2014) has made energy-use diagnosis compulsory for all
industrial concerns, particularly for those showing high consump-tion levels. In the case of food industry buildings, energy is mainly used for indoor microclimate control, which is needed to ensure workers’ wellbeing and the most favourable conditions for food processing and conservation. To this end, it is important to have tools and methods allowing for easy, rapid and precise energy per-formance assessment of agri-food buildings. The accuracy of the results obtainable from the currently available computational models depends on the grade of detail and information used in constructional and geometric modelling. Moreover, this phase is probably the most critical and time-consuming in the energy diag-nosis. In this context, fine surveying and advanced 3D geometric modelling procedures can facilitate building modelling and allow technicians and professionals in the agri-food sector to use highly efficient and accurate energy analysis and evaluation models. This paper proposes a dedicated model for energy performance assess-ment in agri-food buildings. It also shows that by using advanced surveying techniques, such as a terrestrial laser scanner and an infrared camera, it is possible to create a three-dimensional para-metric model, while, thanks to the heat flow meter measurement method, it is also possible to obtain a thermophysical model. This model allows assessing the energy performance of agri-food buildings in order to improve the indoor microclimate control and the conditions of food processing and conservation.
Introduction
The food industry is the production sector recording the high-est energy consumption in EU (Monforti-Ferrario et al., 2015). In 2013, in Europe, the energy used to grow, process, pack and dis-tribute food products accounted for around 26% of the total final energy consumption (Monforti-Ferrario et al., 2015), 28% of which was used by industrial processes that, together with logis-tics and packaging, contributed to the consumption of nearly 50% of the energy used in the food system. In the last few years, the European food industry has been significantly contributing to making its production more sustainable also introducing renew-able energy sources. In Italy, in 2013, the food sector alone con-sumed about three times the energy (12.8 Mtep) of the agricultural one (4.71 Mtep) (Moneta et al., 2015). The building geometry and the building envelope are the characteristics on which it is neces-sary to intervene in order to obtain the highest energy efficiency (Kaminski and Leduc, 2010). In the EU, the electric power con-sumption for cooling and freezing in food processes is about 30% of the overall energy consumed by the food industry, which is a high value if compared to other industrial sectors (Monforti-Ferrario et al., 2015). ENEA (Italian Authority for New Technologies, Energy and the Environment) estimates that the reduction of the energy consumption is also possible through ener-gy efficiency interventions or by using green technoloener-gy during Correspondence: Francesco Barreca, Department of Agriculture,
Mediterranea University of Reggio Calabria, Località Feo di Vito, 89122 Reggio Calabria, Italy.
Tel. +39.0965.1694215. E-mail: [email protected]
Key words: Advanced 3D surveying techniques; agri-food buildings; building energy model; building information modelling; energy per-formance assessment.
Funding: the research was funded by the project PONa3_00016-RI-SAF@MED and PON03PE_00090_3, both included in the MIUR-MiSE National Operational Programme for Research and Competitiveness (PON R&C) 2007-2013, and co-funded by the European Regional Development Fund (ERDF).
Contributions: the authors contributed equally.
Conflict of interest: the authors declare no potential conflict of interest. Conference presentation: part of this paper was presented at the SAIE building & construction, Smart Rural Buildings: Food Security, Safety and Sustainability, 2016 Oct 20-21, Bologna, Italy.
Received for publication: 7 February 2017. Accepted for publication: 16 July 2017. ©Copyright F. Barreca et al., 2017 Licensee PAGEPress, Italy
Journal of Agricultural Engineering 2017; XLVIII:677 doi:10.4081/jae.2017.677
This article is distributed under the terms of the Creative Commons Attribution Noncommercial License (by-nc 4.0) which permits any non-commercial use, distribution, and reproduction in any medium, provid-ed the original author(s) and source are crprovid-editprovid-ed.
Improving building energy modelling by applying advanced 3D surveying
techniques on agri-food facilities
Francesco Barreca, Giuseppe Modica, Salvatore Di Fazio, Viviana Tirella, Raimondo Tripodi,
Carmelo Riccardo Fichera
Department of Agriculture, Mediterranea University of Reggio Calabria, Italy
Non
commercial
use
the phases of food production, processing and conservation (Saggio, 2016). A substantial portion of the energy used by a build-ing is destined to its microclimate control to ensure the workers’ thermal comfort as well as the optimal conditions required by raw materials conservation and food processing and storage. Moreover, consumers demand ever increasing levels of safety and sustainabil-ity of the entire food chain of production (Barreca et al., 2014). Therefore, it is crucial to have tools and methods that allow pre-cisely assessing the energy performance of an agri-food building and, at the same time, are of easy and quick application. The accu-racy of the results obtained from the currently available calculation models is, however, linked to the level of detail of constructional and geometric modelling. When design information is not avail-able, geometric modelling is the most delicate and time-consuming phase of the whole process of energy diagnosis. This is the case of historic agricultural buildings, many of which are presently used, in Italy, for production purposes and have undergone continuous adaptation, over time, to meet the changing requirements of food processing and storage. In particular, centuries-old wineries and olive-oil mills, not only still play their functional role, but are also considered as an important part of the architectural heritage to be protected. Advanced 3D surveying techniques can facilitate the building modelling and enable experts and professionals in the sec-tor to use and apply highly efficient and accurate calculation and energy analysis models. 3D laser scanner systems are widely used and tested for surveying both civil buildings and historical and artistic architectural artefacts (Chiabrando et al., 2016). Nevertheless, it should be stressed that geometric modelling alone, however detailed it may be, does not allow for specific analyses on the thermal behaviour of the envelope (Porto et al., 2015), since any energy analysis model, even for generic application, needs data on the thermophysical characteristics of the materials in the envelope as well as on thermal stresses and on the use of space.
Recently, research has been focused on the implementation of automated procedures and techniques for the generation of build-ing information modellbuild-ing (BIM) to assess buildbuild-ing energy perfor-mance (Wang and Cho, 2015). Actually, some specific productive and modern industrial buildings do not require highly accurate assessment of their energy performance but only data that may allow applying environmental sustainability models (SBMethod, Itaca, Leed, etc.). The objective of this paper is to propose a semi-automated method for obtaining a building energy model (BEM) of existing productive buildings, particularly those of historical interest, in order to apply energy assessment and environmental sustainability protocols and models. In particular, an original methodology for the construction of the thermo-physical model of the building is proposed in order to enable a subsequent applica-tion of advanced models of energy consumpapplica-tion and energy audits that can meet the requirements of specific food processing tech-nologies or test the specific internal thermal conditions (Campolo et al., 2013).
Materials and methods
The proposed method (Figure 1) is based on advanced surveying techniques that make use of terrestrial laser scanner (TLS) instru-ments, which provide the geometric definition of the building by acquiring a point cloud. The rendered building components are clas-sified into three different categories (vertical, horizontal or inclined), which are then sub-classified according to their thickness. Then, thanks to infrared (IR) images obtained from thermographic
survey-ing, these components are analysed to detect the parts showing differ-ent thermal behaviours. These compondiffer-ents are geometrically defined through techniques of pre-processing and vectorization of the IR images overlapping the already acquired geometric data. This proce-dure allows discriminating points that, if only geometrically surveyed would be attributed to the same category, but actually belong to sur-faces of components with different thermal capacities. The analysis of the spatial variation of surface temperatures through IR techniques contributes to the detection of the different components of the build-ing, since these, while having similar geometrical characteristics and apparently consisting of one same material, may show different ther-mal behaviour. Thus, the previously acquired point cloud is processed by dedicated software and the objects and elements composing the building are integrated with information on their homogeneous ther-mal behaviour. All this contributes to the development of the BIM (Mahdjoubi et al., 2013). In the subsequent phase, a series of precise on-site measurements, taken with thermographic and heat flow meter techniques, allows acquiring and analysing data on the main thermo-physical characteristics of components. The utilised methods, howev-er accurate they may be, must be based on simple on-site and indoor measurements, carried out by means of expeditious and non-invasive tools and procedures, so as not to hamper the usual productive activ-ities (Ghazi Wakili et al., 2003; Ham and Golparvar-Fard, 2015). The subsequent elaboration of the model through CAD software and ded-icated tools allows associating the information on the main thermo-physical characteristics of the building components to the objects composing BIM and, therefore, constructing the BEM. The BEM enables to simulate and assess the building energy performance, par-ticularly in relation to external heat stresses and to thermal indoor environmental requirements as well as to the operational conditions needed to ensure workers’ wellbeing and proper product processing and conservation. The BEM allows carrying out subsequent thermal analyses even in dynamic regime, or evaluating the effect of external climatic variations on internal operating conditions. This procedure requires knowledge of a series of data representative of the actual cli-matic conditions of the site for a significant time interval, which is not always available. However, it is possible to perform an energy diag-nosis by means of a tailored rating system, in compliance with current regulations (UNI CEI EN 16247-1-2, UNI CEI /TR 11428, CTI Guidelines).
Case study
The proposed method (Figure 1) was applied on an old oil mill situated in a representative area of Southern Italy, in the province of Reggio Calabria (Lat. 38.2649° N, Long. 16.1857° E), which is the case study of this paper. Some characteristics of the building appear as coherent with the local typological and constructional characteristics: rubble masonry load-bearing walls, longitudinal timber roof structure supported by masonry arches, pitched roof covered by pantiles. The original structure was built in the 19th
century. Over time, it has undergone various spatial remodelling and constructional transformations, which can be neither easily traced and documented nor considered as specifically aimed at the improvement of building energy performance. In particular, the building indoor space, was modified to ensure the correct execu-tion of the productive process and to better suit technological inno-vation, following the changes in machinery, plants, processing lines, regulations, etc. The present plan layout of the building is shown in Figure 2. Three main functional areas can be singled out: delivery area, pre-processing and processing area, olive oil storage area. There are also service areas and an external area used for the temporary storage of production solid waste.
Non
commercial
use
Advanced surveying techniques
The construction of a faithful BIM of the examined building depends on a careful surveying project and on the level of com-pleteness of the point cloud it generates. The surveying project allows checking the weaknesses of the characteristics to survey, whether they are metric, functional, constructional or structural, as well as ensuring a fluid workflow and complete surveying.
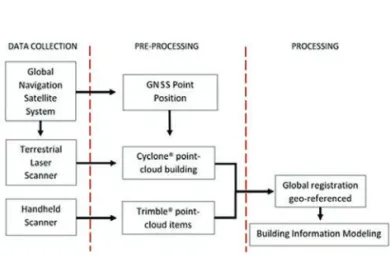
Figure 3 shows the flowchart of the proposed method aimed at obtaining the geo-referenced 3D point cloud. The dimensional data of the building, of the machinery stored inside and of the site were respectively acquired by means of the following tools: TLS Leica®
C10, handheld scanner (HS) Trimble®DPI-8 and geodetic global
navigation satellite system (GNSS) Leica®GS12. The use of a HS
in the indoor survey is motivated by the presence of machinery causing the problem of cast-shadows (Hu et al., 2016) thus deter-mining several blind spots not detectable by the TLS. Raw data collected as 3D point clouds from several surveys have been homogenised into a single platform.
In the first step, the inside and the outside of the building were surveyed by utilising exclusively TLS. Therefore, the survey coor-dinate system was relative and the various scans were then pro-cessed through different software platforms (Figure 3) to obtain a co-registered 3D point cloud. After obtaining the whole merged 3D survey, the external stations of TLS were detected on site with the geodetic GNSS in order to obtain the geographic coordinates and, as a result, to reference the survey within an absolute geo-graphic reference system.
The integration of the surveying systems was ensured by the interoperability between the different software platforms and by the utilisation of the open E57 file format. The coordinates of the homologous vertices in the point clouds belonging to the new geo-graphic reference system were extrapolated from the point cloud representing the overall data. The dimensional data obtained from the HS allowed perfect integration of the systems through the assignment of the new positional parameters. Thus, the parametric model, implemented by means of advanced geomatics surveying techniques and aimed at analysing the energy performance of the building, was constructed. With a view to analysing the building thermal behaviour and detecting possible non-uniformities on the heat capacity and transmittance of the components of the building envelope, an expeditious thermographic survey of the building was carried out with a FLIR®B335 thermographic camera. In the
pro-posed procedure, the thermographic analysis allows expeditiously evaluating the thermophysical characteristics of the envelope and the different thermal behaviour of its components (e.g., due to ther-mal bridges, heterogeneous materials or localised heat losses) without interfering with the normal working operations taking place inside and outside the building (Figure 4).
Since thermographic analysis is a technique based on the mea-surement of radiant heat in the infrared spectrum of a body, its cor-rect execution is affected by environmental factors, such as dicor-rect solar radiation, air temperature, humidity and speed as well as by surface optical properties like thermal emissivity and solar reflectance. Yet, in this specific case, the analysis has the only qualitative objective to highlight the presence of components with a different thermal behaviour.
Then, the point cloud was converted into a parametric element in order to generate an as-built BIM, the so-called historic-BIM (Chiabrando et al., 2016). The point cloud was registered in Cyclone®software; metric data were converted into Recap®; and
imported into Revit®. This BIM software suite imports parametric
objects, i.e. primitive objects like surface, BEZIER spline and
Figure 1. Flowchart showing the main phases of the proposed method.
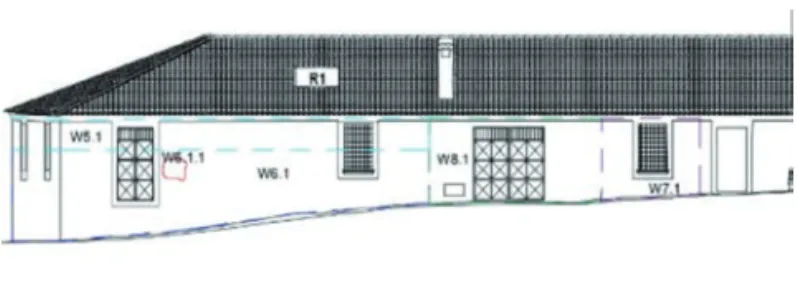
Figure 2. Plan layout and main functional areas of the building case study.
Figure 3. Flowchart showing the main steps of the data survey analysis leading to the building information modelling.
Non
commercial
use
NURBS, and converts them into walls, columns and other building components.
The integration of the geometric survey and the thermal map obtained from infrared thermal surveying allowed reconstructing the BIM of the whole building, which was made up of elements with different geometrical shapes and/or thermophysical behaviour (Figure 5).
3D modelling: from building information model to
building energy model
The aim of obtaining a digitalised 3D model, which could con-tain all the information on the building, such as thermal zone lay-out, construction type, local weather data, HVAC system, operat-ing schedules, space loads (lightoperat-ing, appliances and occupants), derives from the need for a single model to be submitted to a tractor and for an optimised management of the information con-cerning the entire building life cycle: design, construction, mainte-nance, operation and demolishing (Barbaresi et al., 2017). The importance of BIM resides in the interoperability between the dif-ferent specialisations, i.e. architects, structural engineers, plant engineers. If, on the one hand, this is a clear step towards a com-puter-standardised process to get a model containing multi-disci-plinary data on a particular building, on the other hand, there is a gap between the BIM and the parameterisation of the existing buildings. Despite the importance of BIM for the preservation of memory and for restoration projects of architectural assets, the dif-ficulty in modelling its geometry and integrating thermal charac-teristics is still evident. The evaluation of the thermophysical char-acteristics of the materials of building components is quite com-plex, above all if it is carried out on site with portable equipment and tools and under uncontrollable environmental conditions (Ghazi Wakili et al., 2003). It is important not only to know the thermal conductance of the building envelope (Ham and Golparvar-Fard, 2015) but also the heat capacity of the compo-nents. The heat flow meter method was utilised for the developed application.
This specific method is based on the measurement, at set time intervals, of the density of heat flow rate q through a building com-ponent and on the contemporary measurement of temperatures on the two exposed faces (ISO 9869-1:2014). Thermal conductance Λ [W·m–2·K–1] and the internal areal heat capacity [J·K–1·m–2] are
calculated by means of formulae (1) and (2) (Barreca and Fichera, 2016), respectively, using the progressive average method, in order to limit the influence of the thermal transient period:
(1)
(2) where: Λ, thermal conductance [W·m-2·K-1]; k, areal heat capacity
[J·K–1·m–2]; C, heat capacity [J·K–1]; qc, density of heat flow rate
(cold face) [W·m–2]; qh, density of heat flow rate (hot face) [W·m– 2] Th, hot surface temperature [K]; Tc, cold surface temperature
[K]; Q, density of heat energy [J·m–2]; q, density of heat flow
[W·m–2]; Th, heat flow [W]; t, time [s].
In the progressive average method, the parameters mentioned above were measured at set time intervals of 300 s for 72 h.
The BIM obtained through Leica® Cyclone® software was
imported and processed with Autodesk®Revit® software, which
allowed associating to each elementary component the thermo-physical properties of the materials composing it (Table 1).
The model obtained becomes more significant than the simple geometric model, since it is a smart model containing information and intrinsic data of the building that may not be limited to its ther-mophysical properties but include further data for structural or life cycle analyses, etc. In order to better manage the model, each com-ponent was indexed. The first index was referred to a category (vertical, horizontal and inclined); the second was referred to thickness; the third was referred to thermal characteristics; and the fourth to the possible irregular thermal characteristics in the same component (Table 1).
Table 1. Values of the thermophysical characteristics assigned to components.
Component Width Area Volume Transmittance Heat [cm] [m2] [m3] [W·m–2·k–1] capacity [kJ·K–1] W5.1 59.00 110.70 15.50 3.65 121.29 W6.1 60.00 321.90 48.20 3.67 123.27 W6.1.1 60.00 0.53 0.32 4.20 170.67 W6.2 60.00 512.20 61.50 4.15 124.66 W6.3 60.00 143.20 22.90 3.67 123.27 W7.1 65.00 56.40 9.00 3.45 134.00 W8.1 80.00 106.90 21.00 2.84 165.61
Figure 4. A) Infrared thermo-graphic camera. B) Thermo-graphic analysis of the building.
Figure 5. External wall of the building showing the components with a different thermophysical behaviour.
Non
commercial
use
Results and discussion
The construction of the BEM allows accurately evaluating the building energy performance both in a steady state and under dynamic thermal conditions. In the latter case, it is necessary to know the most probable values of microclimate parameters throughout the duration of the study and at time intervals that are compatible with its objectives. In the examined case study, Design Builder® software with Energy Plus™ solver was utilised.
Importing the generated BEM was not particularly difficult, since, thanks to the special gbXML exchange format, it was possible to transfer the data associated to BIM to specialised analysis software programmes. In particular, the regulations concerning the stan-dardisation of the exchange file formats of the various software programmes operating with BIM are being studied and continu-ously updated. The CEN working on BIM established the working group CEN/BT/WG 215 BIM, which is promoted and coordinated by Norway (UNI, 2015). The first three ISO standards are: i) BIM Information Delivery MaCnual (IDM)-ISO 29481, parts 1 and 2; ii) Industry Foundation Classes (IFC) - ISO 16739; iii) International Framework for Dictionaries (IFD) - ISO 12006, parts 2 and 3.
Nevertheless, a few interventions on the imported model were needed. For instance, it was necessary to redefine the position and orientation of the building because, even if the generated BIM model was originally georeferenced through geographic coordi-nates, this information was not kept while importing it from the energy analysis software. As a result, it was necessary to identify the area among the nearest ones and among those whose data were already contained in the software database (in this specific case, Reggio Calabria) (Figure 6). Furthermore, it was necessary to choose the activities carried out, the generated indoor thermal load, the indoor environment control systems, the periods of simulation and analysis.
For example, a series of dynamic thermal simulations were carried out on the studied building.
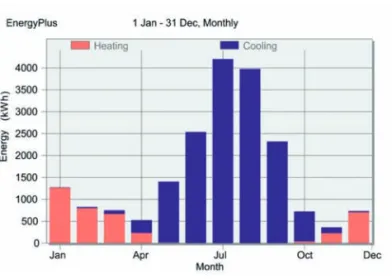
The simulation was carried out considering an electric cooling generation system with a coefficient of performance (CoP) as 2.5 and a minimum internal temperature of 12°C and a humidity of 0.0077 (g/g); and an electric heating generation system with a CoP of 2.0 and a maximum internal temperature of 35°C and a humidity of 0.0156 (g/g). The simulation concerned the estimation of annual energy consumption for indoor thermal control in order to maintain air temperature values in the range considered as optimal in rela-tion to specific activities and funcrela-tional areas (i.e., 5÷18°C in the oil storage area; 18°÷20°C in the processing and working areas). The result showed that the energy consumed for heating was about 4000 kWh, with a peak in January, while the energy consumed every year for cooling was about 15,600 kWh, with a peak between July and August, almost four times as much as the one used for heating (Figure 7).
Conclusions
Thanks to dedicated software programmes, the BEM allows carrying out simulations and accurate analyses of the building ther-mal behaviour. Once the BEM is defined within the analysis soft-ware, for example, it is possible to compare hypotheses of inter-ventions to improve the building passive performances; to evaluate the costs of possible thermal control systems; or to find an optimal solution in terms of adequate window area or proper thickness of
the thermal insulation layer of walls. The construction of BIM and BEM is now a well-established practice only in the design of new buildings, not for existing buildings. This paper proposes a prompt method for the construction of BIM and BEM starting from exist-ing buildexist-ings and shows the advantages it can offer when applied to historic agri-food buildings. In particular, BEM is a crucial tool for a company that must monitor the operating costs of its premises and production; for an expert who has to evaluate the effectiveness of project solutions to improve and modernise a business; and for the public administration that wishes to monitor the environmental sustainability of productive buildings.
The application to the case study considered in this paper revealed a series of weaknesses, such as: i) the lack of full integra-tion between laser scanning data processing software and CAD and BIM software; ii) the difficulty in characterising the thermal behaviour of the materials and components of the building on site, by means of expeditious methods; iii) the lack of microclimate data on the territory (temperature and air humidity, solar radiation and wind speed), which are suitable to conduct accurate thermal simulations on buildings even under dynamic conditions.
Figure 6. Outdoor air temperature.
Figure 7. Monthly energy consumption for the air-conditioning of the building.
Non
commercial
use
References
Barbaresi A., Torreggiani D., Tinti F., Tassinari P. 2017. Analysis of the thermal loads required by a small-medium sized winery in the Mediterranean area. J. Agricult. Eng. XLVIII(s1):9-20. Barreca F., Cardinali G., Fichera C.R., Lamberto L., Modica G.
2014. A fuzzy-based model to implement the global safety buildings index assessment for agri-food buildings. J. Agricult. Eng. 45:24-31.
Barreca F., Fichera C.R. 2016. Thermal insulation performance assessment of agglomerated cork boards. Wood Fiber Sci. 48:96-103.
Campolo O., Verdone M., Laudani F., Malacrinò A., Chiera E., Palmeri V. 2013. Response of four stored products insects to a structural heat treatment in a flour mill. J. Stored Prod. Res. 54:54-8.
Chiabrando F., Sammartano G., Spanò A. 2016. Historical build-ings models and their handling via 3D survey: from points clouds to user-oriented HBIM. ISPRS - Int. Arch. Photogramm. Remote Sens. Spat. Inf. Sci. XLI-B5:633-40. Ghazi Wakili K., Binder B., Vonbank R. 2003. A simple method to
determine the specific heat capacity of thermal insulations used in building construction. Energy Build. 35:413-5. Ham Y., Golparvar-Fard M. 2015. Mapping actual thermal
proper-ties to building elements in gbXML-based BIM for reliable building energy performance modeling. Autom. Constr. 49:214-24.
Hu Q., Wang S., Fu C., Ai M., Yu D., Wang W. 2016. Fine survey-ing and 3D modellsurvey-ing approach for wooden ancient architec-ture via multiple laser scanner integration. Remote Sens. 8:270.
Kaminski J., Leduc G. 2010. Energy efficiency improvement
options for the EU food industry. Polityka Energ. 13:81-97. Mahdjoubi L., Moobela C., Laing R., 2013. Providing real-estate
services through the integration of 3D laser scanning and building information modelling. Comput. Ind. 64:1272-81. Moneta R., Di Franco N., Bertini I. 2015. Rapporto annuale
effi-cienza energetica 2015. Agenzia Nazionale per l’Effieffi-cienza Energetica, Roma, Italy. Available from: http://www.enea.it/ it/seguici/pubblicazioni/pdf-volumi/raee-2015.pdf
Monforti-Ferrario F., Dallemand J., Pascua I.P., Motola V., Banja M., Scarlat N., Medarac H., Castellazzi L., Labanca N., Bertoldi P., Pennington D., Goralczyk M., Schau E.M., Saouter E., Sala S., Notarnicola B., Tassielli G., Renzulli P. 2015. Energy use in the EU food sector: state of play and opportuni-ties for improvement. EUR 27247 EN - Joint Research Centre - Institute for Energy and Transport and Institute for Environment and Sustainability. Publications Office of the European Union, Luxembourg. Available from: http://publica-tions.jrc.ec.europa.eu/repository/bitstream/JRC96121/ldna272 47enn.pdf
Porto S.M.C., Valenti F., Cascone G., Arcidiacono C. 2015. Thermal insulation of a flour mill to improve effectiveness of the heat treatment for insect pest control. Agric. Eng. Int. CIGR J. 94-104.
Saggio L. 2016. Con efficienza energetica risparmi fino al 70%. Terra e Vita 25:20.
UNI (Ente Italiano di Normazione). 2015. "Rivoluzione" BIM. Anche nella normazione tecnica; giovedì 19 febbraio. Available from: http://www.uni.com/index.php?option= com_content&view=article&id=3554%253Arivoluzione-bim-anche-nella-normazione-tecnica&catid=171&Itemid=2612 Wang C., Cho Y.K., 2015. Performance evaluation of
automatical-ly generated BIM from laser scanner data for sustainability analyses. Procedia Eng. 118:918-25.