© The Author 2015. Published by Oxford University Press on behalf of the Maryland Psychiatric Research Center.
This is an Open Access article distributed under the terms of the Creative Commons Attribution License (http://creativecommons.org/licenses/by/3.0/), which permits unrestricted reuse, distribution, and reproduction in any medium, provided the original work is properly cited.
Cortisol and Inflammatory Biomarkers Predict Poor Treatment Response in First
Episode Psychosis
Valeria Mondelli*,1,2, Simone Ciufolini2,3, Martino Belvederi Murri1, Stefania Bonaccorso3, Marta Di Forti3, Annalisa Giordano3, Tiago R. Marques3, Patricia A. Zunszain1,2, Craig Morgan4, Robin M. Murray2,3, Carmine M. Pariante1,2, and Paola Dazzan2,3
1Department of Psychological Medicine, King’s College London, Institute of Psychiatry, Psychology and Neuroscience, London,
UK; 2National Institute for Health Research Mental Health Biomedical Research Centre at South London and Maudsley NHS
Foundation Trust and King’s College London, London, UK; 3Department of Psychosis Studies, King’s College London, Institute of
Psychiatry, Psychology and Neuroscience, London, UK; 4Department of Health Services and Population Research, King’s College
London, Institute of Psychiatry, Psychology and Neuroscience, London, UK
*To whom correspondence should be addressed; Sections of Perinatal Psychiatry & Stress, Psychiatry and Immunology (SPI-Lab), Centre
for the Cellular Basis of Behaviour, The James Black Centre, Institute of Psychiatry, Psychology and Neuroscience, King’s College London, 125 Coldharbour Lane, London SE5 9NU, UK; tel: 44-0-20-7848-0352, fax: 44-0-20-7848-0986, e-mail: valeria.mondelli@kcl.ac.uk Background: Cortisol and inflammatory markers have
been increasingly reported as abnormal at psychosis onset. The main aim of our study was to investigate the ability of these biomarkers to predict treatment response at 12 weeks follow-up in first episode psychosis. Methods: In a longitudinal study, we collected saliva and blood samples in 68 first episode psychosis patients (and 57 controls) at baseline and assessed response to clinician-led antipsy-chotic treatment after 12 weeks. Moreover, we repeated biological measurements in 39 patients at the same time we assessed the response. Saliva samples were collected at multiple time points during the day to measure diurnal cortisol levels and cortisol awakening response (CAR); interleukin (IL)-1β, IL-2, IL-4, IL-6, IL-8, IL-10, tumor necrosis factor-α, and interferon-γ (IFN-γ) levels were analyzed from serum samples. Patients were divided into Non-Responders (n = 38) and Responders (n = 30) accord-ing to the Remission symptom criteria of the Schizophrenia Working Group Consensus. Results: At first onset, Non-Responders had markedly lower CAR (d = 0.6, P = .03) and higher IL-6 and IFN-γ levels (respectively, d = 1.0, P = .003 and d = 0.9, P = .02) when compared with Responders. After 12 weeks, Non-Responders show persistent lower CAR (P = .01), and higher IL-6 (P = .04) and IFN-γ (P = .05) when compared with Responders. Comparison with controls show that these abnormalities are present in both patients groups, but are more evident in Non-Responders. Conclusions: Cortisol and inflammatory biomarkers at the onset of psychosis should be considered as possible predic-tors of treatment response, as well as potential targets for the development of novel therapeutic agents.
Key words: HPA axis/cytokine/inflammation/outcome/
stress/schizophrenia Introduction
Early treatment response is one of the strongest predic-tors of long-term symptomatic and functional outcome in psychosis.1 Unfortunately, we do not have reliable
predic-tors of early treatment response in first episode psychosis, which makes it impossible to tailor psychiatric care to the needs of the individual patient. Biomarkers of stress and inflammation hold great potential as clinical predictors of treatment response: stress plays a recognized role in precipitating the onset and relapse of psychosis, and the cortisol stress response is already abnormal at psycho-sis onset2–4; moreover, increased inflammation has been
shown to predict lack of a pharmacological response in depressed patients.5,6 In psychosis, neuroimaging
bio-markers have been shown to predict treatment response, including our own work assessing cortical folding defects and white matter integrity in first episode psychosis,7,8 but
neuroimaging findings may lack the immediate transla-tional impact of a blood- or saliva-based biomarker. To our knowledge, no study has assessed whether (salivary) cortisol or serum inflammatory biomarkers predict treat-ment response at the onset of psychosis.
First episode psychosis patients show abnormalities in the activation of the main biological system involved in the stress response, the hypothalamic-pituitary-adrenal (HPA) axis.9–11 In particular, individuals at the
onset of psychosis show a specific pattern of HPA axis
abnormalities, distinct from depression or other psychi-atric disorders, of increased cortisol levels throughout the day, blunted cortisol awakening response (CAR), and decreased cortisol response to psychosocial stressors.12–14
Interestingly, the blunted CAR and the reduced HPA axis reactivity to stress have also been associated with more severe symptoms and worse cognitive function in patients with psychosis.15,16 Furthermore, the blunted CAR is not
normalized by antipsychotic treatment, indicating that it may represent a stable biological feature of psychosis.12,17
Recent work has also shown a role for inflammation in the pathogenesis of psychotic disorders.18–20 Individuals
suffering with psychosis show increased cytokine levels in peripheral blood and cerebrospinal fluid and both at illness onset and in later stages of the disorder.21 We have
also previously shown that increased inflammation and higher cortisol levels both contribute to smaller hippo-campal volume at the onset of psychosis.3
Only few studies have attempted to clarify the asso-ciation between stress or inflammatory biomarkers, and clinical outcome (not specifically treatment response), in psychosis. A previous study investigating HPA axis activ-ity in patients with chronic schizophrenia has reported that persistent nonsuppression of cortisol levels follow-ing the dexamethasone test after 4 weeks of antipsychotic treatment was associated with poor clinical outcome.22
Conversely, a reduction in cortisol levels after 12 weeks of antipsychotic treatment was associated with an improve-ment in psychotic symptoms at 12 weeks follow-up, in both chronic and first episode psychosis patients.23,24 Only
3 studies investigated the link between inflammation and clinical outcomes in psychosis, and all were conducted in patients with chronic schizophrenia; interestingly, they all found that higher inflammation was associated with a poorer clinical outcome, as indicated by either less improvement or earlier relapses.23,25,26 Of note in this
context, abnormal cortisol and inflammatory biomarkers have also been described in association with experiences of early life trauma, both in depression and in psycho-sis12,18,27,28; moreover, early life trauma in depression is
associated with lack of treatment response,29 although no
such data are available in psychosis.
We conducted a naturalistic longitudinal study in which first episode psychosis were assessed at baseline (ie, as soon as possible, and not later than 3 months, after the first contact with psychiatric services), and then were followed up prospectively for their treatment response at 12 weeks. The antipsychotic treatment was clinician-led, and we did not influence medication choice. We also com-pleted a second biomarker assessment at 12 weeks. The aims of our study were: (1) to investigate whether cortisol and inflammatory biomarkers at baseline predicted treat-ment response at the 12 weeks follow-up; (2) to assess if
changes in these biomarkers over the first 12 weeks were
associated with treatment response in the same patients; and (3) to clarify if the putative relationships between
these biomarkers and treatment response was partly influenced by previous experience of early life trauma. Methods
Subjects Recruitment and Study Design
Sixty-eight first episode psychosis patients were recruited in South-East London (UK) as part of the Genetics and Psychosis study. The recruitment strategy was based on contacting inpatients and outpatients units of the South London and Maudsley (SLAM) NHS Foundation Trust, interviewing staff and reviewing clinical notes, and approaching all subjects aged 18–65 who presented for the first time to these services for a functional psychotic ill-ness. Patients with organic psychosis, learning disabilities or not fluent in English were excluded from the study.30,31
Fifty-seven healthy controls were recruited from the same catchment area as the patients through advertise-ment in local newspapers, hospitals, and job centers, as well as from existing volunteer databases. Controls were screened using the Psychosis Screening Questionnaire32
and were excluded if they met criteria for a present or past psychotic disorder.
All patients were assessed as soon as possible after their first contact with psychiatric services, and not later than 3 months from this first contact. At 12 weeks, a clinical follow-up was completed on all patients to estab-lish response, and a subset of 39 patients also repeated the biomarker measurements. Not all the 39 subjects completed both cortisol and cytokine assessments; in particular, of these 39 subjects, 24 repeated the cortisol assessment and 33 had serum collected and cytokines analyzed. The study was approved by the local Research Ethics Committee, in accordance with the code of ethics of the World Medical Association, and written informed consent was obtained from all participants.
Clinical Assessment and Treatment Response
At the time of the first assessment, 7 patients were drug naive, 33 were taking olanzapine, 16 were taking ris-peridone, 4 were taking quetiapine, and 8 were taking aripiprazole. Thirty-seven patients received a DSM-IV diagnosis of schizophrenia/schizophreniform disorder, 22 of schizoaffective or affective psychosis, 7 of psychotic disorder not otherwise specified, and 2 of delusional dis-order. Validation of clinical diagnosis was obtained using the Operational Criteria (OPCRIT+),33 reviewing the
case notes in the first month following first contact with services. All diagnoses were performed by qualified psy-chiatrists, subject to comprehensive training and inter-rater reliability testing (κ = 0.9). Psychotic symptoms were evaluated both at baseline and follow-up, using the Positive and Negative Syndrome Scale (PANSS).34
Response to treatment at 12 weeks was evaluated using information obtained from clinical records, patient
face-to-face interviews, and reports from informants, using the World Health Organization Personal and Psychiatric History Schedule—Follow-up, a standard-ized instrument to record presence and severity of symp-toms that has been successfully used in World Health Organization multicenter studies of the incidence and outcome of schizophrenia.35 As we previously reported,8
response was operationalized as a reduction in symptom severity to the levels required by the remission criteria of the Schizophrenia Working Group Consensus.36 This
consensus established a set of criteria that provide an absolute threshold in severity of symptoms that should be reached for clinical improvement. This approach was therefore preferred to symptom change cutoffs for this naturalistic study, since cut-off points are often arbitrary, affected by variability in baseline symptom severity across studies, and are not understood intuitively by clinicians. Instead, the remission criteria proposed by the consensus are more suited for traditional concepts of remission in psychiatric disorders. For those patients who could not be reassessed at 12 weeks (n = 20), information on treatment response was obtained using the Personal and Psychiatric History Schedule (PPHS).35 As previously published,7,8
for the purposes of treatment response, we considered the PPHS scores equivalent to the PANSS scores as fol-lows: 0 was equivalent to PANSS scores 1, 2, and 3; 1 was equivalent to PANSS scores 5 and 6; and 2 was equiva-lent to PANSS scores 7 and 8. In a series of secondary
analyses we also used a continuous measure of treatment response. This was estimated as change in PANSS total scores from baseline to follow-up, taking into account baseline PANSS total score and subtracting a score of 30, as even individuals without any mental health problem could score 30 in the PANSS. Therefore, as done in previ-ous articles,37 we used the following formula: ((baseline
PANSS total score − 30) − (follow-up PANSS total score − 30)/(baseline PANSS total score − 30) × 100).
We collected information about stressful life events that occurred in the previous 6 months using a brief life events questionnaire,38 and we measured perceived stress
in the previous month using the Perceived Stress Scale.39
Information about childhood trauma was also collected using a modified version of the Childhood Experience of Care and Abuse Questionnaire, as previously published.40
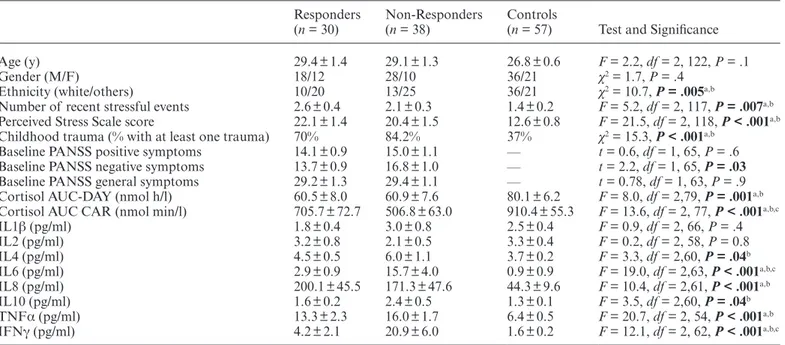
The sociodemographic characteristics of the sam-ples are shown in table 1. Using the above-mentioned criteria, 30 patients were classified as Responders and 38 as Non-Responders. Non-Responders had signifi-cantly higher scores of PANSS negative symptoms at baseline when compared with Responders (P = .03, see
table 1). The mean duration of antipsychotic treatment at baseline was 35.5 ± 5.0 days for Responders and 46.3 ± 5.3 days for Non-Responders (P = .2). The cumula-tive dose of antipsychotic treatment received at the time of baseline assessment was not statistically differ-ent between Responders (chlorpromazine equivaldiffer-ents Table 1. Sociodemographic Characteristics and Baseline Levels of Stress Biomarkers
Responders
(n = 30) Non-Responders (n = 38) Controls (n = 57) Test and Significance
Age (y) 29.4 ± 1.4 29.1 ± 1.3 26.8 ± 0.6 F = 2.2, df = 2, 122, P = .1
Gender (M/F) 18/12 28/10 36/21 χ2 = 1.7, P = .4
Ethnicity (white/others) 10/20 13/25 36/21 χ2 = 10.7, P = .005a,b
Number of recent stressful events 2.6 ± 0.4 2.1 ± 0.3 1.4 ± 0.2 F = 5.2, df = 2, 117, P = .007a,b
Perceived Stress Scale score 22.1 ± 1.4 20.4 ± 1.5 12.6 ± 0.8 F = 21.5, df = 2, 118, P < .001a,b
Childhood trauma (% with at least one trauma) 70% 84.2% 37% χ2 = 15.3, P < .001a,b
Baseline PANSS positive symptoms 14.1 ± 0.9 15.0 ± 1.1 — t = 0.6, df = 1, 65, P = .6
Baseline PANSS negative symptoms 13.7 ± 0.9 16.8 ± 1.0 — t = 2.2, df = 1, 65, P = .03 Baseline PANSS general symptoms 29.2 ± 1.3 29.4 ± 1.1 — t = 0.78, df = 1, 63, P = .9
Cortisol AUC-DAY (nmol h/l) 60.5 ± 8.0 60.9 ± 7.6 80.1 ± 6.2 F = 8.0, df = 2,79, P = .001a,b
Cortisol AUC CAR (nmol min/l) 705.7 ± 72.7 506.8 ± 63.0 910.4 ± 55.3 F = 13.6, df = 2, 77, P < .001a,b,c
IL1β (pg/ml) 1.8 ± 0.4 3.0 ± 0.8 2.5 ± 0.4 F = 0.9, df = 2, 66, P = .4 IL2 (pg/ml) 3.2 ± 0.8 2.1 ± 0.5 3.3 ± 0.4 F = 0.2, df = 2, 58, P = 0.8 IL4 (pg/ml) 4.5 ± 0.5 6.0 ± 1.1 3.7 ± 0.2 F = 3.3, df = 2,60, P = .04b IL6 (pg/ml) 2.9 ± 0.9 15.7 ± 4.0 0.9 ± 0.9 F = 19.0, df = 2,63, P < .001a,b,c IL8 (pg/ml) 200.1 ± 45.5 171.3 ± 47.6 44.3 ± 9.6 F = 10.4, df = 2,61, P < .001a,b IL10 (pg/ml) 1.6 ± 0.2 2.4 ± 0.5 1.3 ± 0.1 F = 3.5, df = 2,60, P = .04b TNFα (pg/ml) 13.3 ± 2.3 16.0 ± 1.7 6.4 ± 0.5 F = 20.7, df = 2, 54, P < .001a,b IFNγ (pg/ml) 4.2 ± 2.1 20.9 ± 6.0 1.6 ± 0.2 F = 12.1, df = 2, 62, P < .001a,b,c Note: AUC, area under the curve; CAR, cortisol awakening response; IFN, interferon; IL, interleukin; PANSS, Positive and Negative
Syndrome Scale; TNF, tumor necrosis factor. P values <0.05 are in bold. Post-hoc analyses significance is reported as follow:
aP < .05 Responders vs Controls.
bP < .05 Non-Responders vs Controls.
cP < .05 Responders vs Non-Responders.
8091.8 ± 1387.8) and Non-Responders (chlorpromazine equivalents 13 115.4 ± 2865.2, P = .2). The cumulative dose of antipsychotic treatment received at the time of follow-up assessment was also not significantly differ-ent between Responders (chlorpromazine equivaldiffer-ents 21 422.5 ± 3493.6) and Non-Responders (chlorproma-zine equivalents 31 345.5 ± 5233.8, P = 0.1).
Salivary Cortisol Assessment
Cortisol was measured in the saliva as CAR and daily profile in 65 patients and in 33 controls. Twenty-four of the 65 patients who completed cortisol assessments at baseline also completed cortisol assessment at 12 weeks follow-up. Subjects were instructed to collect saliva sam-ples immediately after awakening (0 min) and 15, 30, and 60 min after awakening, and again at 1200 h and at 2000 h; details of saliva collection for these subjects have been already reported in previous articles.12,16,41 Cortisol levels
were analyzed using the High Sensitivity Salivary Cortisol ELISA KIT from Salimetrics following the recommended procedure. As published before,10 a small number (20%)
of samples were also measured using “Immulite”—DPC’s Immunoassay analyzer (www.diagnostics.siemens.com), and the reliability between the 2 methods was found to be very high (z-scores; r = .93; P < .001).
We used 2 summary measures of HPA axis activity: the area under the curve (AUC) of cortisol levels during the day (AUC-DAY; 0 min after awakening, 12 and 20 h) and the AUC of CAR (0, 15, 30, and 60 min after awakening); both formulas for the calculation of AUC were derived from the trapezoid formula as described by Pruessner et al42, and standardized z scores were used for statistical
analyses, as previously published.10
Cytokines Analyses
Blood samples were collected in 34 patients (at baseline) and 36 controls using clot activator tubes for serum anal-ysis. All patients but one (n = 33) had serum collected and cytokines analyzed also at 12 weeks follow-up. The serum was separated, aliquoted, and stored at −70°C before use. Biochip array technology was used to perform
simultaneous quantitative detection of multiple analytes from a single patient sample. The core technology is the Randox Biochip (http://www.randox.com), a solid-state device containing an array of discrete test regions of immobilized antibodies specific to different cytokines and growth factors. A sandwich chemiluminescent immu-noassay was employed for the cytokine array. This cyto-kine array measures the following cytocyto-kines and growth factors: interleukin (IL)-1α, IL-1β, IL-2, IL-4, IL-6, IL-8, IL-10, tumor necrosis factor- α (TNF-α), interferon-γ (IFN-γ), vascular endothelial growth factor (VEGF), epidermal growth factor (EGF), and monocyte chemo-tactic protein-1 (MCP-1). Intra-assay precision and sen-sitivity of the cytokine array has been shown in previous published articles.18 We excluded IL-1α, VEGF, EGF,
and MCP1 from the statistical analyses, as levels of most of the values were below the detection limit.
Data Analyses
Data were analyzed using the Statistical Package for Social Sciences, Version 15.0 (SPSS Inc). Continuous variables are presented as mean ± standard error of the mean. Chi-square tests were used to compare categorical variables between patients and controls. One-way ANOVAs followed by least significant difference (LSD) post-hoc analyses were applied to test differences in biomarkers among Responders, Non-Responders, and controls at baseline. Repeated measures ANOVAs were applied to test longitudinal within-group changes (Responders and Non-Responders), and group × time (baseline and follow-up) interaction for those bio-markers that at baseline were significantly different between Responders and Non-Responders. Spearman’s correla-tions were performed to test the association between iden-tified biomarkers of treatment response and percentage of clinical improvement. Boxplots of serum cytokines levels were generated to identify possible outliers for each sepa-rate cytokine; the identified outliers were removed before running statistical analyses. Serum cytokine levels were normalized for the statistical analyses through logarith-mic transformation. Serum cytokines levels are presented as raw values, while the analyses were conducted using the logarithmic-transformed values.
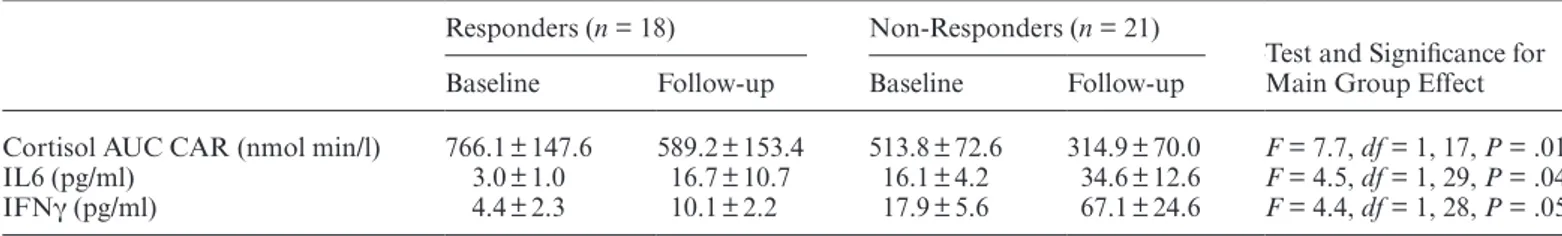
Table 2. Repeated Measures Analyses of Cortisol Awakening Response (CAR), Interleukin-6 (IL-6), and Interferon-γ (IFNγ) at Baseline and 3-mo Follow-up in Responders and Non-Responders
Responders (n = 18) Non-Responders (n = 21)
Test and Significance for Main Group Effect Baseline Follow-up Baseline Follow-up
Cortisol AUC CAR (nmol min/l) 766.1 ± 147.6 589.2 ± 153.4 513.8 ± 72.6 314.9 ± 70.0 F = 7.7, df = 1, 17, P = .01
IL6 (pg/ml) 3.0 ± 1.0 16.7 ± 10.7 16.1 ± 4.2 34.6 ± 12.6 F = 4.5, df = 1, 29, P = .04
IFNγ (pg/ml) 4.4 ± 2.3 10.1 ± 2.2 17.9 ± 5.6 67.1 ± 24.6 F = 4.4, df = 1, 28, P = .05 Note: Of the n = 39 patients assessed at follow-up, n = 24 (n = 12 Responders and n = 12 Non-Responders) repeated the cortisol
assessment and n = 33 (n = 16 Responders and n = 17 Non-Responders) had cytokines measured in the serum. AUC, area under the curve.
Results
Baseline CAR and Inflammatory Biomarkers Predict Treatment Response in First Episode Psychosis
A one-way ANOVA, including Non-Responders (NR), Responders (R), and healthy controls (HC), revealed sig-nificant differences among the 3 groups for cortisol levels during the day (P = .001), CAR (P < .001), IL-4 (P = .04), IL-6 (P < .001), IL-8 (P < .001), IL-10 (P = .04), TNF-α (P < .001), and IFN-γ (P < .001). In contrast, no significant differences were found among the 3 groups for IL-1β and IL-2 (see table 1).
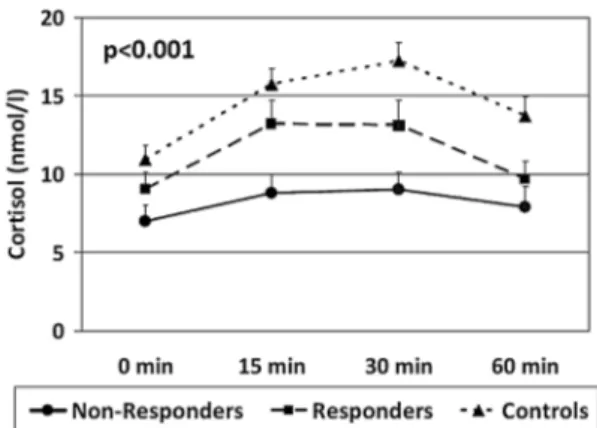
In the post-hoc analyses, only 3 variables differed between Non-Responders and Responders. In particular, Non-Responders showed a significantly lower CAR (d = −0.59, P = .03), and higher IL-6 (d = 1.05, P = .003) and IFN-γ levels (d = 0.88, P = .015) when compared with Responders (see figures 1–3). Of note, both Non-Responders and Non-Responders had significantly lower CAR than healthy controls (respectively, d = −1.28, P < .001 and d = −0.62, P = .009), although the difference was greater in the Non-Responders, and the trend analy-sis revealed a significant linear relationship between CAR and group (P < .001: NR < R < HC, see figure 1). There was no significant difference in awakening time between the Responders and Non-Responders (P = .7).
As per CAR, both Non-Responders and Responders had significantly higher IL-6 levels than healthy controls (respectively, d = 1.24, P < .001; d = 0.75, P = .02), and the difference was again greater in the Non-Responders. The trend analysis revealed again a significant linear rela-tionship between IL-6 and group (P < .001: NR > R > HC, see figure 2). Both Non-Responders and Responders also had higher levels of IFN-γ than healthy controls, although this difference was statistically significant only for the Non-Responders (d = 1.06, P < .001), while it reached a trend level of significance in the Responders group (d = 0.45, P = .09). The trend analysis revealed again a significant linear relationship between IFN-γ and group (P < .001: NR > R > HC, see figure 3).
For cortisol levels during the day, IL-4, IL-8, IL-10, and TNF-α, the post-hoc analyses showed no differences between Responders and Non-Responders; however, IL-4 and IL-10 were significantly higher only in Non-Responders when compared with controls, while they were no significantly different between Responders and controls. Moreover, cortisol levels during the day were lower, while IL-8 and TNF-α were higher, in both patients groups when compared with controls (see table 1).
Longitudinal Changes in Cortisol and Inflammatory Markers
We evaluated changes over 12 weeks in Responders and Non-Responders for the markers that were significantly different at baseline between these 2 groups (ie, CAR,
Fig. 1. Baseline mean ± standard error of the mean of cortisol levels at 0, 15, 30, and 60 min after awakening in Controls, Responders, and Non-Responders. P value indicates the significance of the comparison of the area under the curve of cortisol awakening response at one-way ANOVA.
Fig. 2. Baseline mean ± standard error of the mean interleukin (IL)-6 levels in Controls, Responders, and Non-Responders. P value indicates the significance of the comparison with the one-way ANOVA.
Fig. 3. Baseline mean ± standard error of the mean interferon (IFN)-γ levels in Controls, Responders, and Non-Responders. P value indicates the significance of the comparison with the one-way ANOVA.
IL-6 and IFN-γ), with a repeated measures analysis (see
table 2). We found a significant group effect for the CAR (partial η2 = 0.31, P = .01), IL-6 (partial η2 = 0.14, P =
.04), and IFN-γ levels (partial η2 = 0.14, P = .05),
indi-cating that Non-Responders, compared with Responders, maintained the lower CAR, as well as the higher IL-6 and IFN-γ levels, across the 2 time points. There was no time effect on either CAR (partial η2 = 0.05, P = .4) or
IL-6 (partial η2 = 0.02, P = .4), with no group by time
interaction (P = .9 and P = .7, respectively), indicating no significant changes in CAR and IL-6 levels across the 12 weeks in the 2 groups of patients. In contrast, there was a significant time effect on IFN-γ levels (partial η2 = 0.22,
P = .009), with no group by time interaction (P = .6),
indicating that IFN-γ levels increased with time in both samples of patients.
There Was no Difference Between Responders and Non-Responders in Recent and Early Life Stressors
A one-way ANOVA between Non-Responders, Responders, and healthy controls revealed significant dif-ferences among the 3 groups in number of recent stress-ful life events (P = .007), perceived stress (P < .001), and experience of childhood trauma (P < .001). However, when looking at post-hoc analyses for the 3 stress mea-surements, there were significant differences between the 2 patient groups and controls, but not between Responders and Non-Responders (see table 1).
Exploratory Analysis of the Relationship Between Biomarkers of Treatment Response, and Symptom Severity and Clinical Improvement
Since we found that Non-Responders had more severe negative symptoms at baseline than Responders (see
table 1), we explored the association between biomarkers of treatment response and negative symptoms at baseline. We did not find any significant association between base-line negative symptoms and either CAR (rho = 0.125, P = .4) or IL-6 levels (rho = −0.040, P = .8). However, we found a positive association between negative symptoms and IFN-γ levels (rho = 0.492, P = .004).
When we explored the association between percentage of clinical improvement and biomarkers of treatment response, we found that clinical improvement was sig-nificantly correlated with CAR (rho = 0.500, P = .003) and, at trend level, with IL-6 levels (rho = −0.300, P = .1), suggesting that lower CAR and higher IL-6 levels at baseline are associated with less improvement in clinical symptoms. In contrast we did not find a significant corre-lation between clinical improvement and baseline IFN-γ levels (rho = −0.097, P = .6).
However, in view of the fact that baseline IFN-γ levels were significantly associated with baseline PANSS nega-tive symptoms, we explored whether baseline IFN-γ levels
were also associated with severity of negative symptoms at follow-up. We found a significant positive correlation between baseline IFN-γ levels and severity of PANSS negative symptoms at follow-up (rho = 0.398, P = .03). Discussion
In this longitudinal study in first episode psychosis patients, we show for the first time that patients who subsequently do not respond to 12 weeks of treatment already have, at illness onset, a significant lower CAR and higher levels of IL-6 and IFN-γ, compared with patients who subsequently respond. Furthermore, differ-ences in these biomarkers between Non-Responders and Responders persist over the first 12 weeks of treatment. Finally, comparison with controls demonstrate that these differences between Non-Responders and Responders are not qualitatively different from those present between patients and controls, but rather represent more severe biological abnormalities.
In this sample, we have found that the CAR at psy-chosis onset, but not diurnal cortisol levels, predicts sub-sequent treatment response. This is interesting, since we have found, in a previous sample partially overlapping with this one, that patients with first episode psychosis in general have a blunted CAR, together with high diur-nal cortisol levels.12 However, the blunted CAR tends to
remain unchanged with antipsychotic treatment, while the elevated diurnal cortisol levels tend to be normalized by antipsychotic treatment.12,17 Moreover, more blunted
CAR (but not more elevated cortisol levels during the day) is associated with cognitive dysfunction in these patients.16 Therefore, it is possible that more blunted CAR
is a biological “trait” marker, reflecting a more severe ill-ness that cannot be modified by treatment. Interestingly, a recent study testing the effects of antiglucocorticoid treatment (mifepristone, RU486) on neuropsychologi-cal performance in patients with bipolar depression has shown that treatment with mifepristone is associated with an increase in CAR and with a sustained improvement in spatial working memory performance in these patients.43
Therefore, future studies should investigate the role of antiglucocorticoid treatments in ameliorating psychotic symptoms and improving cognitive function, especially in those patients showing a blunted CAR and thus less likely to respond to antipsychotic treatment. The fact that the CAR remains unchanged after 12 weeks of antipsy-chotic treatment in this study also confirms the notion that this is a trait marker.
Our findings also show that increased levels of inflam-matory markers, in particular IL-6 and IFN-γ, are asso-ciated with poor treatment response in these patients. While increased inflammation in first episode psychosis has been described before,19,44 and previous studies have
shown that higher inflammation (high levels of IL-2 and IL-6) is associated with a poorer clinical outcome in
patients with treatment-resistant and/or chronic schizo-phrenia,23,25,26 our study is the first to show that this link
is already present at the onset of psychosis. Furthermore, as per the CAR, the lack of changes over the 12 weeks for IL-6 indicated that this may also be a more trait-like marker. Of note, recent meta-analyses and reviews have reported mixed findings from studies testing the effects of adjunctive treatment with anti-inflammatory treatment in psychosis, with some agents, such as aspirin, showing some beneficial effects, and other agents, such as cele-coxib and minocycline, showing no or limited effects.45–47
These conflicting findings may partly be explained by dif-ferences in length of treatment and patients’ selection,47
but particularly striking is the fact that none of the stud-ies were stratified for baseline inflammation. As we have shown in this article, some patients have higher inflam-mation than others, and it is possible that only these are the patients who would truly benefit from an anti-inflam-matory treatment. Consistent with this notion, a recent clinical trial with TNF-α antagonist in patients with treatment-resistant depression showed therapeutic effects only in the subsample of patients who had increased baseline inflammatory markers.48 Therefore, increased
baseline inflammatory markers could be used to stratify patients in future trials evaluating the effectiveness of adjuvant anti-inflammatory treatment.
Surprisingly, we found an increase in IFN-γ levels over the 12 weeks in both Responders and Non-Responders, a finding that appears counterintuitive, since a recent meta-analysis report that antipsychotic treatment decreases this particular proinflammatory cytokine in patients.49
However, all of these studies assessed patients after a shorter interval (4–8 weeks), and it is possible that slightly longer treatment with atypical antipsychotics tends to induce production of cytokines through their propensity to generate metabolic syndrome.23
The mechanisms linking the blunted CAR and the increased inflammation with poor treatment response at the onset of psychosis could partly be explained by the well-known effects of cortisol and inflammation on monoaminergic pathways and on neuroplasticity.2,41,50
Notably, it has been recently suggested that the CAR prime the brain for the expected demands of the day,51
and that a blunted CAR predicts less neuroplasticity later in the afternoon, as shown by the response to rapid transcranial magnetic stimulation.52 Therefore, a blunted
CAR in Non-Responders may be linked to a lower syn-aptic plasticity and to a suboptimal brain function, which might ultimately account for the inability of our patients to respond to treatment. As regards inflammation, previ-ous studies have reported increased dopaminergic activity in various brain regions in offspring of rodents exposed to a prenatal inflammatory challenge.53 Furthermore,
inflammatory processes negatively impact adult neu-rogenesis and contribute to wider neurodegenerative processes, through their influence on the kynurenine
pathway and downstream production of the N-methyl-D-aspartate receptor agonist, quinolinic acid.54 The effect
of inflammation on neuroplasticity at the onset of psy-chosis is further supported by our findings in first episode psychosis, showing an association between increased IL-6 levels and lower levels of brain-derived neurotrophic fac-tor, which is a crucial mediator of adult neurogenesis and neuroplasticity.3
Interestingly, although patients had significantly higher levels of stress (ie, stressful life events, perceived stress, and experience of childhood trauma) when com-pared with controls, there were no significant differences between Responders and Non-Responders for any of these stress measures. Therefore, our findings suggest that high levels of stress in psychosis are not associated with poor treatment response per se; rather, they seem associated with the activation and reactivity of biological systems involved in the stress response, measured here as CAR and inflammatory markers, which can contribute to poor response or treatment resistance.
Finally, while CAR and IL-6 were also associated with overall clinical improvement, IFN-γ was more strongly associated with severity of negative symptoms both at baseline and at follow-up. These preliminary results sug-gest the presence of different molecular pathways asso-ciated with treatment response, with some inflammatory markers (in particular IFN-γ) being more associated to specific clinical profiles. However, our sample size was rel-atively small to test this particular hypothesis and, given the strong clinical heterogeneity of psychosis, we cannot exclude that the characteristics of our specific cohort may have contributed to this finding. Further studies would need to investigate this hypothesis in a larger and more powered sample.
Few limitations of the study need to be acknowledged. Firstly, this is a naturalistic study and we could not con-trol the type and duration of antipsychotic treatment, which could have influenced the levels of stress bio-markers. However, there were no significant differences between Responders and Non-Responders in terms of duration and cumulative dose of treatment suggesting that antipsychotic treatment was not responsible for the difference in the stress biomarkers between the 2 groups. Secondly, most of our patients were already on antipsy-chotic treatment for 5–6 weeks when assessed at base-line, and therefore our findings might be more indicative of the very first few days/weeks of antipsychotic treat-ment rather than the time before starting any treattreat-ment. However, these findings could even be more interesting from a translational point of view, as they could aid the decision of clinicians to switch quickly to another and more effective medication in the early stages of antipsy-chotic treatment.
In conclusion, our findings show that blunted CAR and increased levels of proinflammatory cytokines pre-dict poor treatment response at the onset of psychosis.
These biomarkers hold strong potential as predictors of clinical outcome at the onset of psychosis as well as optimal targets for the development of novel therapeutic agents.
Funding
This research has been supported by the National Institute for Health Research (NIHR) Mental Health Biomedical Research Centre at South London and Maudsley NHS Foundation Trust and King’s College London. This research has also been supported by a Starter Grant for Clinical Lecturers from the Academy of Medical Sciences to V.M.; and a grant from the Wellcome Trust (WT087417) to C.M.
Acknowledgments
The views expressed are those of the authors and not necessarily those of the NHS, the NIHR or the Department of Health. We would like to thank Tracy Dew (King’s College Hospital, UK) for conducting the biochemistry assays. The authors have declared that there are no conflicts of interest in relation to the sub-ject of this study.
References
1. Emsley R, Rabinowitz J, Medori R. Remission in early psy-chosis: rates, predictors, and clinical and functional outcome correlates. Schizophr Res. 2007;89:129–139.
2. Walker E, Mittal V, Tessner K. Stress and the hypothalamic pituitary adrenal axis in the developmental course of schizo-phrenia. Annu Rev Clin Psychol. 2008;4:189–216.
3. Mondelli V, Cattaneo A, Belvederi Murri M, et al. Stress and inflammation reduce brain-derived neurotrophic factor expression in first-episode psychosis: a pathway to smaller hippocampal volume. J Clin Psychiatry. 2011;72:1677–1684. 4. Corcoran C, Walker E, Huot R, et al. The stress cascade
and schizophrenia: etiology and onset. Schizophr Bull. 2003;29:671–692.
5. Cattaneo A, Gennarelli M, Uher R, et al. Candidate genes expression profile associated with antidepressants response in the GENDEP study: differentiating between baseline ‘predic-tors’ and longitudinal ‘targets’. Neuropsychopharmacology. 2013;38:377–385.
6. Carvalho LA, Torre JP, Papadopoulos AS, et al. Lack of clin-ical therapeutic benefit of antidepressants is associated over-all activation of the inflammatory system. J Affect Disord. 2013;148:136–140.
7. Palaniyappan L, Marques TR, Taylor H, et al. Cortical fold-ing defects as markers of poor treatment response in first-episode psychosis. JAMA Psychiatry. 2013;70:1031–1040. 8. Reis Marques T, Taylor H, Chaddock C, et al. White matter
integrity as a predictor of response to treatment in first epi-sode psychosis. Brain. 2014;137:172–182.
9. Borges S, Gayer-Anderson C, Mondelli V. A systematic review of the activity of the hypothalamic-pituitary-adrenal
axis in first episode psychosis. Psychoneuroendocrinology. 2013;38:603–611.
10. Belvederi Murri M, Pariante CM, Dazzan P, et al. Hypothalamic-pituitary-adrenal axis and clinical symp-toms in first-episode psychosis. Psychoneuroendocrinology. 2012;37:629–644.
11. Aiello G, Horowitz M, Hepgul N, Pariante CM, Mondelli V. Stress abnormalities in individuals at risk for psychosis: a review of studies in subjects with familial risk or with “at risk” mental state. Psychoneuroendocrinology. 2012;37:1600–1613. 12. Mondelli V, Dazzan P, Hepgul N, et al. Abnormal cortisol
levels during the day and cortisol awakening response in first-episode psychosis: the role of stress and of antipsychotic treatment. Schizophr Res. 2010;116:234–242.
13. van Venrooij JA, Fluitman SB, Lijmer JG, et al. Impaired neuroendocrine and immune response to acute stress in medication-naive patients with a first episode of psychosis.
Schizophr Bull. 2012;38:272–279.
14. Ciufolini S, Dazzan P, Kempton MJ, Pariante C, Mondelli V. HPA axis response to social stress is attenuated in schizophre-nia but normal in depression: evidence from a meta-analysis of existing studies. Neurosci Biobehav Rev. 2014;47:359–368. 15. Breier A, Wolkowitz OM, Doran AR, Bellar S, Pickar D.
Neurobiological effects of lumbar puncture stress in psy-chiatric patients and healthy volunteers. Psychiatry Res. 1988;25:187–194.
16. Aas M, Dazzan P, Mondelli V, et al. Abnormal cortisol awak-ening response predicts worse cognitive function in patients with first-episode psychosis. Psychol Med. 2011;41:463–476. 17. Bradley AJ, Dinan TG. A systematic review of
hypothalamic-pituitary-adrenal axis function in schizophrenia: implications for mortality. J Psychopharmacol. 2010;24:91–118.
18. Di Nicola M, Cattaneo A, Hepgul N, et al. Serum and gene expression profile of cytokines in first-episode psychosis.
Brain Behav Immun. 2013;31:90–95.
19. Zajkowska Z, Mondelli V. First-episode psychosis: an inflam-matory state? Neuroimmunomodulation. 2014;21:102–108. 20. Meyer U. Prenatal poly(i:C) exposure and other
develop-mental immune activation models in rodent systems. Biol
Psychiatry. 2014;75:307–315.
21. Miller BJ, Buckley P, Seabolt W, Mellor A, Kirkpatrick B. Meta-analysis of cytokine alterations in schizophrenia: clinical status and antipsychotic effects. Biol Psychiatry. 2011;70:663–671. 22. Tandon R, Mazzara C, DeQuardo J, et al. Dexamethasone
suppression test in schizophrenia: relationship to symp-tomatology, ventricular enlargement, and outcome. Biol
Psychiatry. 1991;29:953–964.
23. Zhang XY, Zhou DF, Cao LY, Wu GY, Shen YC. Cortisol and cytokines in chronic and treatment-resistant patients with schizophrenia: association with psychopathology and response to antipsychotics. Neuropsychopharmacology. 2005;30:1532–1538.
24. Garner B, Phassouliotis C, Phillips LJ, et al. Cortisol and dehydroepiandrosterone-sulphate levels correlate with symp-tom severity in first-episode psychosis. J Psychiatr Res. 2011;45:249–255.
25. McAllister CG, van Kammen DP, Rehn TJ, et al. Increases in CSF levels of interleukin-2 in schizophrenia: effects of recur-rence of psychosis and medication status. Am J Psychiatry. 1995;152:1291–1297.
26. Lin A, Kenis G, Bignotti S, et al. The inflammatory response system in treatment-resistant schizophrenia: increased serum interleukin-6. Schizophr Res. 1998;32:9–15.
27. Heim C, Newport DJ, Mletzko T, Miller AH, Nemeroff CB. The link between childhood trauma and depression: insights from HPA axis studies in humans. Psychoneuroendocrinology. 2008;33:693–710.
28. Danese A, Pariante CM, Caspi A, Taylor A, Poulton R. Childhood maltreatment predicts adult inflamma-tion in a life-course study. Proc Natl Acad Sci USA. 2007;104:1319–1324.
29. Douglas KM, Porter RJ. The effect of childhood trauma on pharmacological treatment response in depressed inpatients.
Psychiatry Res. 2012;200:1058–1061.
30. Di Forti M, Morgan C, Dazzan P, et al. High-potency cannabis and the risk of psychosis. Br J Psychiatry. 2009;195:488–491.
31. Di Forti M, Sallis H, Allegri F, et al. Daily use, especially of high-potency cannabis, drives the earlier onset of psychosis in cannabis users. Schizophr Bull. 2014;40:1509–1517.
32. Bebbington P, Nayani T. The Psychosis Screening Questionnaire. Int J Method Psych. April 1995;5:11–19. 33. McGuffin P, Farmer A, Harvey I. A polydiagnostic
appli-cation of operational criteria in studies of psychotic illness. Development and reliability of the OPCRIT system. Arch
Gen Psychiatry. 1991;48:764–770.
34. Kay SR, Fiszbein A, Opler LA. The positive and negative syndrome scale (PANSS) for schizophrenia. Schizophr Bull. 1987;13:261–276.
35. Jablensky A, Sartorius N, Ernberg G, et al. Schizophrenia: manifestations, incidence and course in different cultures. A World Health Organization ten-country study. Psychol
Med Monogr Suppl. 1992;20:1–97.
36. Andreasen NC, Carpenter WT Jr, Kane JM, Lasser RA, Marder SR, Weinberger DR. Remission in schizophre-nia: proposed criteria and rationale for consensus. Am J
Psychiatry. 2005;162:441–449.
37. Leucht S, Davis JM, Engel RR, Kane JM, Wagenpfeil S. Defining ‘response’ in antipsychotic drug trials: rec-ommendations for the use of scale-derived cutoffs.
Neuropsychopharmacology. 2007;32:1903–1910.
38. Brugha TS, Cragg D. The list of threatening experiences: the reliability and validity of a brief life events questionnaire.
Acta Psychiatr Scand. 1990;82:77–81.
39. Cohen S, Williamson, G. Perceived Stress in a Probability
Sample of the United States. Newbury Park, CA: Sage; 1988.
40. Bifulco A, Bernazzani O, Moran PM, Jacobs C. The child-hood experience of care and abuse questionnaire (CECA.Q): validation in a community series. Br J Clin Psychol. 2005;44:563–581.
41. Mondelli V, Pariante CM, Navari S, et al. Higher cortisol lev-els are associated with smaller left hippocampal volume in first-episode psychosis. Schizophr Res. 2010;119:75–78.
42. Pruessner JC, Kirschbaum C, Meinlschmid G, Hellhammer DH. Two formulas for computation of the area under the curve represent measures of total hormone concentration versus time-dependent change. Psychoneuroendocrinology. 2003;28:916–931.
43. Watson S, Gallagher P, Porter RJ, et al. A randomized trial to examine the effect of mifepristone on neuropsychological performance and mood in patients with bipolar depression.
Biol Psychiatry. 2012;72:943–949.
44. Baumeister D, Russell A, Pariante CM, Mondelli V. Inflammatory biomarker profiles of mental disorders and their relation to clinical, social and lifestyle factors. Soc
Psychiatry Psychiatr Epidemiol. 2014;49:841–849.
45. Nitta M, Kishimoto T, Müller N, et al. Adjunctive use of nonsteroidal anti-inflammatory drugs for schizophrenia: a meta-analytic investigation of randomized controlled trials.
Schizophr Bull. 2013;39:1230–1241.
46. Sommer IE, de Witte L, Begemann M, Kahn RS. Nonsteroidal anti-inflammatory drugs in schizophrenia: ready for prac-tice or a good start? A meta-analysis. J Clin Psychiatry. 2012;73:414–419.
47. Sommer IE, van Westrhenen R, Begemann MJ, de Witte LD, Leucht S, Kahn RS. Efficacy of anti-inflammatory agents to improve symptoms in patients with schizophrenia: an update.
Schizophr Bull. 2014;40:181–191.
48. Raison CL, Rutherford RE, Woolwine BJ, et al. A rand-omized controlled trial of the tumor necrosis factor antago-nist infliximab for treatment-resistant depression: the role of baseline inflammatory biomarkers. JAMA Psychiatry. 2013;70:31–41.
49. Tourjman V, Kouassi É, Koué MÈ, et al. Antipsychotics’ effects on blood levels of cytokines in schizophrenia: a meta-analysis. Schizophr Res. 2013;151:43–47.
50. Haroon E, Raison CL, Miller AH. Psychoneuroimmunology meets neuropsychopharmacology: translational impli-cations of the impact of inflammation on behavior.
Neuropsychopharmacology. 2012;37:137–162.
51. Fries E, Dettenborn L, Kirschbaum C. The cortisol awak-ening response (CAR): facts and future directions. Int J
Psychophysiol. 2009;72:67–73.
52. Clow A, Law R, Evans P, et al. Day differences in the cortisol awakening response predict day differences in synaptic plas-ticity in the brain. Stress. 2014;17:219–223.
53. Aguilar-Valles A, Jung S, Poole S, Flores C, Luheshi GN. Leptin and interleukin-6 alter the function of mesolimbic dopamine neurons in a rodent model of prenatal inflamma-tion. Psychoneuroendocrinology. 2012;37:956–969.
54. Zunszain PA, Anacker C, Cattaneo A, et al. Interleukin-1β: a new regulator of the kynurenine pathway affecting human hippocampal neurogenesis. Neuropsychopharmacology. 2012;37:939–949.