Volume 2013, Article ID 407602,8pages http://dx.doi.org/10.1155/2013/407602
Research Article
Cognitive Vulnerabilities and Depression in Young Adults:
An ROC Curves Analysis
Michela Balsamo,
1Claudio Imperatori,
2Maria Rita Sergi,
1Martino Belvederi Murri,
3Massimo Continisio,
2,4Antonino Tamburello,
2,4Marco Innamorati,
1,2,4and Aristide Saggino
11DISPUTer, Dipartimento di Scienze Psicologiche, Umanistiche e del Territorio, “G. d’Annunzio” University, 66100 Chieti, Italy 2Universit`a Europea di Roma, 00163 Rome, Italy
3Division of Psychiatry, Department of Neurosciences, University of Parma, 43100 Parma, Italy 4Istituto Skinner, 00184 Rome, Italy
Correspondence should be addressed to Michela Balsamo; [email protected] Received 27 April 2013; Accepted 21 July 2013
Academic Editor: H. Grunze
Copyright © 2013 Michela Balsamo et al. This is an open access article distributed under the Creative Commons Attribution License, which permits unrestricted use, distribution, and reproduction in any medium, provided the original work is properly cited.
Objectives and Methods. The aim of the present study was to evaluate, by means of receiver operating characteristic (ROC) curves, whether cognitive vulnerabilities (CV), as measured by three well-known instruments (the Beck Hopelessness Scale, BHS; the Life Orientation Test-Revised, LOT-R; and the Attitudes Toward Self-Revised, ATS-R), independently discriminate between subjects with different severities of depression. Participants were 467 young adults (336 females and 131 males), recruited from the general population. The subjects were also administered the Beck Depression Inventory-II (BDI-II). Results. Four first-order (BHS Optimism/Low Standard; BHS Pessimism; Generalized Self-Criticism; and LOT Optimism) and two higher-order factors (Pessimism/Negative Attitudes Toward Self, Optimism) were extracted using Principal Axis Factoring analysis. Although all first-order and second-first-order factors were able to discriminate individuals with different depression severities, the Pessimism factor had the best performance in discriminating individuals with moderate to severe depression from those with lower depression severity. Conclusion. In the screening of young adults at risk of depression, clinicians have to pay particular attention to the expression of pessimism about the future.
1. Introduction
Major depressive disorder (MDD) is one of the most
wide-spread psychiatric disorder [1–4] and the leading cause of
disability as measured by years lived with disability (YLDs)
[5–9]. Currently, MDD is estimated to be the fourth leading
cause of global disease burden [10,11], and, by the year 2020,
it is projected to reach the second place in the ranking of the major causes of Disability Adjusted Life Years (DALYs). Today, depression is already the second cause of DALYs in
the age category 15–44 years [11]. The estimated 12-month
prevalence of MDD was 6.6% in the USA [12] and 3.0% in
Italy [13].
Many approaches have been taken in attempts to explain
the origins of depression [14]. Whereas some of these
theories involved genetics and biological functioning, other approaches focused on the study of personal characteristics of individuals who are believed to be vulnerable to experiencing depressive episodes. A large body of research examining cognitive models of vulnerability for depression hypothesized that the way the individual interprets his/her experiences represents a protective or risk factor for the development of depressive disorders when negative stressful life events occur
[15]. Depressed people engage in prolonged and repetitive
thinking about the self, the world, and the future in a negative
way with detrimental effects on mood [16–18]. Cognitive
vulnerability (CV) for depression may be defined as a trait-like tendency to interpret information in a negative and distorted way when facing a subjectively perceived stressful
role in the development and maintenance of depressive disorders not only in adulthood but also in childhood and
adolescence (for a review see [20]).
Despite similarities, currently there are several different theories which hypothesize the cognitive processes to be a diathesis for the development of depressive disorders. Two of the most renowned theories are the hopelessness theory
[21] and Beck’s theory [22,23]. According to the hopelessness
theory, three kinds of maladaptive inferences that people may make when confronted with negative events contribute to the development of hopelessness and, in turn, depressive symptoms: causal attributions, inferred consequences, and inferred characteristics about the self. Hopelessness and depressive symptoms are likely to occur when negative life events are (1) attributed to stable (i.e., likely to persist over time) and global (i.e., likely to affect many areas of life) causes; (2) viewed as likely to lead to further negative consequences; and (3) construed as implying that the person is unworthy
or deficient. Similarly, Beck [22, 23] and Beck et al. [24]
hypothesized depressogenic self-schemata, activated by the occurrence of negative life events, that take the form of overly pessimistic views of the self, the world, and the future
(the negative cognitive triad). Also, Carver and Ganellen [25]
considered self-punitiveness as a salient feature of depression, associated with the holding of overly high standards, the tendency to be too critical with the self for failing to attain a standard, and the tendency to generalize from a single failure to the broader sense of self-worth. To measure these three potential self-regulatory vulnerabilities to depression, Carver and colleagues developed the Attitudes Toward Self (ATS).
Several researches have provided support for the critical role of CV in the origin and course of depressive disorders
[26–30]. For example, Beckham et al. [26] reported that all the
cognitive triad components are significantly associated with the severity of depressive symptoms in depressed patients.
Evans et al. [28] indicated that holding a negative self-schema
is an independent risk factor for the onset of depression in women. Furthermore, pessimistic views about the future have been found to be highly predictive of suicide behaviors
[31, 32] and worse health and social functioning [33] in
psychiatric patients. Again, in a longitudinal study, it was reported that undergraduate students with a more general-ized negative cognitive style were 3.5–6.8 times more likely to report more depressive episodes compared to students with
a less generalized negative cognitive style [29]. Some studies
also indicated a partial overlap between the hopelessness and
Beck’s theories [34,35].
Our literature review suggests that investigating the role of CV in the development of depression may be beneficial for a better understanding and treatment of depressive disorders. What is more is that research has failed to investigate the role of CV for depression in discriminating different levels of severity of depression. Thus, the aim of the present study was to evaluate, by means of ROC curves, whether some dimensions of CV for depression, as measured by three well-known instruments, that are the Beck Hopelessness
Scale (BHS) [24], the Life Orientation Test-Revised (LOT-R)
[36], and the Attitudes Toward Self-Revised (ATS-R) [37],
discriminate independently between subjects with different severities of depression.
2. Materials and Methods
2.1. Participants. Participants were 467 young adults (131
males, 28.1%; 336 females, 71.9%). Mean age of the sample
was23.58 ± 5.03 years (range 18–39). Subjects were included
if they had an age between 18 and 40 years old. Exclusion criteria were the presence of any condition affecting the ability to complete the assessment, including illiteracy and denial of informed consent.
All participants were nonrandomly recruited in Central Italy between February 2012 and June 2012. They accepted to participate voluntarily and gave their informed consent.
2.2. Measures. The Beck Depression Inventory-II (BDI-II)
[38], the BHS, the LOT-R, and the ATS-R were administered
to all subjects.
The BDI-II is a well-known self-report inventory com-posed of 21 items designed to assess the presence and
severity of depressive symptoms, according to DSM-IV [39]
criteria. Respondents endorse specific statements reflecting their feelings over the last two weeks, including today. Each statement is rated on a 4-point Likert-type scale ranging from 0 to 3, based on the severity of depressive symptoms. Impor-tantly, extensive literature has supported the psychometric properties of the scale in clinical and nonclinical samples
[40,41]. In the current sample, Cronbach alpha was 0.86.
The BHS [24] is a 20-item scale for measuring the
cognitive component of the depression. The scale assesses three major aspects of hopelessness: feelings about the future, loss of motivation, and expectations. Responding to the 20 true or false items, individuals have to either endorse a pes-simistic statement or deny an optimistic statement. Research consistently have supported a positive relationship between BHS scores and measures of depression, suicidal intent, and
current suicidal ideation [31, 42–44]. The Italian version of
the BHS has reported good psychometric properties [45,46].
The LOT-R is a 6-item scale measuring optimism: three items are positively worded (e.g., “I’m always optimistic about
my future”), and the other three items are negatively worded
(e.g., “If something can go wrong for me, it will”). Each item is rated on a five-point Likert-type scale (from 1—“I agree a lot”—to 5—“I disagree a lot”). Sum scores range between 6 and 30 with higher scores indicating higher optimism.
The ATS-R is a self-report measure designed to measure three potential self-regulatory vulnerabilities to depression. One of them is the holding of overly high standards, the second is the tendency to be self-critical at any failure to perform well, and the third is the tendency to generalize from a single failure to the broader sense of self-worth. The negative generalization scale has been found to be the
dimension more strongly associated with depression [37,
47, 48]. Items are rated on a Likert-type scale, ranging
from 1 (“I agree a lot”) to 5 (“I disagree a lot”). A study assessing the psychometric properties of the Italian version of the ATS-R has been recently published, indicating that
Table 1: Characteristics of the sample. % Men 28.2 Age—M± SD 23.59 ± 5.03 Job Employed 32.9 Students 63.7 Unemployed 3.4 Marital status Not married 87.8 Married 10.8 Divorced 1.4 Education 5 years 0.6 8 years 12.3 13 years 72.0 16+ years 15.1 BDI-II—M± SD 10.40 ± 8.36 BDI≥ 20 12.5
the measure is a valid instrument for the study of the role of cognitive tendencies as potential diathesis in the development
of depression [49].
2.3. Statistical Analysis. The BHS, LOT-R, and ATS-R items
were subjected to Principal Axis Factoring in order to obtain common factors of vulnerability for depression. The number of latent factors to retain was selected using the scree test
[50] and confirmed by means of Velicer’s Minimum Average
Partial (MAP) test [51]. Promax rotation with Kaiser
Nor-malization was used in order to produce correlated factors.
According to Kline [52], items were retained if they had a
factor loading of 0.40 and higher and if they were loaded on a single factor. Then, factor scores for all subjects were calculated and used to assess the presence of possible higher-order factors.
A generalized linear model with robust estimator was used to assess independent associations between depression severity and factors of vulnerability for depression. Associa-tions were reported as odds ratio and their 95% confidence intervals (95% CI).
In order to assess the performance of the dimensions of vulnerability for depression in categorizing individuals on the basis of depression severity, a series of ROC test procedures
were performed [53].
All analyses were performed with the Statistical Package for the Social Sciences (SPSS 17.0 for Windows).
3. Results
Descriptive statistics are listed inTable 1. The mean BDI-II
score was10.40 ± 8.36 (quartiles [25∘/50∘/75∘]: 4/9/15), and
12.5% of the sample had scores of 20 and higher indicating moderate to severe depressive symptoms, consistent with the nonclinical nature of the sample.
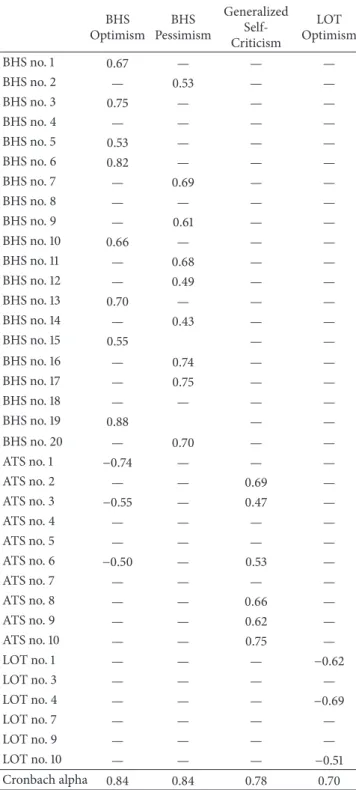
Table 2: Factor solution (Principal Factor Analysis, Promax rotation with Kaiser Normalization).
Factor BHS Optimism BHS Pessimism Generalized Self-Criticism LOT Optimism BHS no. 1 0.67 — — — BHS no. 2 — 0.53 — — BHS no. 3 0.75 — — — BHS no. 4 — — — — BHS no. 5 0.53 — — — BHS no. 6 0.82 — — — BHS no. 7 — 0.69 — — BHS no. 8 — — — — BHS no. 9 — 0.61 — — BHS no. 10 0.66 — — — BHS no. 11 — 0.68 — — BHS no. 12 — 0.49 — — BHS no. 13 0.70 — — — BHS no. 14 — 0.43 — — BHS no. 15 0.55 — — BHS no. 16 — 0.74 — — BHS no. 17 — 0.75 — — BHS no. 18 — — — — BHS no. 19 0.88 — — BHS no. 20 — 0.70 — — ATS no. 1 −0.74 — — — ATS no. 2 — — 0.69 — ATS no. 3 −0.55 — 0.47 — ATS no. 4 — — — — ATS no. 5 — — — — ATS no. 6 −0.50 — 0.53 — ATS no. 7 — — — — ATS no. 8 — — 0.66 — ATS no. 9 — — 0.62 — ATS no. 10 — — 0.75 — LOT no. 1 — — — −0.62 LOT no. 3 — — — — LOT no. 4 — — — −0.69 LOT no. 7 — — — — LOT no. 9 — — — — LOT no. 10 — — — −0.51 Cronbach alpha 0.84 0.84 0.78 0.70 Extraction method: Principal Axis Factoring. Rotation method: Promax with Kaiser Normalization.
The scree test and Velicer’s MAP test indicated a factorial solution with four factors, explaining 47% of the variability
of the data (Table 2). Nine items were loaded on the first
factor (BHS Optimism), which explained 19.2% of the vari-ance (eigenvalue = 6.92), with loadings ranging from 0.53
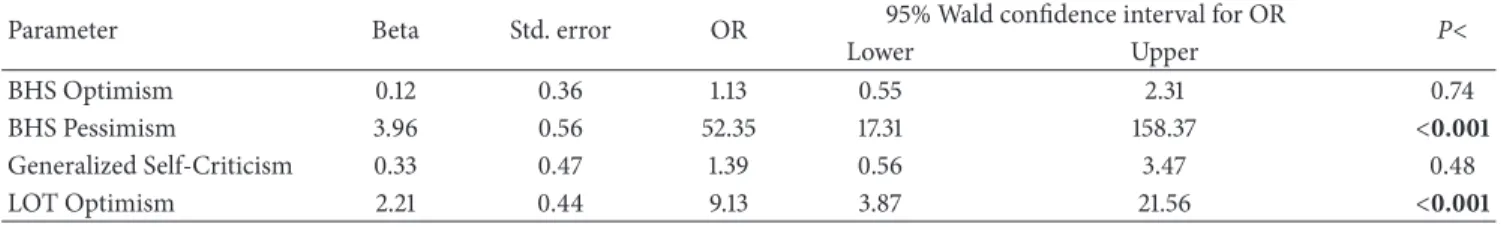
Table 3: Generalized linear model (criterion: BDI-II).
Parameter Beta Std. error OR 95% Wald confidence interval for OR P<
Lower Upper
BHS Optimism 0.12 0.36 1.13 0.55 2.31 0.74
BHS Pessimism 3.96 0.56 52.35 17.31 158.37 <0.001
Generalized Self-Criticism 0.33 0.47 1.39 0.56 3.47 0.48
LOT Optimism 2.21 0.44 9.13 3.87 21.56 <0.001
Likelihood Ratio𝜒24= 200.03; 𝑃 < 0.001; AIC = 3013.74; AICC = 3013.93; Pearson 𝜒2448= 20017.73; value/DF = 44.68.
[BHS item no. 5] to 0.88 [BHS item no. 19]: 8 items from the BHS endorsing an optimistic statement and 1 item from the ATS-R denying higher standard for the self. On the second factor (BHS Pessimism), which explained 15.7% of the total variance (eigenvalue = 5.65), 9 items presented loadings ranging from 0.43 [BHS item no. 14] to 0.75 [BHS item no. 17]: all items were from the BHS and endorsed a pessimistic statement. On the third factor (Generalized Self-Criticism), which explained 7.3% of the variance (eigenvalue = 2.61), 4 items had loadings ranging from 0.62 [ATS-R item no. 9] to 0.75 [ATS-R item no. 10]: all items were extracted from the original Generalization and Self-Criticism factors of the ATS-R. On the fourth factor (LOT-R Optimism), which explained 4.8% of the variance (eigenvalue = 1.74), 3 items had loadings
ranging from−0.51 [LOT-R item no. 10] to −0.69 [LOT-R item
no. 4]: the items were from the LOT-R, and the individual had to endorse an optimistic statement. ATS-R items no. 3 and no. 6 loaded on two factors (factors no. 1 and no. 3) and were excluded from the solution. All factors were rated so that higher scores measured the presence of pessimism or negative attitudes toward the self or denied the presence of
optimism. Correlation between factors ranged between−0.18,
for the association between BHS Optimism and Generalized Self-Criticism, and 0.45, for the association between BHS Optimism and LOT-R Optimism.
Factor scores were entered in a second-order factor analysis to extract higher-order common factors. The analysis
resulted in two factors with eigenvalues>1. On the first factor
(Optimism), which explained 43.3% of the variance (eigen-value = 1.73), first-order factors LOT-R Optimism (0.80) and BHS Optimism (0.72) loaded. On the second factor (Pessimism/Negative attitudes toward self), which explained 34.0% of the variance (eigenvalue = 1.36), first-order factors BHS Pessimism (0.62) and Generalized Self-Criticism (0.69) loaded. The factors were weakly correlated with each other (𝑟 = 0.20).
A generalized linear model with robust estimator was performed to assess whether the factors measuring CV for depression were independently associated with the BDI-II (Table 3). The model fitted the data well (Likelihood Ratio
𝜒42 = 200.03; 𝑃 < 0.001). The four factors were inserted
as independent variables in the analysis and the BDI-II as criterion. Only the BHS Pessimism and the LOT-R Optimism were independently associated with BDI-II scores, indicating that (1) subjects with higher scores on the BHS Pessimism were 52.4 times more likely to have higher BDI-II scores (95%
CI: 17.3/158.4; 𝑃 < 0.001) compared with those reported
having lower scores and (2) people with higher scores on the LOT-R Optimism were 9.1 times more likely to have
higher BDI-II scores (95% CI: 3.9/21.6;𝑃 < 0.001) compared
with people having higher scores. A second generalized linear model was performed with higher order factors as independent variables (not reported in the tables). The model
fitted the data well (Likelihood Ratio𝜒22= 170.31; 𝑃 < 0.001).
Both the higher-order factors were independently associated with the BDI-II: (1) subjects with higher scores on Optimism were 10.1 times more likely to have higher BDI-II scores (95%
CI: 4.7/21.5; beta = 2.31 [std. error = 0.39];𝑃 < 0.001)
com-pared with those having lower scores; and (2) people with higher scores on Pessimism/Negative Attitudes Toward Self were 91.1 times more likely to have higher BDI-II scores (95%
CI: 32.7/254.3; beta = 4.51 [std. error = 0.52];𝑃 < 0.001) than
people reported having lower scores.
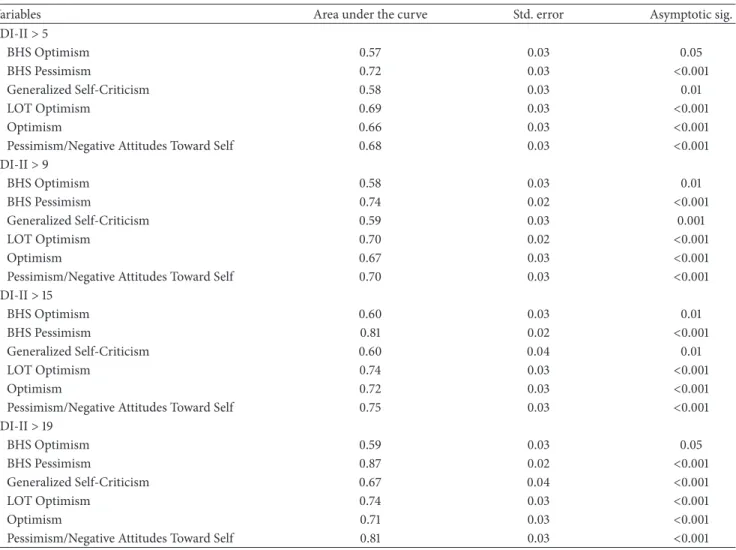
A series of ROC curves indicated that first-order and second-order factors of vulnerability for depression were able to discriminate individuals with different depression
severities (Table 4). The performance of the BHS Optimism
was quite stable at any level of depression. A randomly chosen individual had 57%–60% of probability to have higher scores on the BHS Optimism compared with a randomly chosen individual with lower levels of depression. Generalized Self-Criticism performance was the best when discriminating individuals with moderate to severe depression from other individuals: at these levels of depression, a randomly chosen
individual with moderate to severe depression (BDI-II≥ 20)
had 67% of probability to have higher scores on Generalized Self-Criticism than a randomly chosen individual with lower levels of depression. The performance of the BHS Pessimism increased linearly from lower levels (BDI-II cutoffs of 5 and 9: AUC [area under the curve] = 0.72–0.74) to higher levels of depression (AUC of 0.81 and 0.87, resp., for BDI-II cutoffs of 15 and 19). The performance of the LOT-R Optimism was similar for lower cutoffs (AUC of 0.69 and 0.70, resp., for BDI-II cutoffs of 5 and 9) and higher cutoffs (AUC of 0.74 for BDI-II cutoffs of 15 and 19). When analyzing the performance of the second-order factors, a randomly chosen individual had 66%–72% of probability to have higher scores on Optimism than a randomly chosen individual with lower levels of depression, while a randomly chosen indi-vidual had 68%–81% of probability to have higher scores on Pessimism/Negative Attitudes Toward Self than a randomly chosen individual with lower levels of depression. Thus, the presence of Pessimism and Negative Attitudes Toward Self was more useful in discriminating individuals with
Table 4: ROC curves.
Variables Area under the curve Std. error Asymptotic sig.
BDI-II> 5 BHS Optimism 0.57 0.03 0.05 BHS Pessimism 0.72 0.03 <0.001 Generalized Self-Criticism 0.58 0.03 0.01 LOT Optimism 0.69 0.03 <0.001 Optimism 0.66 0.03 <0.001
Pessimism/Negative Attitudes Toward Self 0.68 0.03 <0.001
BDI-II> 9 BHS Optimism 0.58 0.03 0.01 BHS Pessimism 0.74 0.02 <0.001 Generalized Self-Criticism 0.59 0.03 0.001 LOT Optimism 0.70 0.02 <0.001 Optimism 0.67 0.03 <0.001
Pessimism/Negative Attitudes Toward Self 0.70 0.03 <0.001
BDI-II> 15 BHS Optimism 0.60 0.03 0.01 BHS Pessimism 0.81 0.02 <0.001 Generalized Self-Criticism 0.60 0.04 0.01 LOT Optimism 0.74 0.03 <0.001 Optimism 0.72 0.03 <0.001
Pessimism/Negative Attitudes Toward Self 0.75 0.03 <0.001
BDI-II> 19 BHS Optimism 0.59 0.03 0.05 BHS Pessimism 0.87 0.02 <0.001 Generalized Self-Criticism 0.67 0.04 <0.001 LOT Optimism 0.74 0.03 <0.001 Optimism 0.71 0.03 <0.001
Pessimism/Negative Attitudes Toward Self 0.81 0.03 <0.001
moderate to severe depression than denying an optimistic one. However, the BHS Pessimism appeared to have the best performance in discriminating individuals at any level of depression severity.
4. Discussion
The aim of the present study was to evaluate, by means of ROC curves, whether CV for depression, as mea-sured by three well-known instruments, may independently discriminate between subjects with different depression severities.
Our results indicated that the instruments we adminis-tered measure four common vulnerabilities for depression: (1) denying optimism/endorsing high standards (BHS/ATS-R); (2) endorsing pessimism (BHS); (3) generalizing self-criticism (ATS-R); and (4) denying optimism (LOT-R). These dimensions are loaded on two second-order factors: (1) deny-ing optimism and (2) endorsdeny-ing pessimism and generalizdeny-ing self-criticism.
In our sample of young adults, the assessment of pes-simism with the BHS, compared with other factors, had the best performance in discriminating individuals with
different levels of depression severity, and its performance improved from lower cutoffs to higher cutoffs of depression. A randomly chosen individual with moderate to severe depression had 87% of probability to have higher BHS Pessimism compared with a randomly chosen individual with lower levels of depression.
Pessimism was also independently associated with dep-ression severity while controlling for other dimensions of vulnerability for depression. People having more severe pessimism were above 52 times more at risk to have higher depression compared with people with milder pessimism. This finding is consistent with the studies indicating a strong link between negative beliefs about the future and depression
[54–58]. For example, Strunk et al. [56], investigating the
relationship between depressive symptoms and bias in future event prediction, documented that individuals with elevated depressive symptoms showed a pessimistic bias in making predictions about the outcomes of future life events by overpredicting that undesirable events would happen to them and underpredicting that desirable events would happen to
them. Alford et al. [59], in a sample of university students,
found that in males hopelessness may predict specifically future depression severity but not anxiety.
From a psychometric point of view, our results may be related to the differences in the methods employed in the three scales we administered to measure CV for depression: (1) the BHS uses dichotomous format of response, while for the LOT-R and the ATS-R the respondents are asked to rate each item on a Likert-type scale; (2) both the BHS and LOT-R ask the individuals to rate positive items which are directly associated with the construct they measure and negative statements which are negatively associated with these constructs. Furthermore, while the BHS is considered a measure of pessimism, the LOT-R is generally considered a
measure of optimism [60].
Scheier and Carver [60], investigating construct validity
of the LOT-R, reported the fit of a two-factor model: one factor contained positively worded items and the other included negatively worded items. The authors considered that the two-factor solution was probably due to item wording
rather than content item [60]. Indeed, responses, particularly
to the positively and negatively worded items, reflected a complicated combination of substantively meaningful trait effects and apparently idiosyncratic method effects associated
with the wording of particular items [61–63].
Nevertheless, in the last decades several authors reported results supporting the hypothesis that Optimism and Pes-simism are two distinct constructs with different patterns
of correlations with other psychological constructs [64–70].
Recently, similar results have been found for the BHS: in a sample of medical patients, a bifactor model was the best-fitting solution and the most parsimonious among models
evaluated [71]. Results from the higher-order factor analysis
we performed support the hypothesis that the two factors often extracted from factorizing LOT-R and BHS items are not an artifact due to item wording and may have different roles as factors of vulnerability for depression.
Finally, our study has some limitations. First, above 60% of our sample were composed of university students and may not be representative of the Italian population, so that gen-eralizability of the results to older people and to individuals with low school attainment is not suggested. Second, our sample is nonclinical and only 12.5% of the subjects reported having moderate to severe depression at the BDI-II, so that our results may not be replicable in clinical samples, even though cognitive theories of depression did not predict dif-ferences in the associations of cognitive variables with
depres-sive symptoms between clinical and nonclinical samples [21,
72,73]. Third, the measures used in the present study were
limited to only paper-and-pencil self-report instruments and we did not administered clinician-rated scales to measure
depression, as recommended elsewhere [74]. Thus, our results
may be biased by social desirability [75,76]. Fourth, we did
not assess participants for family history of mood disorders, which may have predisposed individuals to develop future depression and negative cognitive biases. Nevertheless, there are several noteworthy strengths, including the large size of sample and the use of three different measures often used to assess cognitive vulnerability for depression.
In conclusion, when screening young adults at risk for depression, clinicians have to pay particular attention
to expressions of pessimism about the future, which may discriminate well individuals with moderate to severe depres-sion from individuals reported having lower depresdepres-sion severity. Furthermore, at these levels of depression severity, Generalized Self-Criticism is less effective in discriminating individuals at risk for depression compared not only with statements of pessimism but also with statements denying optimism.
Conflict of Interests
The authors declare that they have no conflict of interests for this research.
Authors’ Contribution
All authors have made substantial contributions to concep-tion and design or acquisiconcep-tion of data or analysis and inter-pretation of data, have been involved in drafting the paper or revising it critically for important intellectual content, and have given final approval of the version to be published.
References
[1] C. Blanco, M. Okuda, J. C. Markowitz, S.-M. Liu, B. F. Grant, and D. S. Hasin, “The epidemiology of chronic major depressive disorder and dysthymic disorder: results from the national epi-demiologic survey on alcohol and related conditions,” Journal of Clinical Psychiatry, vol. 71, no. 12, pp. 1645–1656, 2010. [2] D. S. Hasin, R. D. Goodwin, F. S. Stinson, and B. F. Grant,
“Epidemiology of major depressive disorder: results from the National Epidemiologic Survey on Alcoholism and Related Conditions,” Archives of General Psychiatry, vol. 62, no. 10, pp. 1097–1106, 2005.
[3] V. Lehtinen and M. Joukamaa, “Epidemiology of depression: prevalence, risk factors and treatment situation,” Acta Psychi-atrica Scandinavica, Supplement, vol. 89, no. 377, pp. 7–10, 1994. [4] M. M. Ohayon, “Epidemiology of depression and its treatment in the general population,” Journal of Psychiatric Research, vol. 41, no. 3-4, pp. 207–213, 2007.
[5] C. Haslam, S. Atkinson, S. S. Brown, and R. A. Haslam, “Anxiety and depression in the workplace: effects on the individual and organisation (a focus group investigation),” Journal of Affective Disorders, vol. 88, no. 2, pp. 209–215, 2005.
[6] N. D. Shippee, N. D. Shah, M. D. Williams, J. P. Moriarty, M. A. Frye, and J. Y. Ziegenfuss, “Differences in demographic com-position and in work, social, and functional limitations among the populations with unipolar depression and bipolar disorder: results from a nationally representative sample,” Health and Quality of Life Outcomes, vol. 9, article 90, 2011.
[7] P. S. Wang, A. L. Beck, P. Berglund et al., “Effects of major depression on moment-in-time work performance,” American Journal of Psychiatry, vol. 161, no. 10, pp. 1885–1891, 2004. [8] S. W. Whitton and M. A. Whisman, “Relationship satisfaction
instability and depression,” Journal of Family Psychology, vol. 24, no. 6, pp. 791–794, 2010.
[9] J.-M. Woo, W. Kim, T.-Y. Hwang et al., “Impact of depression on work productivity and its improvement after outpatient treatment with antidepressants,” Value in Health, vol. 14, no. 4, pp. 475–482, 2011.
[10] T. B. Ustun, J. L. Ayuso-Mateos, S. Chatterji, C. Mathers, and C. J. L. Murray, “Global burden of depressive disorders in the year 2000,” British Journal of Psychiatry, vol. 184, pp. 386–392, 2004. [11] World Health Organisation, “Depression. What is depression?” 2011, http://www.who.int/mental health/management/depres-sion/en/.
[12] R. C. Kessler, P. Berglund, O. Demler et al., “The epidemiology of major depressive disorder: results from the National Comor-bidity Survey Replication (NCS-R),” Journal of the American Medical Association, vol. 289, no. 23, pp. 3095–3105, 2003. [13] G. de Girolamo, G. Polidori, P. Morosini et al., “La prevalenza
dei disturbi mentali in italia. Il progetto ESEMED-WMH. Una sintesi,” Centro Nazionale di Epidemiologia, Sorveglianza e Promozione della Salute, Roma, Italia, 2005.
[14] I. H. Gotlib and C. L. Hammen, Handbook of Depressioned, Guilford Press, New York, NY, USA, 2nd edition, 2010. [15] L. B. Alloy, L. Y. Abramson, W. G. Whitehouse et al.,
“Depresso-genic cognitive styles: predictive validity, information process-ing and personality characteristics, and developmental origins,” Behaviour Research and Therapy, vol. 37, no. 6, pp. 503–531, 1999. [16] E. R. Watkins, “Constructive and unconstructive repetitive thought,” Psychological Bulletin, vol. 134, no. 2, pp. 163–206, 2008.
[17] M. Balsamo, “Anger and depression: evidence of a possible mediating role for rumination,” Psychological Reports, vol. 106, no. 1, pp. 3–12, 2010.
[18] E. H. W. Koster, E. De Lissnyder, N. Derakshan, and R. De Raedt, “Understanding depressive rumination from a cognitive science perspective: the impaired disengagement hypothesis,” Clinical Psychology Review, vol. 31, no. 1, pp. 138–145, 2011. [19] M. Zhong, X. Wang, J. Xiao et al., “Amygdala hyperactivation
and prefrontal hypoactivation in subjects with cognitive vulner-ability to depression,” Biological Psychology, vol. 88, no. 2-3, pp. 233–242, 2011.
[20] R. H. Jacobs, M. A. Reinecke, J. K. Gollan, and P. Kane, “Empirical evidence of cognitive vulnerability for depression among children and adolescents: a cognitive science and devel-opmental perspective,” Clinical Psychology Review, vol. 28, no. 5, pp. 759–782, 2008.
[21] L. Y. Abramson, G. I. Metalsky, and L. B. Alloy, “Hopelessness depression: a theory-based subtype of depression,” Psychological Review, vol. 96, no. 2, pp. 358–372, 1989.
[22] A. T. Beck, Depression: Clinical, Experimental, and Theoretical Aspects, Harper & Row, New York, NY, USA, 1967.
[23] A. T. Beck, “Cognitive models of depression,” Journal of Cogni-tive Psychotherapy, vol. 1, pp. 5–37, 1987.
[24] A. T. Beck, A. Weissman, D. Lester, and L. Trexler, “The mea-surement of pessimism: the hopelessness scale,” Journal of Consulting and Clinical Psychology, vol. 42, no. 6, pp. 861–865, 1974.
[25] C. S. Carver and R. J. Ganellen, “Depression and components of self-punitiveness: high standards, self-criticism, and overgen-eralization,” Journal of Abnormal Psychology, vol. 92, no. 3, pp. 330–337, 1983.
[26] E. E. Beckham, W. R. Leber, J. T. Watkins, J. L. Boyer, and J. B. Cook, “ Development of an instrument to measure Beck’s cognitive triad: the Cognitive Triad Inventory,” Journal of Con-sulting and Clinical Psychology, vol. 54, no. 4, pp. 566–567, 1986. [27] L. Y. Abramson, L. B. Alloy, B. L. Hankin, G. J. Haeffel, D. G. MacCoon, and B. E. Gibb, “Cognitive vulnerability-stress models of depression in a self-regulatory and psychobiological
context,” in Handbook of Depression, I. H. Gotlib and C. L. Hammen, Eds., pp. 268–294, The Guilford Press, New York, NY, USA, 2002.
[28] J. Evans, J. Heron, G. Lewis, R. Araya, and D. Wolke, “Negative self-schemas and the onset of depression in women: longitudi-nal study,” British Jourlongitudi-nal of Psychiatry, vol. 186, pp. 302–307, 2005.
[29] L. B. Alloy, L. Y. Abramson, W. G. Whitehouse, M. E. Hogan, C. Panzarella, and D. T. Rose, “Prospective incidence of first onsets and recurrences of depression in individuals at high and low cognitive risk for depression,” Journal of Abnormal Psychology, vol. 115, no. 1, pp. 145–156, 2006.
[30] J. R. Z. Abela, C. Aydin, and R. P. Auerbach, “Operationalizing the “vulnerability” and “stress” components of the hopeless-ness theory of depression: a multi-wave longitudinal study,” Behaviour Research and Therapy, vol. 44, no. 11, pp. 1565–1583, 2006.
[31] A. T. Beck, R. A. Steer, M. Kovacs, and B. Garrison, “Hope-lessness and eventual suicide: a 10-year prospective study of patients hospitalized with suicidal ideation,” American Journal of Psychiatry, vol. 142, no. 5, pp. 559–563, 1985.
[32] A. T. Beck, G. Brown, R. J. Berchick, B. L. Stewart, and R. A. Steer, “Relationship between hopelessness and ultimate suicide: a replication with psychiatric outpatients,” American Journal of Psychiatry, vol. 147, no. 2, pp. 190–195, 1990.
[33] M. Pompili, M. Innamorati, X. Gonda et al., “Affective tem-peraments and hopelessness as predictors of health and social general functioning in mood disorders patients: a prospective follow-up study,” Journal of Affective Disorders, 2013.
[34] G. I. Metalsky and T. E. Joiner Jr., “Vulnerability to depressive symptomatology: a prospective test of the diathesis-stress and causal mediation components of the hopelessness theory of depression,” Journal of Personality and Social Psychology, vol. 63, no. 4, pp. 667–675, 1992.
[35] P. P¨ossel and S. D. Thomas, “Cognitive triad as mediator in the hopelessness model? a three-wave longitudinal study,” Journal of Clinical Psychology, vol. 67, no. 3, pp. 224–240, 2011. [36] M. F. Scheier, C. S. Carver, and M. W. Bridges, “Distinguishing
optimism from neuroticism (and trait anxiety, self-mastery, and self-esteem): a reevaluation of the Life Orientation Test,” Journal of Personality and Social Psychology, vol. 67, no. 6, pp. 1063–1078, 1994.
[37] C. S. Carver, L. La Voie, J. Kuhl, and R. J. Ganellen, “Cognitive concomitants of depression: a further examination of the roles of generalization, high standards, and self-criticism,” Journal of Social and Clinical Psychology, vol. 7, pp. 350–365, 1988. [38] A. T. Beck, R. A. Steer, and G. K. Brown, Manual for the
Beck Depression Inventory-II, Psychological Corporation, San Antonio, Tex, USA, 1996.
[39] American Psychiatric Association, Diagnostic and Statistical Manual of Mental Disorders, American Psychiatric Association, Washington, DC, USA, 4th edition, 2000.
[40] P. A. Arbisi, “Review of the Beck depression inventory-II,” in The Fourteenth Mental Measurements Yearbook, B. S. Plake and J. C. Impara, Eds., Buros Institute of Mental Measurements, Lincoln, Neb, USA, 2001.
[41] M. Balsamo and A. Saggino, “Test per l’assessment della depres-sione nel contesto italiano: un’analisi critica,” Psicoterapia Cog-nitiva e Comportamentale, vol. 13, pp. 167–199, 2007.
[42] A. T. Beck, R. A. Steer, J. S. Beck, and C. F. Newman, “Hope-lessness, depression, suicidal ideation, and clinical diagnosis of
depression,” Suicide and Life-Threatening Behavior, vol. 23, no. 2, pp. 139–145, 1993.
[43] E. D. Klonsky, R. Kotov, S. Bakst, J. Rabinowitz, and E. J. Bromet, “Hopelessness as a predictor of attempted suicide among first admission patients with psychosis: a 10-year cohort study,” Suicide and Life-Threatening Behavior, vol. 42, no. 1, pp. 1–10, 2012.
[44] M. Innamorati, M. Pompili, X. Gonda et al., “Psychometric properties of the Gotland Scale for Depression in Italian psychiatric inpatients and its utility in the prediction of suicide risk,” Journal of Affective Disorders, vol. 132, no. 1-2, pp. 99–103, 2011.
[45] M. Pompili, P. Iliceto, D. Lester et al., BHS Beck Hopelessness Scale, O.S. Organizzazioni Speciali, Florence, Italy, 2009. [46] M. Pompili, R. Tatarelli, J. R. Rogers, and D. Lester, “The
hopelessness scale: a factor analysis,” Psychological Reports, vol. 100, no. 2, pp. 375–378, 2007.
[47] C. S. Carver, “Generalization, adverse events, and development of depressive symptoms,” Journal of Personality, vol. 66, no. 4, pp. 606–619, 1998.
[48] L. R. Eisner, S. L. Johnson, and C. S. Carver, “Cognitive responses to failure and success relate uniquely to bipolar depression versus mania,” Journal of Abnormal Psychology, vol. 117, no. 1, pp. 154–163, 2008.
[49] M. Innamorati, S. Tamburello, A. Contardi et al., “Psychometric properties of the attitudes toward self-revised in Italian young adults,” Depression Research and Treatment, vol. 2013, Article ID 209216, 6 pages, 2013.
[50] R. B. Cattell, “The scree test for the number of factors,” Multivariate Behavioral Research, vol. 1, pp. 245–276, 1966. [51] W. F. Velicer, “Determining the number of components from
the matrix of partial correlations,” Psychometrika, vol. 41, no. 3, pp. 321–327, 1976.
[52] P. Kline, A Handbook of Test Construction: Introduction to Psychometric Design, Methuen, London, UK, 1986.
[53] H. Gleitman, Psychologyed, W.W. Norton, New York, NY, USA, 2nd edition, 1986.
[54] L. B. Alloy and A. H. Ahrens, “Depression and pessimism for the future: biased use of statistically relevant information in predictions for self versus others,” Journal of Personality and Social Psychology, vol. 52, no. 2, pp. 366–378, 1987.
[55] A. Lavender and E. Watkins, “Rumination and future thinking in depression,” British Journal of Clinical Psychology, vol. 43, no. 2, pp. 129–142, 2004.
[56] D. R. Strunk, H. Lopez, and R. J. DeRubeis, “Depressive symptoms are associated with unrealistic negative predictions of future life events,” Behaviour research and therapy, vol. 44, no. 6, pp. 861–882, 2006.
[57] A. T. Beck, J. H. Riskind, G. Brown, and R. A. Steer, “Levels of hopelessness in DSM-III disorders: a partial test of content specificity in depression,” Cognitive Therapy and Research, vol. 12, no. 5, pp. 459–469, 1988.
[58] D. R. Strunk and A. D. Adler, “Cognitive biases in three prediction tasks: a test of the cognitive model of depression,” Behaviour Research and Therapy, vol. 47, no. 1, pp. 34–40, 2009. [59] B. A. Alford, J. M. Lester, R. J. Patel, J. P. Buchanan, and L. C. Giunta, “Hopelessness predicts future depressive symptoms: a prospective analysis of cognitive vulnerability and cognitive content specificity,” Journal of Clinical Psychology, vol. 51, no. 3, pp. 331–339, 1995.
[60] M. F. Scheier and C. S. Carver, “Optimism, coping, and health: assessment and implications of generalized outcome expectancies,” Health Psychology, vol. 4, no. 3, pp. 219–247, 1985. [61] M. Balsamo, R. Romanelli, M. Innamorati, G. Ciccarese, L. Carlucci, and A. Saggino, “The state-trait anxiety inventory: shadows and lights on its construct validity,” Journal of Psy-chopathology and Behavioral Assessment, 2013.
[62] L. J. Cronbach, “Response sets and test validity,” Educational and Psychological Measurement, vol. 6, pp. 475–494, 1946.
[63] J. Millham and R. W. Kellogg, “Need for social approval: impression management or self-deception?” Journal of Research in Personality, vol. 14, no. 4, pp. 445–457, 1980.
[64] G. N. Marshall, C. B. Wortman, J. W. Kusulas, L. K. Hervig, and R. R. Vickers Jr., “Distinguishing optimism from pessimism: relations to fundamental dimensions of mood and personality,” Journal of Personality and Social Psychology, vol. 62, no. 6, pp. 1067–1074, 1992.
[65] D. K. Mroczek, A. Spiro III, C. M. Aldwin, D. J. Ozer, and R. Boss´e, “Construct validation of optimism and pessimism in older men: findings from the normative aging study,” Health Psychology, vol. 12, no. 5, pp. 406–409, 1993.
[66] J. C. Lai, “Differential predictive power of the positively versus the negatively worded items of the Life Orientation Test,” Psychological Reports, vol. 75, no. 3, pp. 1507–1515, 1994. [67] S. Robinson-Whelen, C. Kim, R. C. MacCallum, and J. K.
Kiecolt-Glaser, “Distinguishing optimism from pessimism in older adults: is it more important to be optimistic or not to be pessimistic?” Journal of Personality and Social Psychology, vol. 73, no. 6, pp. 1345–1353, 1997.
[68] P. Y. Herzberg, H. Glaesmer, and J. Hoyer, “Separating optimism and pessimism: a robust psychometric analysis of the revised Life Orientation Test (LOT-R),” Psychological Assessment, vol. 18, no. 4, pp. 433–438, 2006.
[69] M. Kivim¨aki, M. Elovainio, A. Singh-Manoux, J. Vahtera, H. Helenius, and J. Pentti, “Optimism and pessimism as predictors of change in health after death or onset of severe illness in family,” Health Psychology, vol. 24, no. 4, pp. 413–421, 2005. [70] K. R¨aikk¨onen, K. A. Matthews, J. D. Flory, J. F. Owens, and B.
B. Gump, “Effects of optimism, pessimism, and trait anxiety on ambulatory blood pressure and mood during everyday life,” Journal of Personality and Social Psychology, vol. 76, no. 1, pp. 104–113, 1999.
[71] M. Innamorati, D. Lester, M. Balsamo et al., “Factor validity of the Beck Hopelessness Scale in Italian medical patients,” Journal of Psychopathology and Behavioral Assessment. In press. [72] A. T. Beck, “Beyond belief: a theory of modes, personality,
and psychopathology,” in Frontiers of Cognitive Therapy, P. M. Salkovskis, Ed., Guildford Press, New York, NY, USA, 1996. [73] A. T. Beck, Cognitive Therapy of Depression, Guilford Press, New
York, NY, USA, 1979.
[74] D. T. Campbell and D. W. Fiske, “Convergent and discriminant validation by the multitrait-multimethod matrix,” Psychological Bulletin, vol. 56, no. 2, pp. 81–105, 1959.
[75] H. J. Arnold and D. C. Feldman, “Social desirability response bias in self-report choice situations,” Academy of Management Journal, vol. 24, pp. 377–385, 1981.
[76] E. E. Maccoby and N. A. Maccoby, “The interview: a tool of social science,” in Handbook of Social Psychology, G. Lindzey, Ed., pp. 449–487, Addison-Wesley, Cambridge, Mass, USA, 1954.
Submit your manuscripts at
http://www.hindawi.com
Hindawi Publishing Corporation
http://www.hindawi.com Volume 2013 Oxidative Medicine and Cellular Longevity
Hindawi Publishing Corporation
http://www.hindawi.com Volume 2013 Hindawi Publishing Corporation
http://www.hindawi.com Volume 2013
The Scientific
World Journal
International Journal of
Endocrinology
Hindawi Publishing Corporationhttp://www.hindawi.com Volume 2013
ISRN
Anesthesiology Hindawi Publishing Corporation
http://www.hindawi.com Volume 2013
Hindawi Publishing Corporation http://www.hindawi.com
Oncology
Volume 2013
PPAR
R e s e a r c h
Hindawi Publishing Corporation
http://www.hindawi.com Volume 2013
Ophthalmology
Journal ofHindawi Publishing Corporation
http://www.hindawi.com Volume 2013
ISRN Allergy Hindawi Publishing Corporation
http://www.hindawi.com Volume 2013
BioMed Research International
Hindawi Publishing Corporation
http://www.hindawi.com Volume 2013
Hindawi Publishing Corporation
http://www.hindawi.com Volume 2013
Obesity
ISRN Addiction Hindawi Publishing Corporation
http://www.hindawi.com Volume 2013
Hindawi Publishing Corporation
http://www.hindawi.com Volume 2013 Computational and Mathematical Methods in Medicine ISRN AIDS Hindawi Publishing Corporation
http://www.hindawi.com Volume 2013
Clinical & Developmental Immunology
Hindawi Publishing Corporation
http://www.hindawi.com Volume 2013
Diabetes ResearchJournal of
Hindawi Publishing Corporation
http://www.hindawi.com Volume 2013
Evidence-Based Complementary and Alternative Medicine
Volume 2013 Hindawi Publishing Corporation
http://www.hindawi.com Hindawi Publishing Corporation
http://www.hindawi.com Volume 2013
Gastroenterology Research and Practice
Hindawi Publishing Corporation
http://www.hindawi.com Volume 2013 ISRN
Biomarkers
Hindawi Publishing Corporation
http://www.hindawi.com Volume 2013