A sonic root detector for revealing
tree coarse root distribution
Andrea R. proto
1, Antonino Di iorio
2✉, Lorenzo M. Abenavoli
1& Agostino Sorgonà
1this study assesses the reliability of a non-destructive method for determining the in situ distribution of tree coarse roots within a scaled distance 6-fold the DBH by comparing the results with the actual 3D root architecture revealed by invasive methods. The root architecture of 22-year-old olive trees was determined non-destructively with a Root Detector device (Fakopp Enterprise Bt) using sonic speed and directly by a 3D digitizer (Fastrak, Polhemus) after soil removal. The radial and vertical distributions of the coarse root biomass and diameter in the soil as determined by the 3D digitizer were correlated with the root map detected by sonic speed. A highly significant correlation was observed between the coarse root biomass distribution and the sonic speed within 30 cm of soil depth, but this correlation decreased with increasing distance from the trunk, up to 120 cm. No correlations were observed between sonic speed and root diameter. The Root Detector was able to map the coarse roots of the olive tree in the soil environment, but only under certain conditions. First, root detection was more efficient within 30 cm of soil depth, provided that more than 35% of the total biomass of lateral roots occurs within this depth range. Second, the distance of 120 cm from the trunk, scaled as 6-fold the DBH, may be considered the threshold over which the sonic speed and the detection of roots markedly decreased. Third, Root Detector technology is unable to detect root size in terms of geometric parameters such as root diameter.
Root architecture, i.e., the root radial and vertical distribution in the soil, is involved in different plant functional roles, such as nutrient and water acquisition1,2 and mechanically active anchorage in the soil, which determines tree stability3. The importance of the mechanical role of root architecture in tree stability has been extensively described in previous studies4–7. The failure of urban and forest trees is often a consequence of the low perfor-mance of this root feature caused by root decay, injury, breaking or low biomechanical acclimation to, for exam-ple, wind loads8,9.
High frequencies of storms, windstorms and other similar extreme events are generally responsible for more than 50% of the damage by volume to European forests13,14 and are expected to increase under the observed ongo-ing climate changes10–12. Furthermore, tree instability threatens property and people in urban forests15. Hence, evaluations of root health/decay/injury and the root radial and vertical distribution in the soil in particular are crucial for both tree stability and consequently for safety in urban environments16.
Because roots grow belowground, the radial and vertical root distributions of trees and crop fruits are mainly determined by destructive methods that involve excavating the root system from the soil and digitizing the system using different 3D digitizers, such as magnetic (Fastrak, Polhemus, Colchester, VT, USA)17,18 or sonic (GTCO Freepoint 3D) 3D digitizers19. Following digitization, the root architecture can be reconstructed with different specific softwares: Floradig (CSIRO, Australia) or AMAPmod (AMAP, France). Fastrak-AMAPmod technology has already been used to digitize and analyse the 3D root architecture mainly of forest species (Pinus: 19; Picea: 8;
Quercus: 1820,), shrubs (Jathropa curcas: 21 Spartium junceum: 22), herbs (Zea mays: 23) and fruit species (Olea: 24). Using Fastrak technology, it is possible to estimate several root biometric and geometric parameters at different soil depths and radial distributions, such as biomass, length, diameter, and angle. However, some limitations have been noted for these root techniques, such as high sensitivity to wind fluctuations in the field for the sonic digitizer25 and the interference with the Fastrak magnetic field by surrounding iron frames26. Above all, root exca-vation methods are extremely time consuming and labour intensive, and they are not always an option, especially in urban environments, because of the presence of pavement as well as underground service lines, pipes, rocks, and other buried materials.
1Department of Agriculture, Mediterranean University of Reggio Calabria, Feo di Vito, 89122, Reggio Calabria, Italy. 2Department of Biotechnologies and Life Sciences, University of Insubria, 21100, Varese, Italy. ✉e-mail: antonino. [email protected]
For these reasons, root scientists have long sought reliable, non-destructive methods for detecting, measur-ing, and visualizing the hidden half of living trees, both in pot and field-grown conditions. For example, X-ray computed tomography (X-ray CT) (27,28 in pots; 29 in the field), electrical impedance tomography (EIT) (30 in pots; 31 in the field), magnetic resonance imaging (MRI) (32 in pots), magnetic resonance imaging-positron emission tomography (MRI-PET) (33 in pots) and ground-penetrating radar (GPR) (34 in the field) have been used for root architecture analysis. However, for CT technology, the high soil water content causes an attenuation problem, i.e., the technology can’t distinguish the root from other nonspecific soil organic matter35. MRI is limited by high water content, while MRI-PET is a technique under development36. GPR is more limited in urban environments because it fails to distinguish roots from utility lines (gas and water pipes)35 and is not effective in soils with high clay or water content37. In addition to these limitations, these techniques are also very expensive; therefore, no efficient and inexpensive non-destructive method exists for mapping tree root systems or for identifying the presence of individual large roots38.
Recently, based on sonic tree tomography and the principle that sound waves travel more slowly through soil than through healthy wood, two studies examined the application of this principle for the detection of coarse roots in the soil39,40. However, none of them provided a robust statistical investigation of the relationship between the sonic speed and the actual 3D root architecture or size-dependent morphological traits, such as biomass/ volume/diameter; these studies only provided a visual assessment of the congruity between the photographed or drawn root map with the speed spectra measured at different distances and directions from the trunk base. Given these conditions, this paper details a pilot study investigating the reliability of a non-destructive method, i.e., Root Detector + ArborSonic 3D (Fakopp Enterprise Bt, Hungary), for determining the presence and radial distribution of the individual roots by statistical correlation of the sonic speed data with those obtained from the detailed root radial and vertical distribution by a 3D digitizer (3 Space Fastrak, Polhemus Inc., Colchester, VT). The maximum radial distance investigated was approximately 6-8-fold the DBH; more than 80% of the root sys-tem biomass of sys-temperate tree species is confined within this distance (17,18,41 and references therein). To this aim, this paper addresses the following questions:
1) At what distance from the trunk and up to what soil depth does the Root Detector effectively detect roots? 2) What is the minimum root diameter effectively detected by the Root Detector? Of the mean diameter and
the biomass of a root axis, which of the two best correlates with the Root Detector outputs? 3) Is the Root Detector able to determine the root radial distribution?
As a case study, considering that the root architecture of olive trees changes in response to different harvesting methods24, two individuals with hypothetically different root architecture were selected.
Materials and Methods
Site description and plant material.
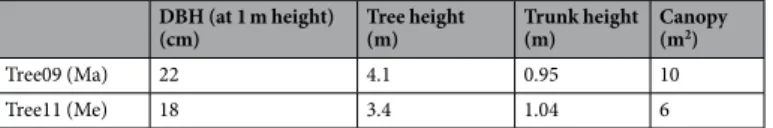
The experiments were conducted in an organic olive tree orchard in Satriano, Calabria (Italy). The general characteristics of this area were already described in a previous work carried out on the same site24. Briefly, the site is located on a southwest-facing slope (300 m altitude, 38°39’ N, 16°28’E, mean slope of 20°) on a clay loam, medium calcareous soil, with slightly alkaline pH. Two adult (22-year-old) olive trees (Olea europaea L.), hereafter named Tree09 and Tree11, were selected from an orchard planted at 6 ×5 m spacing, equal to 334 tree ha−1 density. The trees were obtained by grafting the Carolea cultivar onto seedlings and were trained according to the vase system24. The two olive trees were selected for their different harvesting methods, manual and mechanical, for Tree09 and Tree11, respectively; the olive harvesting method is known to change the root architecture24 (see Table 1 for aboveground tree parameters).The olive trees were not irrigated. For the other crop management practices (fertilization, tillage and crop protection), both trees were treated equally following the recommended standards for organic cultivation as indi-cated by EU (Reg. CE 834/07 and 889/08) and national regulations (MD 18354/2009)24.
Root detector.
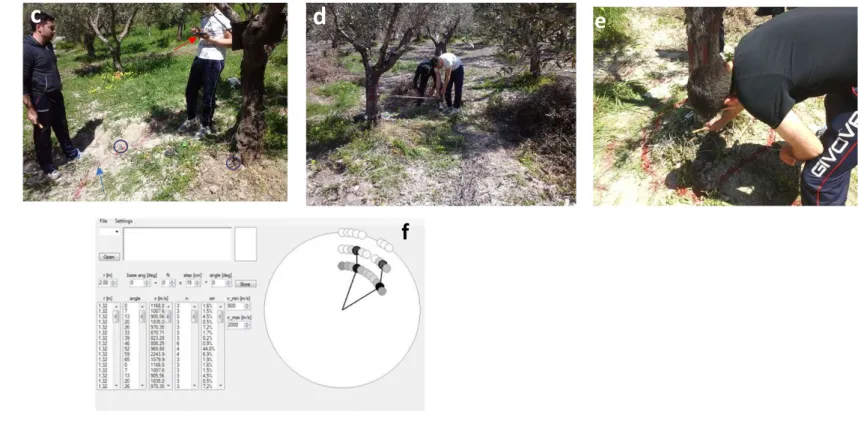
The root radial distribution was estimated in situ by using the Root Detector together with ArborSonic 3D, both distributed by Fakopp Enterprises Bt (Hungary). Briefly, the device consists of a control unit (ArborSonic 3D), a SD02 piezo sensor (the transmitter) with the spike inserted at the tree collar (the tap-ping point) and pointed towards the roots, and a soil sensor (the receiver; a high-frequency geophone) with the spike inserted into the soil (Fig. S1; the persons depicted in the photographs gave their informed consent for the publication of identifying images in an online open-access publication). The method is based on sonic tree tomography, which determines the quality of the mechanical connection between sending and receiving sensors by measuring the time-of-flight of stress waves42,43. This principle is also applied to root detection and is based on the acoustic signal’s velocity difference between the root and the soil: the travel time decreases significantly when the root is detected and is nearby (closer than 10 cm)40.DBH (at 1 m height)
(cm) Tree height(m) Trunk height(m) Canopy(m2)
Tree09 (Ma) 22 4.1 0.95 10 Tree11 (Me) 18 3.4 1.04 6
Table 1. Aboveground parameters of the two olive trees characterized by manual (Ma) and mechanical
In our experiment, the measurements were performed along three circles around the olive trunk at distances of 40, 80 and 120 cm from the trunk surface (marked using lines on the ground) and at every 10 degrees, called sectors, in the clockwise direction for each circle. A further set of measurements was carried out at 160 cm, but the halved sonic speed and the increased coefficient of variation made these measurements unsuitable for the calculations. Therefore, thirty-six values for each circle for a total of 108 values (36 measurements x 3 distances) for each plant were obtained. To maintain a constant distance between the tree and the soil sensor, a loose rope was tied around the tree (Fig. S1). At each distance, and starting at the “0 degree” point, the soil sensor was moved along the circle in each sector by the “Step” value shown by the software, making sure that the rope remained taut. Three hits are necessary to obtain valid data that represent the sonic speed (m s–1). The estimated time per person required for setting up and recording 108 measurements was 45 minutes.
In Fig. S1, a typical output graph from the Root Detector Evaluation Software (Fakopp Enterprise Bt, Hungary) showing the data from each single measurement point coloured in grey levels is provided; the darker the grey colour, the higher the sonic speed and, consequently, the shallower and larger the root. According to the device settings, the speed values are considered relevant when they are higher than the mean value of the measured range [(min+max)/2]. However, in this study, representation with vectors, which better indicate the magnitude and direction of the sonic speed data for each 10-degree sector, was preferred.
Excavation and 3D root architecture measurement.
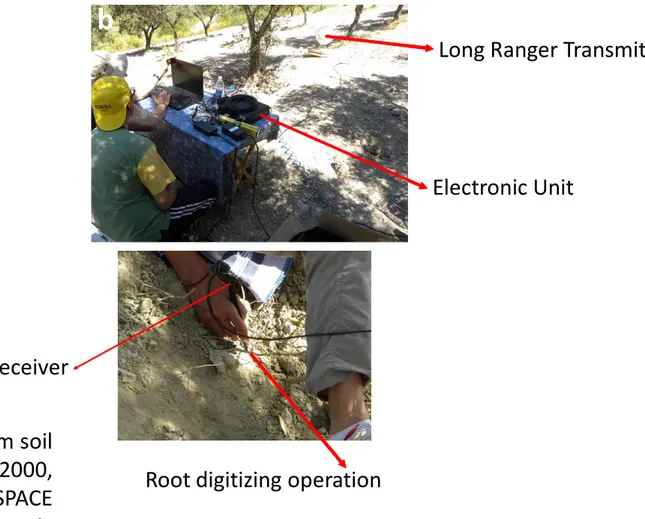
After measurements with the Root Detector, the same root systems were freed from soil using high-pressure air lances (AirSpade 2000, Chicopee, MA, USA) as already described in Sorgonà et al. (24 and references therein). An Air-Spade supplied with compressed air from a standard 4.25 m−3 min−1 road-works compressor loosened and removed the soil from around the trunks with little or no damage to the roots. The root systems were exposed to depths of 1 m and to distances of ≈ 1.5 m from the trunk (i.e., the bark surface) (Fig. S2; the persons depicted in the photographs gave their informed consent for the publication of identifying images in an online open-access publication). The volume of soil removed (≈ 4 m3) was not as large as to compromise the stability of the tree or the operator’s safety. No rotten roots were observed.Three-dimensional position coordinates (X, Y, Z) of the roots with a proximal (i.e., at the branching point) diameter larger than 5 mm were measured in situ with a 3D digitizer (3 Space Fastrak, Polhemus Inc., Colchester, VT), a low-frequency electromagnetic field sensing-based technology (Fig. S2). The characteristics of this device are explained in previous works17,18. Briefly, the root system architecture was digitized by starting from the top of the stump and following a recursive path along the branching network up to a terminal diameter of 2 mm. After the 3D root architecture measurement, the root systems were covered again with the original soil to reduce disturbance.
Root architecture analysis.
The roots were assumed to be either circular or elliptical in cross-section. The geometric mean of the maximum and minimum diameters determined the mean diameter of the oval-shaped roots24. The output data file was analysed using AMAPmod software25, which handles topological structure and provides 3D graphical reconstruction for data validation (Fig. 1). All topological and geometrical data were exported to Microsoft Excel 2010 (Microsoft Office, USA) for specialized processing22,24. In particular, the dis-tance between two corresponding measurement points was used as the segment length. The segment volume was calculated as a truncated cone based on its length and proximal and distal diameters. The length or volume of a root axis was the sum of the length or volume of all its segments. These computations were made with a macro suitably realized with Microsoft Visual Basic 6.024.In this work, the depth-related root detection instrument accuracy was evaluated by correlating the sonic speed data with the detailed root radial and vertical distribution obtained by the 3D digitizer. The calculations were performed using a method broadly explained in Sorgonà et al.24, but the specific requirements for its applica-tion in this work are provided below. Briefly, the digitized root system was virtually located in a grid made of three 30 cm thick stump centred cylinders (named D30, D60 and D90) stacked to 90 cm depth to equal the removed soil volume of ≈ 4 m3 (Fig. S3). The radius of the cylinders was set at the same distance as the Root Detector meas-urements, i.e., 40, 80 and 120 cm. The cylinders were divided into 36 sectors, 10° wide (as in the Root Detector measurements) (Fig. S3), resulting in 324 boxes (36 sectors × 3 depths × 3 distances) in total. Within each box, all the roots were virtually sliced, and their volume was determined. The root system was aligned so that the 0–30° and 330–360° sectors coincided with the downslope direction and the 150–180° and 180–210° sectors coincided with the upslope direction. The alignment matched that used for the Root Detector measurements. The root biomass was estimated by conversion using the density value empirically obtained by oven-dried root core sam-ples extracted from roots of different diameters with an increment corer 0.5 cm in diameter (Haglöf Sweden AB, Sweden, www.haglofsweden.com). Afterwards, considering the soil volume of each sector and the soil depth, the root biomass density was calculated (root dry mass/soil volume, kg cm−3) at each soil depth and distance from the trunk base.
Statistical analysis and calculation.
Within each tree, the clustering tendency of the radial distribution of both the root biomass and the sonic speed values was evaluated using circular statistical methods, namely, Hotelling’s test24,44,45, in Oriana software v. 4.02 (Kovach Computing Services; 46). Hotelling’s test calculates whether the centroid of the endpoints of the weighted vectors differs from the origin, i.e., whether the weighted angles have a significant mean direction at the probability level of 0.0524.To verify the detection resolution of the Root Detector, we proceeded as follows:
1) Correlation analysis (Pearson test) between the sonic speed and the root biomass density data calculated for all 36 sectors and at each distance from the trunk base and soil depths. This procedure allowed us to infer the maximum soil depth and horizontal distance from the trunk base within which the root signal is detected;
2) Correlation analysis (Pearson test) between the sonic speed and the root average diameter calculated for all 36 sectors and at each distance from the trunk base and soil depths. This analysis provided information about the efficient detection of root diameter by the Root Detector.
Considering that sound propagates in soil with three compressional waves and one shear wave (i.e., an S wave)47,48, and since the soil sensor of the Root Detector was inserted into the soil surface (~10 cm), the root bio-mass density (kg m−3) and the root diameter data were determined cumulatively as the sum of the volume values and the mean of the diameter values, respectively, of all the root segments located in the soil volume considered up to the selected depth and distance. For example, for the soil depth D60 and the distance from the trunk base 80 cm, all the root segments located in a soil sector 10° wide, 60 cm deep and 80 cm long were considered (Fig. S3). Statistical analysis was conducted using SPSS Inc., V. 20.0, 2002 (SPSS Inc., Evanston, IL, USA) except where otherwise indicated.
Results
Root mapping by Root Detector.
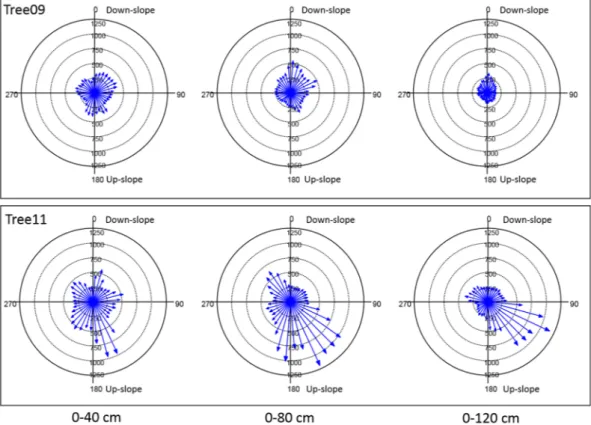
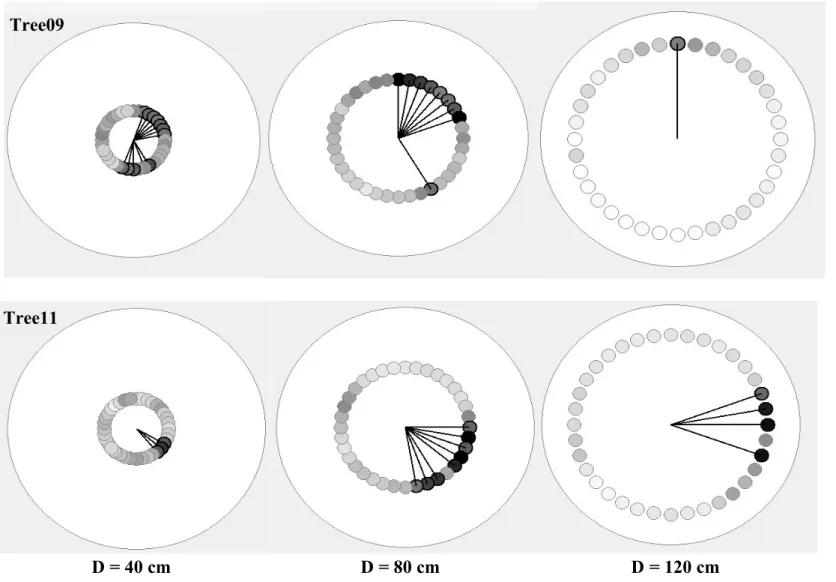
The Root Detector revealed sonic speeds with different magnitudes and radial distributions in both trees. For the magnitude, in particular, the lowest sonic speeds measured by Root Detector were 136 and 166 m s−1 for Tree09 and Tree11, respectively. A similar pattern was observed for the highest values: 581 and 1266 m s−1 for Tree09 and Tree11, respectively (Fig. 2). Furthermore, the sonic speed reduced its magnitude with increasing distance from the trunk, especially for Tree09, and its mean value was always significantly higher for Tree11 than for Tree09 (P < 0.05, Fig. 2), suggesting that the root system of Tree11 was shallower than that of Tree09.For the radial distribution of the roots, the Root Detector Evaluation Software provided a graphical output, as shown for Tree09 and Tree11 in Fig. S4, where circles represent the differently spaced (40, 80 and 120 cm) measurement points around the trunk, and grey levels increase with increasing sonic speed. In this work, vectors were preferred over grey levels because they better indicate the magnitude and direction of the sonic speed; these values suggest the presence of roots as well as providing a “gross” evaluation of root size (larger or smaller). For Tree09, higher sonic speed values were detected in the sectors 20°–80°/140°–210°, 0°–20°/60°– 80°/150°–160°/350–360° and 0°–30°/330°–360° at 40, 80 and 120 cm of distance from the trunk, respec-tively (Fig. 3). The sonic speed showed a different radial distribution pattern for Tree11, specifically, sectors
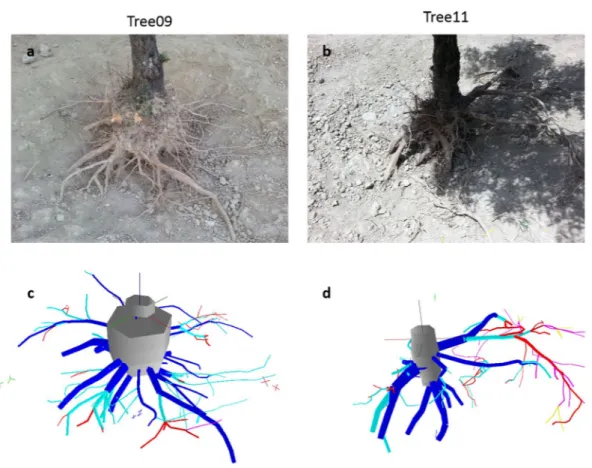
Figure 1. 3D image reconstruction of the two studied olive root systems. Comparison between the images
obtained (a,b) by camera and (c,d) by 3D reconstruction from digitization using AMAPmod software. The root axes are coloured as a function of their branching order: dark-grey, taproot; blue, first-order; light-blue, second-order; red, third-order; violet, fourth-order; yellow, fifth-order. The 3D reconstructed root systems were oriented to fit the view shown in the camera images.
10°–20°/70°–80°/140°–180°/210°–230°, 110°–200°/310°–330° and 100–160° at 40, 80 and 120 cm of distance from the trunk, respectively (Fig. 3). No preferential direction of sound propagation emerged for either tree (Hotelling’s test P > 0.05).
3D root architecture by Fastrak.
In this experiment, the radial distribution of the root biomass density of the two olive trees at D30 and D90 cm soil depths indicated well-defined but different root distribution pat-terns (Figs. 4 and 5). In particular, with 0° indicating the down-slope direction, within the shallower soil layer (D30), the root biomass significantly clustered in the 175–185° sectors for Tree09 (Hotelling’s test P < 0.05) andFigure 2. Boxplot of distributions of the sonic speed (m s−1) detected by Root Detector for the two Olea
europaea trees at different distances from the trunk (0–40 cm, 0–80 cm; 0–120 cm). Circles indicate outlier
values; asterisks indicate extreme values.
Figure 3. Sonic speed (m s−1) measured by Root Detector at different distances from the trunk (40, 80 and 120 cm) in 36 10-degree sectors for the two studied Olea europaea trees. The magnitude and direction of the sonic speed are represented by vectors. 0° coincides with the down-slope direction.
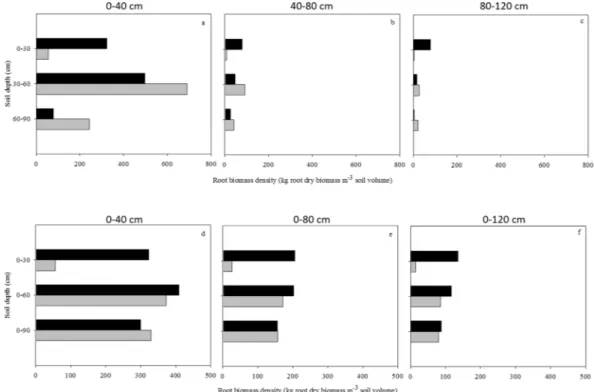
Figure 4. Root biomass density (kg m−3) distribution at different distances from the bark surface (0–40 cm, 0–80 cm; 0–120 cm) and to 30 cm soil depth within 36 10-degree sectors for the two studied Olea europaea trees. 0° coincides with the down-slope direction. Each bar indicates the root biomass density of the first three orders of lateral roots within the 10-degree sector. If present, the black arrow from the centre indicates the significant direction of root clustering (centre of mass).
Figure 5. Root biomass density (kg m−3) distribution at different distances from the bark surface (0–40 cm, 0–80 cm; 0–120 cm) and to 90 cm soil depth within 36 10-degree sectors for the two studied Olea europaea trees. 0°coincides with the down-slope direction. Each bar indicates the root biomass density of the first three orders of lateral roots within the 10-degree sector. If present, the black arrow from the centre indicates the significant direction of root clustering (centre of mass).
in the 140°–160° sectors for Tree11, although not significantly (Hotelling’s test P > 0.1) (Fig. 4). It is worth noting that neither Tree09 nor Tree11 changed their radial distribution pattern with increasing distance from the trunk (Fig. 4). Considering the whole 90 cm soil depth (D90), the root biomass of Tree09 was mainly concentrated in the 170° sector and, to a lesser extent, the 80° and 100° sectors within 40 cm from the trunk; at 120 cm distance, the 10° sector had a notable amount of root biomass (Fig. 5). Tree11 allocated its root biomass prevalently to the 330° sector, reorienting it to the 140°–160° sectors at further distances from the trunk (Fig. 5). No preferential direction of biomass allocation was observed for either tree (Hotelling’s test P > 0.05).
In Fig. 6, the compartmentalized (Fig. 6a–c) and cumulative (Fig. 6d–f) root biomass density at different soil depths and distances from the trunk surface of the two olive trees are shown. Tree09 allocated more root biomass to the deeper soil layers preferentially at D60 and, to a lesser extent, at D90 (Fig. 6). This pattern was maintained along the distance from the trunk. Conversely, Tree11 had a preferential distribution of root biomass density in the shallower soil layers (D30) at all distances from the trunk (Fig. 6). From panels Fig. 6a–c, it is possible to infer that more than 80% of the total root biomass was located within 40 cm from the trunk base and within 0.9 m soil depth.
Root architecture - Root Detector output data correlation analysis.
Tree11 showed significant (0.001 < P < 0.003) coefficients of correlation (r) between the sonic speed and the root biomass density. The cor-relation coefficients decreased with increasing soil depth and distance from the trunk, and their highest value was calculated at 80 cm (Table 2). Conversely, Tree09 showed no correlation at any distance or soil depth. Indeed, asFigure 6. Root biomass density (kg root dry mass m−3 soil volume) (a–c) and its cumulative patterns (d–f) in Olea europaea trees (Tree09: grey; Tree11: black) with increasing soil depth [(a) 0–30 cm, (b) 30–60 cm, (c) 60–90 cm, (d) 0–30 cm, (e) 0–60 cm, (f) 0–90 cm] and distance from the bark surface [(a) 0–40 cm, (b) 40–80 cm, (c) 80–120 cm, (d) 0–40 cm, (e) 0–80 cm, (f) 0–120 cm]. 0–40 cm 0–80 cm 0–120 cm Tree09 D30 −0.030NS −0.129NS −0.188NS D60 0.166NS 0.091NS −0.168NS D90 0.187NS 0.253NS 0.031NS Tree11 D30 0.611*** 0.718*** 0.484** D60 0.181NS 0.467** 0.284NS D90 0.164NS 0.412* 0.242NS
Table 2. Correlation coefficient (r) and P values of the correlation analysis (Pearson test) between the sonic
speed and root biomass density revealed by Root Detector and Fastrak, respectively, in two olive trees at different distance from trunk (0–40, 0–80 and 0–120 cm) and soil depth (D30, D60, D90). P values: *P < 0.05; **P < 0.01; ***P < 0.001; NS not significant.
observed in this study, the clear detection of the root axes for Tree11 was possible because it had shallower root architecture than Tree09, which, in contrast, deepened its root axes into the soil (Fig. 6).
On the other hand, a significant correlation between sonic speed and root diameter was obtained only for shallow soil layers (D30) and at 80 cm distance from the trunk for Tree11 (Table 3), but this correlation had r values that were markedly lower than those for root biomass density.
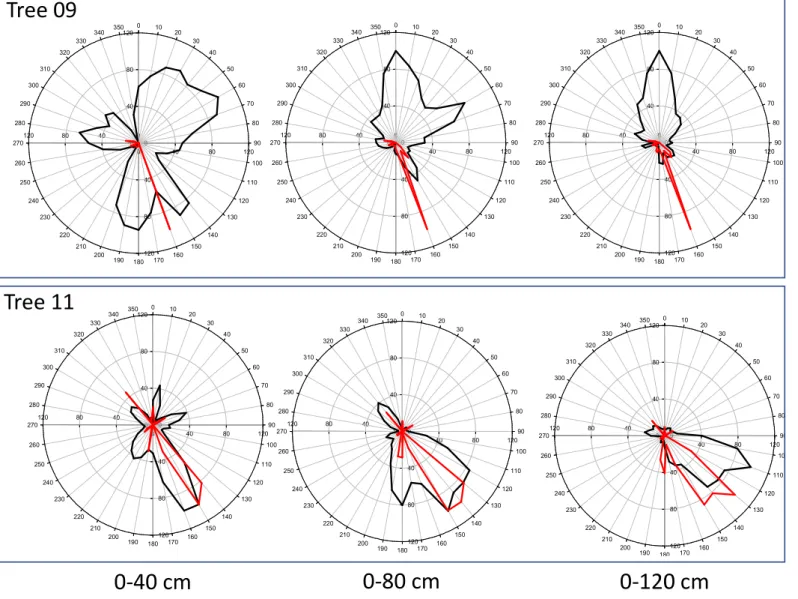
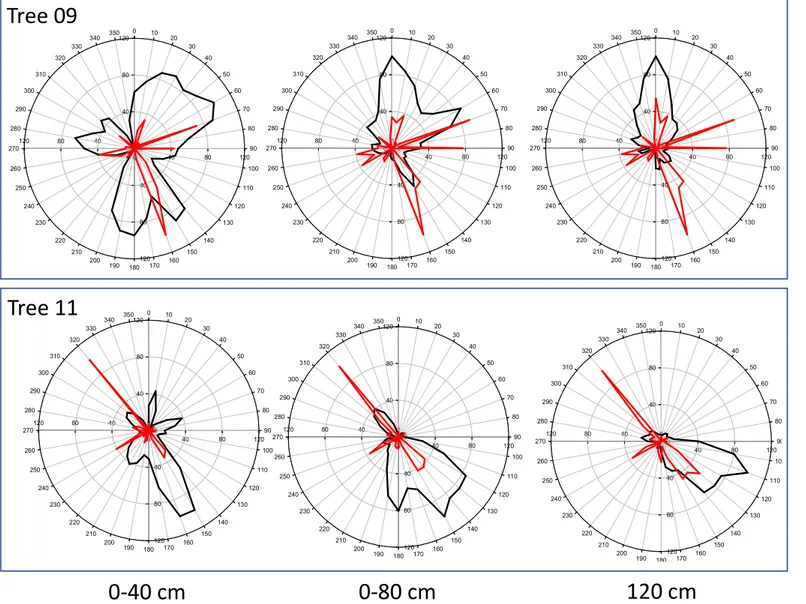
The strict root biomass and sonic speed relationships that were observed more for Tree11 than for Tree09 and at shallower (D30) but not at deeper (D60 and D90) soil layers are highlighted in the visual comparison of the radial distribution of the total root biomass density shown in Fig. 6 and the sonic speed shown in Fig. 2. Indeed, at the D30 soil depth, the sonic speed was higher for Tree11 than for Tree09, and it decreased with increasing distance from the trunk, as observed for the root biomass density. To better represent this relationship, the radial distribution of the sonic speed and root biomass density values for the olive trees in the 36 sectors of 10° degrees at different distances from the trunk and at D30 and D90 soil depths were normalized, respectively, where the maximum values were assigned a value of unity (Figs. S5 and S6). For Tree11, the radial distribution of the root biomass density coincided with that of sonic speed values but at the D30 soil depth only (Fig. S5), while this overlapping was lost at the D90 soil depth (Fig. S6). Conversely, the radial distribution of the root biomass density of Tree09 did not overlap with the sonic speed values at any distance from trunk or any soil depth (Figs. S5 and S6). Although referred to the investigated trees, it is reasonable to scale the reliability of the Root Detector to a distance of up to 6-fold the DBH (measured at 1 m height in this specific case study) and to a soil depth of 30 cm provided that more than 35% of the total root biomass occurs within this range.
Discussion
The two studied olive trees exhibited completely different root architecture in terms of the radial and depth dis-tribution of the root biomass; the roots were shallower for Tree11 and deeper for Tree09. These two different root distribution patterns, on the one hand, confirmed the results of Sorgonà et al24 noting a root biomass distribution for mechanically harvested olive trees (i.e., Tree11) that was more superficial than that of manually harvested trees (i.e., Tree09); on the other hand, these patterns were suitable for testing the accuracy and limits of Root Detector technology.
In this study, a quantitative evaluation, i.e., a correlation analysis between the sonic speed and the root diam-eter values within each 10° sector at different soil depths and distances from the trunk for each olive tree, was performed. The sonic speed values were higher than those obtained by Rinn (2016) (0–500 m s-1) by sonic tomog-raphy with Arboradix (Rinntech, Heidelberg/Deutschland). The different plant species, environmental condi-tions, soil moisture content and soil compaction levels and, above all, the different instruments are probably involved in this difference48,49.
The first question addressed by this work was to verify through a statistical approach the capacity of the Root Detector to reveal the presence of coarse tree roots at a certain soil depth and distance from the trunk. For these reasons, the sonic speed values obtained by Root Detector were correlated with the root biomass density meas-ured by Fastrak for each 10° sector at different soil depths and distances from the trunk of each olive tree. These results indicated that the Root Detector revealed the root architecture within 30 cm of soil depth and 120 cm of distance from the trunk, confirming the findings of Rinn39 and Buza and Goncz50. For example, by qualitative assessment, Rinn39 suggested that the higher the sonic speed, the shallower and larger the roots, while Buza and Divos40 reported that when a root is nearby (closer than 10 cm), the sonic travel time decreases significantly. Indeed, as observed in this study, the clear detection of the root architecture of Tree11 was possible because it was characterized by a shallower root architecture than Tree09, which conversely deepened its root axes in the soil, as revealed by the Fastrak method (Fig. 6).
The second question addressed by this work was to identify the minimum root diameter revealed by Root Detector and whether root diameter or biomass density was better detected. Both Rinn39 and Divos and Buza40 suggested that the Root Detector resolution is 3 cm in diameter, but these authors used a qualitative assessment after the excavation. The results from this study suggested that the Root Detector detected the root biomass density more efficiently than the root diameter. In wood, sonic waves travel through the wood grains and vary with grain angle, including grain angles due to knots/laterals and spiral grain. In particular, the value of the longitudinal component of the sonic wave is 20-fold higher than that of the radial wave51,52, i.e., the greater the longitudinal component, the higher the speed. Moreover, the speed may increase with increasing tissue density (g dry biomass cm−3) and decreasing moisture content (52 and references therein). All these characteristics of
0–40 cm 0–80 cm 0–120 cm Tree09 D30 0.211NS −0.189NS −0.378* D60 −0.003NS −0.143NS −0.181NS D90 −0.057NS −0.070NS −0.110NS Tree11 D30 −0.195NS 0.376* 0.325NS D60 −0.191NS 0.302NS 0.051NS D90 −0.215NS 0.303NS −0.009NS
Table 3. Correlation coefficient (r) and P values of the correlation analysis (Pearson test) between the sonic
speed and root diameter revealed by Root Detector and Fastrak, respectively, in two olive trees at different distance from trunk (0–40, 0–80 and 0–120 cm) and soil depth (D30, D60, D90). P values: *P < 0.05; **P < 0.01; ***P < 0.001; NS not significant.
wood properties make tissue density more important for sonic wave propagation than diameter, as tissue density may remain constant with changing diameters. The lack of correlation with the diameter makes the minimum diameter impossible to identify or obtain without allometric calculations. Furthermore, at greater distances from the trunk, the increased soil volume within which the root axes were located diminished the root biomass density, causing a reduction in the sonic speed. The markedly lower magnitude of the radial component of the sonic wave further explains the limited detection of the deeper roots.
The third question is related to the ability of the Root Detector to determine the root radial distribution of the tree roots. Correlation analysis (Table 2) suggested that the Root Detector permits us to reveal the radial direction of the olive roots as long as they are located within 30 cm of soil depth and 120 cm of distance from the trunk.
In conclusion, these outcomes clearly showed that the Root Detector detected olive roots in the soil environ-ment, but only under certain conditions. First, the shallower (within 30 cm of soil depth) the root axis deploy-ment, the better the resolution of the Root Detector. Moreover, the detection of the roots was independent of the distance from the trunk (40, 80 and 120 cm) as long as the roots were located within 30 cm of soil depth, although the sonic speed diminished with these distances. In addition to the simple presence of roots in the soil, this study also noted that Root Detector technology fails to detect the root size of olive trees in terms of geometric parame-ters such as root diameter.
Overall, this non-destructive technique could be useful in forestry and ecology for evaluating the safety factor for uprooting the root system of individual trees, as shown by Rinn39 and Buza and Divòs40, and it could also be applied to urban trees for the safety of citizens and civil buildings. Indeed, despite the aforementioned limitations, the detection of surface horizontal roots is very important for tree stability, as they increase the turning moment for uprooting and root-soil plate rigidity by increasing the radial distance of the root-soil plate hinge53. Anchorage strength measurements on 18–40 cm DBH and 12–27 m height conifer trees54 and both conifer and dicot temper-ate trees of on average 46 cm mean DBH and 33 m height55 revealed the occurrence of the hinge (or rotation) axis within 1 m from the trunk base despite a root-soil plate with a surface radius of 1.0–1.6 m. Such a hinge distance falls within the range investigated in this study (up to 1.2 m) despite the smaller dimension of the selected olive trees. Therefore, although limited to two sampled trees, the selected distances and the clearly different root archi-tectures investigated may be considered a valid trial for assessing the contribution of surface structural roots to the safety evaluations. Undoubtedly, the expanded use of this technology for various tree species with different root system architecture patterns would benefit from continued efforts at validation.
Data availability
The datasets generated during and/or analysed during the current study are available from the corresponding author on reasonable request.
Received: 6 October 2019; Accepted: 27 April 2020; Published: xx xx xxxx
References
1. Lynch, J. P. Steep, cheap and deep: an ideotype to optimize water and N acquisition by maize root systems. Ann. Bot 112, 347–357 (2013).
2. Sorgonà, A., Abenavoli, M. R. & Cacco, G. A comparative study between two citrus rootstocks: effect of nitrate on the root morpho-topology and net nitrate uptake. Plant Soil 270, 257–267 (2005).
3. Dupuy, L. X., Fourcaud, T., Lac, P. & Stokes, A. A generic 3D finite element model of tree anchorage integrating soil mechanics and real root system architecture. Am. J Bot. 94, 1506–1514 (2007).
4. Coutts, M. P., Nielsen, C. C. N. & Nicoll, B. C. The development of symmetry, rigidity and anchorage in the structural root system of conifers. Plant Soil 217, 1–15 (1999).
5. Dupuy, L. X., Fourcaud, T. & Stokes, A. A numerical investigation into the influence of soil type and root architecture on tree anchorage. Plant Soil. 278, 119–134 (2005).
6. Fourcaud, T., Ji, J. N., Zhang, Z. Q. & Stokes, A. Understanding the impact of root morphology on overturning mechanisms: a modelling approach. Ann. Bot. 101, 1267–1280 (2008).
7. Lundstrom, T., Jonas, T., Stoeckli, V. & Ammann, W. Anchorage of mature conifers: resistive turning moment, root–soil plate geometry and root growth orientation. Tree Physiol. 27, 1217–1227 (2007).
8. Nicoll, B. C., Gardiner, B. A. & Peace, A. J. Improvements in anchorage provided by the acclimation of forest trees to wind stress.
Forestry. 81, 389–398 (2008).
9. Tamasi, E. et al. Influence of wind loading on root system development and architecture in oak (Quercus robur L.) seedlings. Trees
19, 374–384 (2005).
10. IPCC. Climate change 2013: the physical science basis. Contribution of working group I to the fifth assessment report of the Intergovernmental Panel on Climate Change. (Cambridge University Press, 2013).
11. IPCC. Climate change 2014: impacts, adaptation, and vulnerability. Part A: global and sectoral aspects. Contribution of working group II to the fifth assessment report of the Intergovernmental Panel on Climate Change. (Cambridge University Press, 2014). 12. IPCC. Climate change 2014: synthesis report. Contribution of working groups I, II and III to the fifth assessment report of the
Intergovernmental Panel on Climate Change. 151 (Geneva, 2014).
13. Gandhi, K. et al. Catastrophic windstorm and fuel-reduction treatments alter ground beetle (Coleoptera:Carabidae) assemblages in a North American sub-boreal forest. For. Ecol. Manag 256, 1104–1123 (2008).
14. McCarthy, J. K. et al. Predicting sapstain and degrade in fallen trees following storm damage in a Pinus radiate forest. For. Ecol.
Manag 260, 1456–1466 (2010).
15. Terho, M. & Hallaksela, A. M. Decay characteristics of hazardous Tilia, Betula, and Acer trees felled by municipal urban tree managers in the Helsinki City Area. Forestry. 81, 151–159 (2008).
16. Cermak, J., Hruska, J., Martinkova, M. & Prax, A. Urban tree root systems and their survival near houses analyzed using ground penetrating radar and sap flow techniques. Plant Soil 219, 103–116 (2000).
17. Danjon, F., Sinoquet, H., Godin, C., Colin, F. & Drexhage, M. Characterisation of structural tree root architecture using 3D digitising and AMAPmod software. Plant Soil 211, 241–258 (1999).
18. Di Iorio, A., Lasserre, B., Scippa, G. S. & Chiatante, D. Root system architecture of Quercus pubescens trees growing on different sloping conditions. Ann. Bot. 95, 351–361 (2005).
19. Watanabe, T. et al. Rice morphogenesis and plant architecture: measurement, specification and the reconstruction of structural development by 3D architectural modeling. Ann Bot 95, 1131–1143 (2005).
20. Di Iorio, A., Lasserre, B., Scippa, G. S. & Chiatante, D. Pattern of secondary thickening in a Quercus cerris root system. Tree Physiol.
27, 407–412 (2007).
21. Valdés-Rodríguez, O. A., Sánchez-Sánchez, O., Pérez-Vázquez, A., Caplan, J. S. & Danjon, F. Jatropha curcas L. root structure and growth in diverse soils. Sci. World. J. 2013, 827295, https://doi.org/10.1155/2013/827295 (2013).
22. Di Iorio, A., Lasserre, B., Petrozzi, L., Scippa, G. S. & Chiatante, D. Adaptive longitudinal growth of first-order lateral roots of a woody species (Spartium junceum) to slope and different soil conditions—upward growth of surface roots. Environ Exp Bot 63, 207–215 (2008).
23. Wu, J., Pagès, L., Wu, Q., Yang, B. & Guo, Y. Three-dimensional architecture of axile roots of field-grown maize. Plant Soil. 387, 363–377 (2015).
24. Sorgonà, A., Proto, A. R., Abenavoli, L. & Di Iorio, A. Spatial distribution of coarse root biomass and carbon in a high-density olive orchard: effects of mechanical harvesting methods. Trees 32, 919–931 (2018).
25. Godin, C., Costes, E. & Sinoquet, H. Plant architecture modelling: virtual plants and complex systems in Plant architecture and its
manipulation (ed. Turnbull, C.G.N.) 238–287 (Blackwell, 2005).
26. van der Heijden, G.W.A.M., de Visser, P.H.B. & Heuvelink, E. Measurements for functional structural plant models in
Functional-structural plant modeling in crop production (eds. Vos, J., Marcelis, L.F.M., de Visser, P.H.B., Struik, P.C., Evers, J.B.) 13–25 (Springer
Berlin, 2007).
27. Mairhofer, S. et al. RooTrak: automated recovery of three-dimensional plant root architecture in soil from x-ray microcomputed tomography images using visual tracking. Plant Physiol. 158, 561–569 (2012).
28. Gao, W., Schlüter, S., Blaser, S. R. G. A., Jianbo Shen, J. & Vetterlein, D. A shape-based method for automatic and rapid segmentation of roots in soil from X-ray computed tomography images: Rootine. Plant Soil. 441, 643–655 (2019).
29. Maenhout, P. et al. Semi-Automated Segmentation and Visualization of Complex Undisturbed Root Systems with X-Ray μCT. Soil
& Tillage Res 192, 59–65 (2019).
30. Corona-Lopez, D. D. J., Sommer, S., Rolfe, S. A., Podd, F. & Grieve, B. D. Electrical impedance tomography as a tool for phenotyping plant roots. Plant Methods. 15, 49, https://doi.org/10.1186/s13007-019-0438-4 (2019).
31. Rossi, R. et al. Electrical resistivity tomography as a non-destructive method for mapping root biomass in an orchard. Eur. J. Soil Sci
62(2), 206–215 (2011).
32. Zhou, X.C. & Luo, X.W. Advances in non-destructive measurement and 3D visualization methods for plant root based on machine vision in Proceedings of the 2nd International Conference on BioMedical Engineering and Informatics. 1–5. (Tianjin, BMEI’09, 2009). 33. Jahnke, S. et al. Combined MRI–PET dissects dynamic changes in plant structures and functions. Plant J 59, 634–644 (2009). 34. Hagrey, S. A. Geophysical imaging of root-zone, trunk, and moisture heterogeneity. J. Exp. Bot 58, 839–854 (2007).
35. Fang, S., Yan, X. & Liao, H. 3D reconstruction and dynamic modeling of root architecture in situ and its application to crop phosphorus research. Plant J 60, 1096–1108 (2009).
36. Doi, K. Diagnostic imaging over the last 50 years: research and development in medical imaging science and technology. Phys. Med.
Biol. 51, 5–27 (2006).
37. Butnor, J. R., Doolittle, J. A., Kress, L., Cohen, S. & Johnsen, K. H. Use of ground-penetrating radar to study tree roots in the southeastern United States. Tree Physiol. 21, 1269–1278 (2001).
38. Krainyukov, A. & Lyaksa, I. Detection of tree roots in an urban area with the use of ground penetrating radar. Transport and
Telecommunication 17(4), 362–370 (2016).
39. Rinn, F. Tree root plate assessment by sounding. Western Arborist. Fall 2016, 26–29 (2016).
40. Buza, A. K. & Divos, R. Root Stability Evaluation with Non-Destructive Techniques. Acta Silv. Lign. Hung 12, 125–164 (2016). 41. Montagnoli, A. et al. Ongoing modifications to root system architecture of Pinus ponderosa growing on a sloped site revealed by
tree-ring analysis. Dendrochronologia 58, 125650 (2019).
42. Rinn, F. Central Basics of Sonic Tree Tomography. J Soc Comm Arb 19, 8–10 (2014). 43. Rinn, F. Central defects in sonic tomography. Western Arborist. Spring 2015, 38–41 (2015). 44. Fisher, N.I. Statistical analysis of circular data (Cambridge University Press, 1993). 45. Mardia, K.V. & Jupp, P.E. Directional statistics (Wiley, 2000).
46. Kovach, W.L. Oriana for windows, ver. 2.01 (Kovach Computing Services, 1994).
47. Albers, B. Analysis of the propagation of sound waves in partially saturated soils by means of a macroscopic linear poroelastic model.
Trans. Porous Media. 80, 173–192 (2009).
48. Wei, C. & Muraleetharan, K. K. A continuum theory of porous media saturated by multiple immiscible fluids: I. Linear poroelasticity.
Int. J Eng. Sci. 40, 1807–1833 (2002).
49. Oelze, M. L., O’Brien, W. D. & Darmody, R. G. Measurement of attenuation and speed of sound in soils. Soil Sci. Soc. Am. J 66, 788–796 (2002).
50. Buza, A. K. & Göncz, B. Comparison of trees and NDT methods. Wood Research. 60, 45–58 (2015).
51. Harris, P. & Andrews, M. Emerging technologies for evaluating wood quality for processing. 3rd Wood quality symposium in Rotorua
(1999).
52. Legg, M. & Bradley, S. Measurement of stiffness of standing trees and felled logs using acoustics: a review. J Acoust Soc Am 139, 588–604 (2016).
53. Coutts, M. P. Developmental processes in tree root systems. Can. J. For. Res 17, 761–767 (1987). 54. Achim, A. & Nicoll, B. C. Modelling the anchorage of shallow-rooted trees. Forestry. 82, 273–284 (2009).
55. Lundström, T., Jonas, T., Stöckli, V. & Ammann, W. Anchorage of mature conifers: resistive turning moment, root-soil plate geometry and root growth orientation. Tree Physiol. 27, 1217–1227 (2007).
Acknowledgements
The authors are grateful to the Chiaravalloti family for making their farm available and for their warm hospitality. The authors also thank De Rossi A., Bartolo P., and Papandrea S. for their very useful work. Research was supported by Grants from Regione Calabria, project PSR 2007–2013-Misura 124 “Sistemi innovativi per la qualità della filiera dell’olio extravergine di oliva-SIFOLIO”.
Author contributions
A.P. conceived the study and contributed to the experimental work on Root detector, data processing and writing the manuscript. A.D.I and A.S. carried out the experimental setup and work on 3D root digitalization by Fastrak, data processing and writing the manuscript. L.M.A. contributed to the experimental setup and work on Root detector and Critical revision of the text. All authors read and approved the final manuscript.
Competing interests
The authors declare no competing financial and non-financial interests. In particular, the Authors declare no potential conflict of interest with Fakopp Enterprise Bt (Hungary).
Additional information
Supplementary information is available for this paper at https://doi.org/10.1038/s41598-020-65047-4.
Correspondence and requests for materials should be addressed to A.D.I. Reprints and permissions information is available at www.nature.com/reprints.
Publisher’s note Springer Nature remains neutral with regard to jurisdictional claims in published maps and
institutional affiliations.
Open Access This article is licensed under a Creative Commons Attribution 4.0 International
License, which permits use, sharing, adaptation, distribution and reproduction in any medium or format, as long as you give appropriate credit to the original author(s) and the source, provide a link to the Cre-ative Commons license, and indicate if changes were made. The images or other third party material in this article are included in the article’s Creative Commons license, unless indicated otherwise in a credit line to the material. If material is not included in the article’s Creative Commons license and your intended use is not per-mitted by statutory regulation or exceeds the perper-mitted use, you will need to obtain permission directly from the copyright holder. To view a copy of this license, visit http://creativecommons.org/licenses/by/4.0/.
Scientific Reports
A sonic root detector for revealing tree coarse root distribution
Andrea R. Proto, Antonino Di Iorio *, Lorenzo M. Abenavoli, Agostino Sorgonà
*corresponding author; [email protected]
Fig. S1 The root detector components, work procedure and output.
a) The transmitter (SD02, piezo sensor) and the receiver (soil sensor, a high frequency geophone); b) the control unit
(ArborSonic 3D); c) the spikes of the transmitter and receiver inserted in the tree collar (the tapping point) and the soil,
respectively (blue circles), the distance from trunk marked using lines on the ground (arrow in blue colour) and the tablet
with the ArborSonic software package (arrow in red colour); d) the loose rope knotted around the tree. The rope will help
you keep constant distance between the tree and soil sensor; e) The hit on the transmitter sensor; f) graphical output
Fig. S2 a) Freeing of olive tree root system from soil
using high-pressure air lances (Air-SPADE 2000,
Chicopee, MA, USA); b) the 3D digitizer (3 SPACE
Fastrak, Polhemus) constituted by the electronic
unit, the magnetic transmitter (Long Ranger), and
the small hand-held receiver.
Long Ranger Transmitter
Electronic Unit
Receiver
Root digitizing operation
Z+ 40 cm
80 cm 120 cm
Bark surface
30
c
all first-to-third-order lateral roots were
virtually sliced, and their volume determined.
Root system image was obtained from
digitizing with AMAPmod software. Lateral
view showing the virtual soil boxes 30 cm
thick and 40 cm wide stacked to 90 cm depth
and 120 cm distance.
D = 40 cm
Tree11
D = 80 cm
D = 120 cm
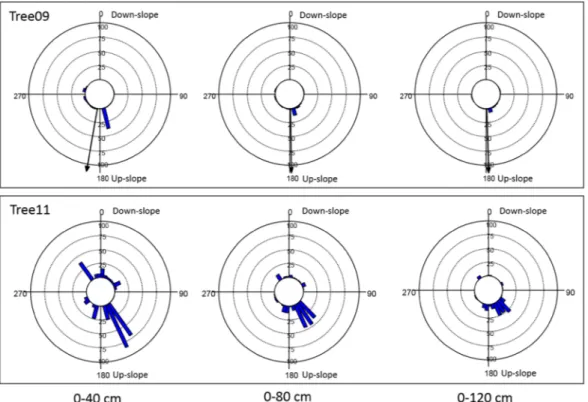
Fig. S4 Graphical visualization
of
the
Root
Detector
Evaluation Software (Fakopp
Enterprise Bt, Hungary) for
Olea europea trees (Tree09
and
Tree11)
at
different
distance from the bark surface
(40, 80 and 120 cm). Grey
levels refer to the sonic speed,
i.e. the darker the level the
higher
the
speed.
Lines
highlight directions from the
hypothetical center of the
trunk to the points whose
speed values are higher than
the mean value of the
measured range (min+max)/2
0 40 80 120 0 40 80 0 40 80 120 0 40 80 120 40 50 60 70 80 90 100 110 120 130 140 150 160 170 180 190 200 210 220 230 240 250 260 270 280 290 300 310 320 0 40 80 120 0 40 80 0 40 80 120 0 40 80 120 40 50 60 70 80 90 100 110 120 130 140 150 160 170 180 190 200 210 220 230 240 250 260 270 280 290 300 310 320 0 40 80 120 0 40 80 0 40 80 120 0 40 80 120 40 50 60 70 80 90 100 110 120 130 140 150 160 170 180 190 200 210 220 230 240 250 260 270 280 290 300 310 320 0 40 80 120 0 40 80 120 0 40 80 120 0 40 80 120 0 10 20 30 40 50 60 70 80 90 100 110 120 130 140 150 160 170 180 190 200 210 220 230 240 250 260 270 280 290 300 310 320 330 340 350 0 40 80 120 0 40 80 120 0 40 80 120 0 40 80 120 0 10 20 30 40 50 60 70 80 90 100 110 120 130 140 150 160 170 180 190 200 210 220 230 240 250 260 270 280 290 300 310 320 330 340 350 0 40 80 120 0 40 80 120 0 40 80 120 0 40 80 120 0 10 20 30 40 50 60 70 80 90 100 110 120 130 140 150 160 170 180 190 200 210 220 230 240 250 260 270 280 290 300 310 320 330 340 350
Fig. S5 Sonic speed (m s
-1
) (black
line) measured by Root Detector
and root biomass density (kg m
-3
)
(red line) measured by Fastrak to
30 cm soil depth at different
distances from the trunk (40, 80
and 120 cm) and in 36 sectors 10
degree wide for the two studied
Olea europea trees. The data are
normalized to the respective
maximum value.
Tree 11
0 40 80 120 0 40 80 120 0 40 80 120 0 40 80 120 20 30 40 50 60 70 80 90 100 110 120 130 140 150 160 170 180 190 200 210 220 230 240 250 260 270 280 290 300 310 320 330 340 0 40 80 120 0 40 80 120 0 40 80 120 0 40 80 120 20 30 40 50 60 70 80 90 100 110 120 130 140 150 160 170 180 190 200 210 220 230 240 250 260 270 280 290 300 310 320 330 340 0 40 80 120 0 40 80 120 0 40 80 120 0 40 80 120 20 30 40 50 60 70 80 90 100 110 120 130 140 150 160 170 180 190 200 210 220 230 240 250 260 270 280 290 300 310 320 330 340 0 40 80 120 0 40 80 120 0 40 80 120 0 40 80 120 0 10 20 30 40 50 60 70 80 90 100 110 120 130 140 150 160 170 180 190 200 210 220 230 240 250 260 270 280 290 300 310 320 330 340 350 0 40 80 120 0 40 80 120 0 40 80 120 0 40 80 120 0 10 20 30 40 50 60 70 80 90 100 110 120 130 140 150 160 170 180 190 200 210 220 230 240 250 260 270 280 290 300 310 320 330 340 350 0 40 80 120 0 40 80 120 0 40 80 120 0 40 80 120 0 10 20 30 40 50 60 70 80 90 100 110 120 130 140 150 160 170 180 190 200 210 220 230 240 250 260 270 280 290 300 310 320 330 340 350