1052
AJCS 10(7):1052-1060 (2016) ISSN:1835-2707 DOI: 10.21475/ajcs.2016.10.07.p7810
Productive, qualitative and seed image analysis traits of guar (Cyamopsis tetragonoloba L.
Taub.)
Fabio Gresta
1, Carmelo Santonoceto
1, Giuseppe Ceravolo
1, Cristina Formantici
2, Oscar Grillo
3*,
Concetta Ravalli
3, Gianfranco Venora
31Dipartimento di Agraria, Università Mediterranea di Reggio Calabria, Loc. Feo di Vito, 89122 – Reggio Calabria, Italy
2
Laboratory of Biotechnology Lamberti spa, Via Piave 18, 21041 Albizzate (VA), Italy
3Stazione Sperimentale di Granicoltura per la Sicilia, Via Sirio 1, 95041 Borgo Santo Pietro, Fraz. Caltagirone, Italy
*Corresponding author: [email protected] Abstract
Due to the high content of galactomannans extractable from the endosperm, guar or cluster bean (Cyamopsis tetragonoloba (L.) Taub), is always more frequently cultivated as a grain crop. Guar galactomannans are a source of hydrocolloid able to form a thick solution even in cold water in low concentrations. For this reason, in the last few years the demand for guar gum has greatly increased both for the food and the oil industry. Guar seed accessions identification is quite difficult, since American and Indian varieties and unlabelled genotypes show similar phenotypic seed traits, but very different agronomic value. Eight guar accessions with different origins have been cultivated in a Mediterranean environment and grain yield and galactomannans enzymatic determination have been carried out. The data of 137 morpho-colorimetric quantitative variables were measured, on each seed, by image analysis techniques and analysed applying a stepwise Linear Discriminant Analysis. This procedure allowed us to implement an identification grading system able to discriminate among varieties, with an overall performance of 92.2%. With this work it has been proved that an objective, repeatable and non-destructive method, based on seed phenotypic characterization can be effectively applied also to identify and discriminate C. tetragonoloba accessions. Moreover, for the first time, many strong and positive correlations were found between the galactomannans content and the size descriptive variables measured on seeds, allowing an easy procedure for the determination and comparison of seed galactomannans content. This procedure could become a useful tool for researchers and stakeholders.
Keywords: Computer vision; Grain yield, Galactomannans content; Morphometric and colorimetric characterization; Varietal
identification.
Introduction
Guar, Cyamopsis tetragonoloba (L.) Taub, is a drought-tolerant summer annual legume. It probably originated and developed in Indo-Pakistan areas (Whistler and Hymowitz, 1979), where it is still cultivated producing 95% of total world production. The remaining 5% is grown in the USA and South Africa (Undersander et al., 2006).
Guar, or cluster bean, has an indeterminate growth and can have single stem, fine branching, or basal branching depending on the variety. Branching varieties are generally less appreciated since a greater loss of grain is suffered during combine harvesting. Guar requires a hot climate and grows under a wide range of soils, even if it thrives in sandy soil. Clayey soils are adequate only if well drained. Like other legumes, it can profitably rotate with other crops such as cotton, sorghum, wheat, etc., since it is considered an excellent soil improvement crop (Whistler and Hymowitz, 1979; Rao et al., 1995). Moreover, it has been demonstrated that it can be cultivated as a low input crop (Gresta et al., 2014) and its cultivation can be spread in Mediterranean areas (Sortino and Gresta, 2007; Gresta et al., 2013; Gresta et al., 2016).
Guar is mainly cultivated as a grain crop: its seed consists of embryo (40-45%), seed coat (14-16%) and a large endosperm accounting for 38-45% of the total seed. This last is composed for the most part by galactomannans (a backbone of mannose units with branching galactose units with a 2:1 ratio) and to a minor extent by proteins and other non-polymer carbohydrates. Guar galactomannans are a source of hydrocolloid able to form a thick solution. For this reason it is considered a multipurpose material, used as thickener, stabiliser, and strengthener in a wide range of activities such as paper manufacture, printing, pharmaceuticals, textiles, cosmetics, food, and oil extraction industry (Mudgill et al., 2014). In fact, it shows exceptionally high viscosity even in low concentrations and, unlike other gums, can be used in cold water with a great saving of energy. Recent researches have also been focused on the measurement of the exact mannose to galactose ratio, in order to elucidate the variation in the physical and chemical properties (Liyanage et al., 2015). In the last few years the demand for guar gum has greatly increased both for the food and, above all, the oil industry.
1053
Nevertheless, currently guar is considered a minor industrial crop: it has received much less attention from the international research community compared, for example, to soybean, which was greatly improved in yield and seed quality through hybridization, selection and genetic engineering.
The commercial market of seeds is quite confused: in the USA, several varieties have been selected from the late 1960s (Brooks, Mills, Hall, Kinman, Esser, Lewis, Santa Cruz, Matador, Monument). In India many selected varieties exist (Pusa Navbahar, Pusa Mausami, Pusa Sadabahar, FS-277, HG-series, RGC-series, etc.), as well as in Pakistan (BR 90, BR 99, S-4002, etc.), but there are also many unregistered genotypes which show a very low homogeneity and not always high agronomic traits (Manivannan et al., 2016). Generally, varietal identification is done following official protocols, based on morphological and physiological characters. However, in the last two decades, a significant increase in image analysis applications has been highlighted in the plant biology research field and automatized systems have the potential to replace human visual assessments. This has stimulated research in many areas, including the agronomic field (Shahin and Symons, 2003a; Venora et al., 2009; Grillo et al., 2011; Smykalova et al., 2011, 2013; Orrù et al., 2012, 2015; Lo Bianco et al., 2015a).
Until recently, the dimensional measurements of length and width of seeds have been made manually, generally by calipers, with fixed categories officially recognized (Stearn, 1980; Werker, 1997), and used to describe contour shapes. In recent works many authors agree on the importance of the biometric features in taxonomic studies to characterize and identify spontaneous plant species and cultivated varieties by technologies like computer vision that allow us to measure morphometric and colorimetric parameters in a very accurate and reliable way (Rovner and Gyulai, 2007; Kilic et al., 2007; Grillo et al., 2010, 2012, 2013; Bacchetta et al., 2011; Fawzi, 2011; Herridge et al., 2011; Pinna et al., 2014; Santo et al., 2014). Currently, to our knowledge, no studies have been conducted on the application of image analysis techniques on guar, and the first and only attempt to associate seed-coat colour with seed traits was carried out by Liu et al. (2007). The authors differentiated between black and white seeds, obtaining a better germination in black seeds and no significative difference in relation to the endosperm quantity, although black seeds are considered of lower quality for gum extraction (Bhatia et al., 1979; Undersander et al., 2006). Anyway, blackening of guar seed arises commonly after late summer rains and cannot be taken into consideration as discriminanting factors. With the idea of reaching this goal, other seed traits should be considered. The aim of the present work is to adopt the image data analysis as a rapid and effective tool for distinguishing guar accessions and identifying seed morphological traits associated with the galactomannans content.
Results and Discussion
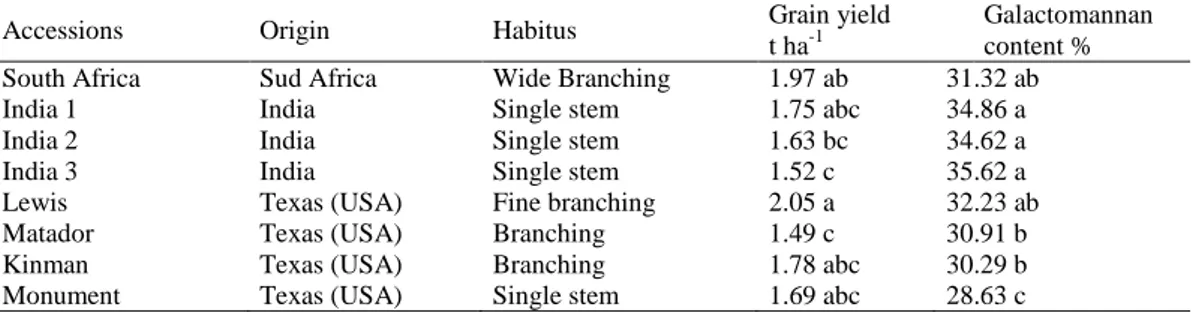
Agronomic perspective and galactomannan content A first result was obtained with the identification of branching and non-branching varieties (Table 1). Indian varieties and Monument were characterized by a single stem growth, while South Africa, Matador and to a lesser extend Kinman, by a branching habitus. Lewis shows few lateral branches, much less compared to the branching varieties. The highest grain yield was obtained by Lewis, South Africa, Kinman, India1 and Monument with an average value of 1.85
t ha-1 (range from 2.05 t ha-1 of Lewis and 1.69 t ha-1of Monument). Lower values were recorded by India2, India3 and Matador (1.55 t ha-1, on average). The relatively low sowing density adopted (20 plants m-2) partially favoured the branching varieties. Probably a higher sowing density would have favoured the single stem varieties. Undersander et al. (1991) in a trial carried out in Texas on five American varieties found that Lewis was the most productive. On the other hand, Sortino and Gresta (2007) found no difference between five American varieties including Lewis and Kinman, with an average yield of 2.4 t ha-1. Higher yields (3-4 t ha-1) were obtained in Australia by Beech et al. (1989) testing some other American varieties.
The highest galactomannan content has been determined on Indian varieties with values over 34%, followed by Lewis, South Africa, Kinman and Matador with values over 30% (Table 1). Monument showed the lowest galactomannan content (28.6%). These data are in agreement with those obtained by Gresta et al. (2013) in a similar environment (30.2% for Kinman and 28.8% for Lewis) and by Kumar and Singh (2002).
Seed morpho-colorimetric comparison
Data obtained by measuring the 137 quantitative variables describing seed size, shape and colour features, were analysed by stepwise LDA. Statistical classifiers were developed in order to study the varietal variability of C.
tetragonoloba. From the comparisons of the analyzed seed
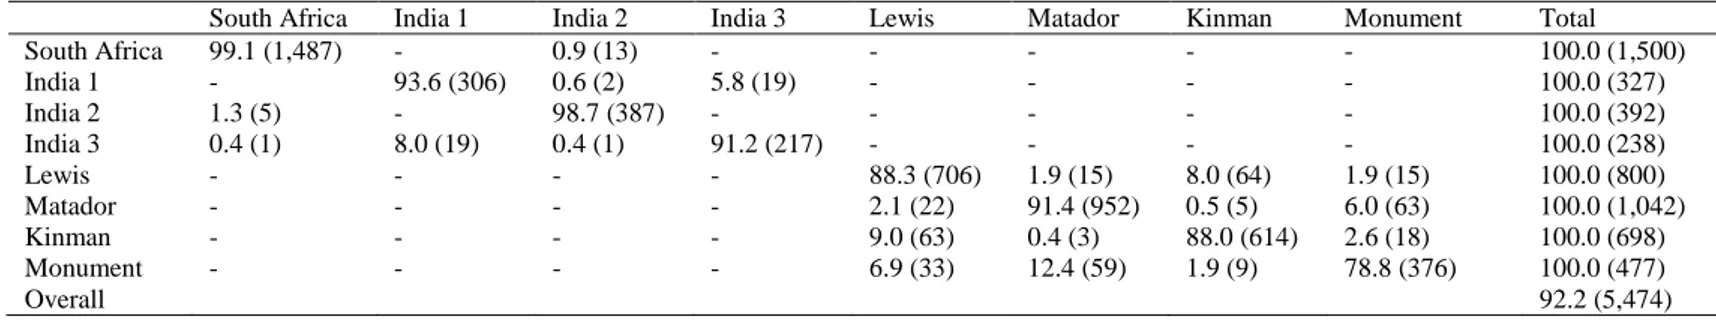
guar varieties, a very high discrimination performance was achieved, reaching an overall percentage correct identification of 92.2% (Table 2; Figure 1). Correct identification performance of between 78.8% (Monument) and 99.1% (South Africa) was obtained. Main misattributions were identified between the varieties Monument and Matador, where 12.4% and 6.0% of seeds, respectively, were mixed one with the other. Other misidentification percentages were highlighted between the two other varieties from the USA, Lewis and Kinman, for which 8.0% and 9.0% of the cases were respectively misclassified; and for the varieties India 1 and India 3, where 5.8% and 8.0% of the seeds, respectively were mixed one with the other (Table 2; Figure 1). Although the great number of statistical cases makes the graphical representation a bit confused, in figure 1 is possible to graphically note the varietal agglomerations produced by the varieties India 1, India 2 and India 3, and by the four varieties from the USA (Kinman, Lewis, Matador and Monument) (Figure 1A). To better highlight the similarities between the groups, only the centroids of each group are reported in figure 1B. From the plot 1A it is possible to note a small agglomeration produced by the varieties India 2 and South Africa, but as showed by the identification percentages reported in table 1, although the seeds of these two varieties are very similar, they are significantly different from each other. The histogram of the standardized residuals (Figure 1C), the normal probability plot (Figure 1D) and the dispersion plot of the standardized residuals (Figure 1E) were also included to better understand the normal distribution of the data. To evaluate the inter-varietal morpho-colorimetric variability of C. tetragonoloba, the Mahalanobis’ square
distance values, among the discriminanting functions
achieved by the LDA and used to distinguish the analysed seed groups, were used to highlight the spatial dispersion between the compared varieties. Figure 2 shows the graphical representation of the variability of the data points for the analysed species
1054
Table 1. Main traits and grain yield (t ha-1) of the studied guar accessions.
Accessions Origin Habitus Grain yield
t ha-1
Galactomannan content %
South Africa Sud Africa Wide Branching 1.97 ab 31.32 ab
India 1 India Single stem 1.75 abc 34.86 a
India 2 India Single stem 1.63 bc 34.62 a
India 3 India Single stem 1.52 c 35.62 a
Lewis Texas (USA) Fine branching 2.05 a 32.23 ab
Matador Texas (USA) Branching 1.49 c 30.91 b
Kinman Texas (USA) Branching 1.78 abc 30.29 b
Monument Texas (USA) Single stem 1.69 abc 28.63 c
Fig 1. Graphical representation of the discriminant scores (A) and centroids of group (B) of the nine studied varieties of guar.
Histograms of the standardized residuals (C); Normal Probability Plot (P-P) tested with the Kolmogorov-Smirnov’s test (D); Dispersion plot of the standardized residuals tested with the Levene’s test (E). Different colours were used to graphically distinguish different varietal groups.
distinguished for variety. Variability changed between varieties with Mahalanobis’ square distance values, ranging from 5.391 (Lewis) and 86.113 (India 2). The most variable population was India 3, with Mahalanobis’ square distance values ranging from 11.657 to 77.110, followed by the two other Indian accessions (India 1 and India 2), while the four accessions from the USA showed the lowest variability (data not shown). These results perfectly fit with the achievement of Manivannan et al. (2016). The phenotypic variability of the four studied unregistered genotypes (South Africa, India
1, India 2 and India 3) reflects their wide genetic variability. On the other hand, the other four studied varieties (Matador, Lewis, Kinman and Monument) - undoubtedly stronger from the genetic point of view, being varieties - prove to have a lower inter- and intra-varietal phenotypic variability. A highly significant correlation between the populations and the seed morpho-colorimetric variability was found (R2 = 0.942 and P < 0.001). In the evaluation of the parameters that most influenced the discrimination process of the studied guar varieties - except for the mean seed weight which was significantly
1055
Table 2. Percentages identification among the analysed varietal groups. Percentages refer to the classification performance; in bold, the percentages of correct classification; in parentheses, the
number of analysed seeds.
South Africa India 1 India 2 India 3 Lewis Matador Kinman Monument Total
South Africa 99.1 (1,487) - 0.9 (13) - - - 100.0 (1,500) India 1 - 93.6 (306) 0.6 (2) 5.8 (19) - - - - 100.0 (327) India 2 1.3 (5) - 98.7 (387) - - - 100.0 (392) India 3 0.4 (1) 8.0 (19) 0.4 (1) 91.2 (217) - - - - 100.0 (238) Lewis - - - - 88.3 (706) 1.9 (15) 8.0 (64) 1.9 (15) 100.0 (800) Matador - - - - 2.1 (22) 91.4 (952) 0.5 (5) 6.0 (63) 100.0 (1,042) Kinman - - - - 9.0 (63) 0.4 (3) 88.0 (614) 2.6 (18) 100.0 (698) Monument - - - - 6.9 (33) 12.4 (59) 1.9 (9) 78.8 (376) 100.0 (477) Overall 92.2 (5,474)
Fig 2. Spatial dispersion of varietal data highlighted by Mahalanobis’ square distance for each guar variety in comparison with the others. Dots represent 5th and 95th percentile outliers. P <
1056
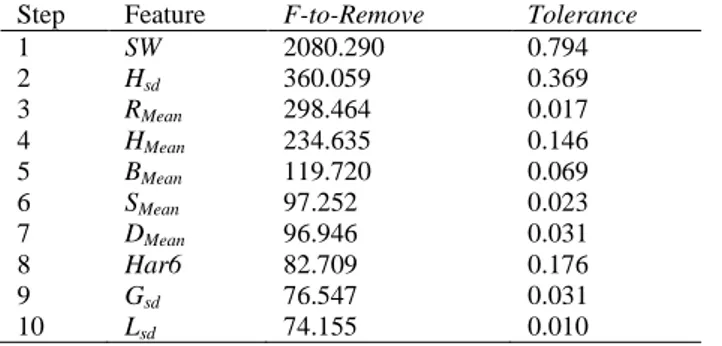
Table 3. The best ten key parameters of correct classifications. The number of steps, feature name (according to the Supplemental
Table S2), F-to-remove and the Tolerance values are reported.
Step Feature F-to-Remove Tolerance
1 SW 2080.290 0.794 2 Hsd 360.059 0.369 3 RMean 298.464 0.017 4 HMean 234.635 0.146 5 BMean 119.720 0.069 6 SMean 97.252 0.023 7 DMean 96.946 0.031 8 Har6 82.709 0.176 9 Gsd 76.547 0.031 10 Lsd 74.155 0.010
Table 4. Correlations among galactomannan content and seed morphological traits.
SW A Dmax Dmin Dmin /Dmax P Pconv EAmax EAmin Galactomannan
content
0.82 0.877 0.862 0.82 -0.891 0.877 0.878 0.894 0.846 0.0126 0.00423 0.00589 0.0127 0.00294 0.00422 0.00418 0.00275 0.00815 According to the Supplemental Table S2, SW=Mean seed weight; A=Seed area; Dmax=Maximum diameter of the seed; Dmin=Minimum diameter of the seed; Dmin
/Dmax=Ratio between minimum and maximum diameters; P=Seed perimeter; Pconv= Convex perimeter of the seed; EAmax= Maximum axis of an ellipse with equivalent
area; EAmin= Minimum axis of an ellipse with equivalent area.
the most powerful character for the varietal identification - the most important variables chosen by the stepwise LDA were related to colour and textural information. In table 3 the best ten variables used by the system are reported. Although the LDA was able to reach a very high percentage of correct identification, the whole discriminant analysis needed 71 over the 137 measured variables to discriminate between the varieties, completing the discrimination process in 73 consecutive steps. Globally, the mean seed weight, 36 densitometric features descriptive of the seed surface colour and textural, eight morphological parameters descriptive of seed size and contour shape, and 26 Elliptic Fourier Descriptors, were statistically selected and used by the LDA (data non shown).
Correlations between galactomannans content and morphological traits
Considering the relation existing between the galactomannans content and the seed endosperm dimension, it was plausible to hypothesize the existence of positive correlations between this polysaccharides category and the size descriptive variables measured on seeds. For this reason, statistical correlations were applied to the galactomannan content and the eight morphological parameters, which describe the seed size, chosen and used by the stepwise LDA to discriminate between the eight guar accessions, also including the seed weight (Table 4). No relationship was determined with seed weight, while strong and positive correlations were determined with the seed area [A] (p<0.005), the maximum diameter [Dmax] (p<0.006) and the
minimum diameter [Dmin] (p<0.01); while, as expected, a
negative correlation was ascertained with the ratio between the two above-mentioned diameters [Dmin/Dmax] (p<0.003). Further positive correlations were determined with the two perimeter descriptors [P and Pconv] (both p<0.005) and the
two ellipse axis parameters [EAmax and EAmin] (p<0.003 and
p<0.009, respectively). As well known, galactomannans content is quite variable in guar seed depending not only on varieties, but also on management techniques (Gresta et al., 2013). The existence of these relationships open new possibilities in determining a reliable galactomannans content with a simple seed image analysis, avoiding expensive and time-consuming laboratory determinations.
Material and methods
Plant material
Eight guar accessions were studied: one from South Africa, three from India (India1, India2 and India3) and four coming from the USA (Kinman, Lewis, Matador and Monument) (Table 1). The four USA accessions were supplied by the Texas Extension Services and were the only registered varieties. Kinman is a semi-coarse branching plant with a medium-late maturity (120-day crop). Lewis has few lateral branches, and a medium-early maturity. Matador has coarse branch, strong main stem, many lateral branches and medium-late maturity; Monument has single stalk with lateral branches and short cycle (90-day crop). No information was available on the South Africa and Indian genotypes.
Field trial
The trial was carried out in 2012 in Gela (Southern Italy, 31° 05’ N, 14° 16’ E) on a well-ploughed clay soil. A randomized block design with three replications was adopted with plots of 20 m2 (5 × 4 m). Sowing was performed on the 2nd of May with a density of 20 plants m-2. Compared to some of the spatial arrangements reported in the literature for guar (Whistler and Hymowitz, 1979; Jakson and Doughton, 1982; Kumar and Singh, 2002), we adopted a lower density since we did not know if the varieties were branching or non-branching. Before sowing, 44 units of N, 108 units of P2O5
and 64 units of K2O were applied. During the trial, 2.480 m3
of water was supplied with a drip system to satisfy the crop water requirement. Since no herbicides are recorded in Europe for guar, weeds were tackled, following what was reported in Avola et al. (2008) for other grain legumes, with Most Micro (Pendimetalin) (2.0 l ha-1) before emergence and Altorex (Imazamox) (1.0 l ha-1) after emergence. Harvest was carried out the 10th of October, when grain yield was determined on an area of 12 m2 in the middle of each plot to avoid any edge effect.
Galactomannan determination
In order to evaluate their galactomannans content, the seeds were milled into guar flour using a laboratory mill (Retsch, Model ZM100) with screens, which had holes of decreasing diameter from 1.5 mm down to 0.25 mm.
1057
The dry weight of guar flour obtained after milling was determined in a IR dryer (Mettler Toledo, LJ16). The samples were exposed to infrared radiation at a wavelength from 2 m to 3.5 m for 30 min at a temperature of 110 °C. From the weight difference determined at the end of the drying process, the water content percentage and the dry weight of the samples were calculated.
The method for galactomannans determination was based on McCleary (1981) as adapted by the Megazyme method “Galactomannan assay procedure” (www.megazyme.com) with the following modification: after elimination of the raffinose series oligosaccharides by repeated ethanol precipitation, the samples of guar seed flour (or milled seeds) were re-suspended in 50 mM acetate buffer, pH 4.5, and incubated for 30 min at 95-100 °C with vigorous stirring on vortex every 10 min and further incubated for another 30 min at 50°C. This procedure is necessary to ensure complete solubilization of the galactomannans.
Analyses were carried out in duplicate on each replication, so that the data reported represent the mean of six measurements.
Seeds image acquisition and analysis
Digital images of seed samples were acquired using a flatbed scanner (ScanMaker 9800 XL, Microtek Denver, CO) with a digital resolution of 400 dpi and a scanning area not exceeding 1024×1024 pixel. Before image acquisition, the scanner was calibrated for colour matching following the protocol of Shahin and Symons (2003b) as suggested by Venora et al. (2009). Images consisting of 100 bean seeds were captured, randomly disposing them on the flatbed tray, and used for the digital image analysis. In order to represent the whole variability of each of the seed lots, the analysis was performed on the whole batch. Morpho-colorimetric features were only measured for sound intact seeds, rejecting those without a seed coat or with a broken seed coat. A total of 5,474 guar seeds were analysed.
Digital images of seeds were processed and analyzed using the software package KS-400 V. 3.0 (Carl Zeiss, Vision, Oberkochen, Germany). A macro, specifically developed for the characterization of bean seeds (Venora et al., 2009), was modified to perform automatically all the analysis procedures, reducing the execution time and mistakes in the analysis process.
In order to increase the discrimination power, this macro was further enhanced adding algorithms that allow us to calculate the Elliptic Fourier Descriptors (EFDs) for each analysed seed, obtaining a further 78 quantitative variables. As described by Orrù et al. (2013), this method allows us to define the boundary of the seed projection, as an array of complex numbers which correspond to the pixels position of the seed boundary (Ucchesu et al., 2015). According to many authors (Yoshioka et al., 2004; Lootens et al., 2007; Iwata et al., 2009; Hâruta, 2011), regarding the choice of number of harmonics for an optimal description of seed outlines, in order to minimize the measurement errors and optimize the efficiency of shape reconstruction, 20 harmonics were used to define the seed boundaries. Moreover, the macro was improved including algorithms able to compute 11 Haralick’s descriptors with the relative standard deviation values for each seed. These parameters are generally used when the objects in the images cannot be separated due to indefinite grey value variations. In these cases, the evaluation of texture, tone and context allows us to define the spatial distribution of the image intensities and discrete tonal features. When a small area of the image has little variation
of discrete tonal features, the dominant property of that area is grey tone. When a small area has wide variation of discrete tonal features, the dominant property of that area is texture (Haralick and Shapiro, 1991). According to Haralick et al. (1973), the concept of tone is based on varying shades of grey of resolution cells in a photographic image, while texture is concerned with the spatial (statistical) distribution of grey tones. Texture and tone are not independent concepts; rather, they bear an inextricable relationship to one another very much like the relationship between a particle and a wave. Context, texture and tone are always present in the image, although at times one property can dominate the others.
The basis for these features is the grey-level co-occurrence matrix (G in equation 1). This matrix is square with dimension Ng, where Ng is the number of grey levels in the image. Element [i,j] of the matrix is generated by counting the number of times a pixel (p) with value i is adjacent to a pixel with value j and then dividing the entire matrix by the total number of such comparisons made. Each entry is therefore considered to be the probability that a pixel with value i will be found adjacent to a pixel of value j.
)
,
(
,
)
2
,
(
)
1
,
(
)
,
2
(
)
2
,
2
(
)
1
,
2
(
)
,
1
(
)
2
,
1
(
)
1
,
1
(
g g g g g gN
N
p
N
p
N
p
N
p
p
p
N
p
p
p
G
(eq . 1)The 11 Haralick’s descriptors measured on each seed to mathematically describe the surface texture and all the other morpho-colorimetric characters are available as supplementary information (Suppl. Info. 1 and 2).
Mean seed weight of each seed lot was also included to increase the discriminating power of the statistical analysis. It was determined weighing 20 seeds ten times, on a four decimal places scale.
Statistical analysis
Field data were submitted to one-way ANOVA and Tukey’s was adopted as multiple comparison test. Percentage data were previously normalized with arcsine square root transformation. The data, obtained from image analysis, were used to build a global database, including morpho-colorimetric, EFDs and Haralick’s descriptors and mean seed lot weight. Statistical elaborations were executed using the SPSS software package release 16 (SPSS Inc. for Windows, Chicago, Illinois, USA), applying the same stepwise Linear Discriminant Analysis (LDA) algorithm suggested by Grillo et al. (2012) to identify and discriminate between the investigated guar varieties. This approach is commonly used to classify/identify unknown groups characterized by quantitative and qualitative variables (Sugiyama, 2007), finding the combination of predictor variables with the aim of minimizing the within-class distance and maximizing the between-class distance simultaneously, thus achieving maximum class discrimination (Venora et al., 2009; Rencher and Christensen, 2012; Kuhn and Johnson, 2013). The original LDA formulation, also known as the Fisher Linear Discriminant Analysis (FLDA) deals with binary classifications (Hastie et al., 2001; Holden et al., 2011). The key idea in LDA is to look for a direction that separates well the class means (when projected in that direction) while achieving a small variance around these means (Jieping,
1058
2007). The selection of the original features is carried out by a stepwise procedure. The stepwise method identifies and selects the most statistically significant features among them to use for the seed sample identification, using three statistical variables: Tolerance, F-to-enter and F-to-remove. The Tolerance value indicates the proportion of a variable variance not accounted for by other independent variables in the equation. F-to-enter and F-to-remove values define the power of each variable in the model and they are useful to describe what happens if a variable is inserted and removed, respectively, from the current model. This selective process starts with a model that does not include any of the original morpho-colorimetric features. At each step, the feature with the largest F-to-enter value that exceeds the entry criteria chosen (F ≥ 3.84) is added to the model. The original features left out of the analysis at the last step have F-to-enter values smaller than 3.84, so no more are added. The process is automatically stopped when no remaining morpho-colorimetric features increased the discrimination ability (Grillo et al., 2012).
A cross-validation procedure was applied to verify the performance of the identification system, testing individual unknown cases and classifying them relative to all others. This procedure, also called rotation estimation (Picard and Cook, 1984; Kohavi, 1995), was applied, both to evaluate the performance and to validate any classifier. The validation procedure here used is the Leave-One-Out Cross-Validation (LOOCV). It involves using a single case from the original sample set as the validation dataset, and the remaining cases as the training set. Each case is classified into a group according to the classification functions computed from all the data except the case being classified. The proportion of misclassified cases after removing the effect of each case one at a time is the leave-one-out estimate of misclassification (SPSS, 2007).
All the raw data were standardized before starting any statistical elaboration. Moreover, in order to evaluate the quality of the discriminant functions achieved for each statistical comparison, the Wilks’ Lambda, the percentage of explained variance and the canonical correlation between the discriminant functions and the group membership, were computed. The Box’s M test was executed to assess the homogeneity of covariance matrices of the features chosen by the stepwise LDA while the analysis of the standardized residuals was performed to verify the homoscedasticity of the variance of the dependent variables used to discriminate among members of groups (Haberman, 1973; Morrison, 2004). Kolmogorov-Smirnov’s test was performed to compare the empirical distribution of the discriminant functions with the relative cumulative distribution function of the reference probability distribution, while the Levene’s test was executed to assess the equality of variances for the used discriminant functions calculated for members of groups (Gastwirth et al., 2009; Lopes, 2011).
To graphically highlight the differences among groups, multidimensional plots were drawn using the first two or three discriminant functions, depending on the number of discriminant seed groups. Finally, the Mahalanobis’square
distance values were used to graphically report the
morpho-colorimetric variability of the varieties (Grillo et al., 2012). This measure of distance is defined by two or more discriminant functions and ranges from 0 to infinite. Samples are increasingly similar at values closer to zero. Higher values indicate that a particular case includes extreme values for one or more independent variables, and can be considered significantly different to other cases of the same group (Lo Bianco et al., 2015b).
Finally, with the aim of exploring the relationships between the galactomannan content and the seed phenotypic parameters, also including the seed weight, a Pearson correlation was performed.
Conclusion
As a whole, the accessions studied in this research grown in a Mediterranean environment reached yield, in terms of grain and galactomannans content, comparable to the data reported in the literature. With the application of image analysis to the seed, it was possible to prove that an objective, repeatable and non-destructive method, based on seed phenotypic characterization, can be effectively applied also to identify and discriminate C. tetragonoloba varieties and accessions. Considering the high level of phenotypical similarity of the analysed seed samples and the great morphological variability of some of the studied varieties, the image analysis method here discussed, could became an irreplaceable tool for stakeholders, since, emulating human intelligence, facilitates quantitative determination and object interpretation for the identification and certification of guar seed accessions. It was able to cope with the great variability of seed population and varieties of guar seed. Moreover, since strong and effective correlations were found between galactomannan content and seed morphological traits, this tool could be used to predict galactomannan content from the image analysis of the whole seed, avoiding expensive and time-consuming laboratory determinations.
References
Avola G, Tuttobene RM, Gresta F, Abbate V (2008) Weed control strategies for grain legumes. Agr Sust Dev. 28(3):389-396.
Bacchetta G, Fenu G, Grillo O, Mattana E, Venora G (2011) Species identification by seeds image analysis of
Astragalus sect. Melanocercis Bunge (Fabaceae) in
Sardinia. Ann Bot Fenn. 48:449-454.
Beech DF, Stutzel H, Charles-Edwards DA (1989) Yield determinants of guar (Cyamopsis tetragonoloba): 1. Grain yield and pod number. Field Crops Res. 21:29-37.
Bhatia IS, Nagpal ML, Singh P, Kumar S, Singh N, Mahindra A, Parkash O (1979) Chemical nature of the pigment of the seedcoat of guar (cluster bean Cyamopsis tetragonolobus L. Taub). J Agr Food Chem. 27:1274-1276.
Fawzi NM (2011) Macro and micromorphological seed characteristics of some selected specie of Caesalpinioideae-Leguminosae. Res J Bot. 6(2):68-77.
Gastwirth JL, Gel YR, Miao W (2009) The impact of Levene's test of equality of variances on statistical theory and practice. Stat Sci. 24:343-360.
Gresta F, De Luca AI, Strano A, Falcone G, Santonoceto C, Anastasi U, Gulisano G (2014) Economic and environmental sustainability analysis of guar (Cyamopsis
tetragonoloba L.) farming process in a Mediterranean area:
two case studies. Italian J Agr. 9(1):20-24.
Gresta F, Sortino O, Santonoceto C, Issi L, Formantici C, Galante YM (2013) Effects of sowing times on seed yield protein and galactomannans content of four varieties of guar (Cyamopsis tetragonoloba L.) in a Mediterranean environment. Ind Crop Prod. 41:46-52.
Gresta F., Mercati F., Santonoceto C., Abenavoli M.R., Ceravolo G., Araniti F., Anastasi U., Sunseri F., 2016. Morpho-agronomic and AFLP characterization to explore guar (Cyamopsis tetragonoloba L.) genotypes for the
1059
Mediterranean environment. Ind Crop Prod. DOI 10.1016/j.indcrop.2016.03.038.
Grillo O, Mattana E, Venora G, Bacchetta G (2010) Statistical seed classifiers of 10 plant families representative of the Mediterranean vascular flora. Seed Sci Technol. 38:455-476.
Grillo O, Miceli C, Venora G (2011) Image analysis tool for Vetch varieties identification by seeds inspection. Seed Sci Technol. 39:90-500.
Grillo O, Draper D, Venora G, Martínez-Laborde JB (2012) Seed image analysis and taxonomy of Diplotaxis DC. (Brassicaceae Brassiceae). Syst Biodiv. 10(1):57-70. Grillo O, Mattana E, Fenu G, Venora G, Bacchetta G (2013)
Geographic isolation affects inter- and intra-specific seed variability in the Astragalus tragacantha complex as assessed by morpho-colorimetric analysis. C R Biol. 336(2):102-108.
Haberman SJ (1973) The analysis of residuals in cross-classified tables. Biometrics 29 :205-220.
Haralick RM, Shapiro LG (1991) Glossary of computer vision terms. Pattern Recogn. 24:69-93.
Haralick RM, Shanmugam K, Its’hak D (1973) Textural features for image classification. IEEE Trans. Systems. Man Cybern. 3:610-621.
Hâruta O (2011) Elliptic Fourier analysis of crown shapes in
Quercus petraea trees. Ann For Res. 54:99-117.
Hastie T, Tibshirani R, Friedman J (2001) The elements of statistical learning: data mining inference and prediction. Springer New York USA
Herridge RP, Day R, Baldwin S, Macknight (2011) Rapid analysis of seed size in Arabidopsis mutant and QTL discovery. Plant methods 7 3 doi:10.1186/1746-4811-7-3. Holden JE, Finch WH, Kelley K (2011) A comparison of
two-group classification methods. Educ Psychol Meas. 71:870-901.
Iwata H, Ebana K, Uga Y, Hayashi T, Jannink JL (2009) Genome-wide association study of grain shape variation among Oryza sativa L. germplasms based on elliptic Fourier analysis. Mol Breed. 25:203-215.
Jieping Y (2007) Least square linear discriminant analysis. Proceeding of the ICML07 24th international conference on Machine learning; Corvallis Oregon USA June 20-24 2007 pp. 1087-1093.
Kilic K, Boyaci IH, Köksel H, Küsmenoglu (2007) A classification system for beans using computer vision system and artificial neural networks. J Food Eng. 78:897-904.
Kohavi R (1995) A study of cross-validation and bootstrap for accuracy estimation and model selection. In: Martin TP, Ralescu AL (eds) IJCAI’95: fuzzy logic in artificial intelligence, towards intelligent systems. 14th International Joint conference on artificial intelligence, Montréal Québec, Canada, August 1995. (Lecture notes computer science). Morgan Kaufmann, San Francisco, p 1137. Kuhn M, Johnson K (2013) Applied Predictive Modelling.
Springer: New York, USA.
Kumar D, Singh NB (2002) Guar in India. Scientific Publishers: Jodhpur, India.
Jakson KJ, Doughton JA (1982) Guar: a potential industrial crop for dry tropics of Australia. J Austr Inst Agr Sci. 42:17-31.
Liyanage S, Abidi N, Auld D, Moussa H (2015) Chemical and physical characterization of galactomannan extracted from guar cultivars (Cyamopsis tetragonolobus L.). Ind Crop Prod. 74:388-396.
Lo Bianco M, Ferrer-Gallego P, Grillo O, Laguna E, Venora G, Bacchetta G (2015b) Seed image analysis provides
evidence of taxonomical differentiation within the
Medicago L. sect. Dendrotelis (Fabaceae). Syst Biodiv.
13(5):484-495.
Lo Bianco M, Grillo O, Cremonini R, Venora G (2015a) Characterisation of Italian bean landraces (Phaseolus
vulgaris L.) using seed image analysis and texture
descriptors. Austr J Crop Sci. 9(11):1022-1034.
Lootens P, Van Waes J, Carlier L (2007) Description of the morphology of roots of Chicorium intybus L. partim by means of image analysis: comparison of elliptic Fourier descriptors classical parameters. Comput Electron Agric. 58:164-173.
Lopes RHC (2011) Kolmogorov-Smirnov test. In: International encyclopedia of statistical science. Lovric (Ed). Springer Berlin Heidelberg: Germany.
Liu W, Peffley EB, Powell RJ, Auld DL, Hou A (2007) Association of seed coat color with seed water uptake germination and seed components in guar (Cyamopsis
tetragonoloba (L.) Taub). J Arid Env. 70:29-38.
Manivannan A, Anandakumar CR, Ushakumari R, Dahiya GS (2016) Characterization of Indian clusterbean (Cyamopsis tetragonoloba (L.) Taub.) genotypes using qualitative morphological traits. Gen Res Crop Evol. 63:483-493.
McCleary BV (1981) Galactomannan quantitation in guar varieties and seed fractions. Lebens Wissensch Techn. 14:188-191.
Morrison DF (2004) Multivariate statistical methods. 4th ed. Cengage Learning Duxbury Press: USA.
Mudgil D, Barak S, Khatkar BS (2014) Guar gum: processing properties and food applications – are view. J Food Sci Technol. 51:409-418.
Orrù M, Grillo O, Lovicu G, Venora G, Bacchetta G (2013) Morphological characterization of Vitis vinifera L. seeds by image analysis and comparison with archaeological remains. Veg Hist Archaeobot. 22:231-242.
Orrù M, Grillo O, Venora G, Bacchetta G (2012) Computer vision as a method complementary to molecular analysis: grapevine cultivar seeds case study. C R Biol. 335:602-615. Orrù M, Grillo O, Venora G, Bacchetta G (2015) Seed morpho-colorimetric analysis by computer vision: a helpful tool to identify grapevine (Vitis vinifera L.) cultivars. Austr J Grape Wine Res. 21:508–519.
Picard R, Cook D (1984) Cross-validation of regression models. J Am Statist Assoc. 79:575-583.
Pinna MS, Grillo O, Mattana E, Cañadas EM, Bacchetta G (2014) Inter- and intraspecific morphometric variability in
Juniperus L. seeds (Cupressaceae). Syst Biodiv.
12(2):211-223.
Rao AV, Tarafdar JC, Sharma SK, Kumar P, Aggarwal RK (1995) Influence of cropping systems on soil biochemical properties in an arid rain-fed environment. J Arid Env. 31:237-244.
Rencher AC, Christensen WF (2012) Methods of multivariate analysis. 3rd ed. John Wiley & Sons.
Rovner I, Gyulai F (2007) Computer-assisted morphometry: a new method for assessing and distinguishing morphological variation in wild and domestic seed populations. Econ Bot. 61:154-172.
Santo A, Mattana E, Grillo O, Bacchetta G (2014) Morpho-colorimetric analysis and seed germination of Brassica
insularis Moris (Brassicaeae) populations. Plant Biol.
17:335–343.
Shahin MA, Symons SJ (2003a) Lentil type identification using machine vision. Can Biosyst Eng. 45:3.5-3.10.
1060
Shahin MA, Symons SJ (2003b) Colour calibration of scanners for scanner independent grain grading. Cereal Chem. 80:285-289.
Smykalova I, Grillo O, Bjelkova M, Hybl M, Venora G (2011) Morpho-colorimetric traits of Pisum seeds measured by an image analysis system. Seed Sci Technol. 39:612-626.
Smykalova I, Grillo O, Bjelkova M, Pavelek M, Venora G (2013) Phenotypic evaluation of flax seeds by image analysis. Ind Crop Prod. 47:232-238.
Sortino O, Gresta F (2007) Growth and yield performance of five guar cultivars in a Mediterranean environment. Italian J Agr. 4:359-364.
Stearn WT (1980) Botanical. Latin. David & Charles Publ. London.
Sugiyama M (2007) Dimensionality Reduction of Multimodal Labeled Data by Local Fisher Discriminant Analysis. J Mach Learn Res. 8:1027-1061.
Ucchesu M, Orrù M, Grillo O, Venora G, Usai A, Serreli PF, Bacchetta G (2015) Earliest evidence of a primitive cultivar of Vitis vinifera L. during the Bronze Age in Sardinia (Italy). Veg Hist Archaeobot. 24:587-600.
Undersander DJ, Putnam DH, Kaminski AR, Kelling KA, Doll JD, Oplinger ES, Gunsolus JL (2006) Guar. Alternative Field Crops Manual. University of Wisconsin-Madison. www.hort.purdue.edu/newcrop/ afem/guar.html. Venora G, Grillo O, Saccone R (2009) Quality assessment of
durum wheat storage centres in Sicily: Evaluation of vitreous starchy and shrunken kernels using an image analysis system. J Cereal Sci. 49:429-440.
Werker E (1997) Seed Anatomy. Encyclopedia of Plant Anatomy vol. 10. Borntraeger Berlin.
Whistler RL, T Hymowitz 1979 Guar: Agronomy Production Industrial Use and Nutrition. Purdue University Press: West Lafayette, Indiana.
Yoshioka Y, Iwata H, Ohsawa R, Ninomiya S (2004) Analysis of petal shape variation of Primula sieboldii by elliptic Fourier descriptors and principal component analysis. Ann Bot. 94:1-8.