UNIVERSITÀ DEGLI STUDI DI SALERNO
Department of Pharmacy
INTERNATIONAL RESEARCH DOCTORATE PROGRAM IN
MOLECULAR PHYSIOPATHOLOGY, DIAGNOSIS AND
THERAPY OF METABOLIC DISEASES
Coordinator: Prof. Maurizio Bifulco
XII cycle NS
2010–2013
Molecular pathways involved in metabolic
control of CCL5 in adipocytes
Tutor: PhD Student:
Prof. Pietro Formisano Federica Passaretti
To my family
“The family is a link to our past, a bridge to our future.”
Table of content
TABLE OF CONTENTS
LIST OF PUBLICATIONS ... 3 LIST OF ABBREVATIONS ... 5 ABSTRACT ... 7 SOMMARIO ... 8 1. BACKGROUND ... 9 1.1 Adipose Tissue ... 9 1.2 Obesity ... 121.3 Adipose tissue inflammation in obesity ... 15
1.4 Regulated on Activation, Normal T cell Expressed and Secreted/CCL5 (RANTES/CCL5) ... 22
2. AIM OF THE STUDY ... 25
3. MATERIALS AND METHODS ... 27
3.1 Materials ... 27
3.2 Cell culture ... 27
3.3 Conditioned media system ... 28
3.4 Bioplex cytokine and growth factor assay ... 28
3.5 ELISA ... 28
3.6 Real-time RT-PCR analysis ... 29
3.7 Western blot analysis ... 29
3.8 Chromatin Immunoprecipitation (ChIP) assay ... 29
Table of content
4. RESULTS ... 31
4.1 Analysis of cytokine and growth factor release by 3T3-L1 adipocytes and their precursors ... 31
4.2 Glucose and FFA effect on CCL5 secretion and mRNA levels ... 32
4.3 Molecular pathway activation in adipocytes: FFA effect ... 34
4.4 Role of JNK and NF-kB pathways on CCL5 mRNA levels induced by FFAs ... 35
4.5 FFA effect on NF-kB binding to CCL5 promoter in adipocytes ... 36
4.6 CCL5 mRNA levels induced by FFAs: role of ERK and AKT ... 37
4.7 Insulin effect on CCL5 mRNA levels induced by fatty acids ... 39
4.8 Effect of insulin on NF-kB binding to CCL5 promoter ... 41
5. DISCUSSION ... 43
6. CONCLUSIONS ... 47
7. ACKNOLEDGEMENTS ... 48
List of pubblications
LIST OF PUBLICATIONS
This dissertation is based upon the following publications:S. Savastano, R. Valentino, G. Pizza, A. De Rosa, F. Orio, F. Passaretti, P. Formisano, G. Lombardi, F. Beguinot, A. Colao. Preliminary data on effects
of metformin on PED/PEA-15 cellular levels in obese women with polycystic ovary syndrome. J Endocrinol Invest. 2010 Jul-Aug;33(7):446-50.
S. Savastano, R. Valentino, C. Di Somma, F. Orio, C. Pivonello, F. Passaretti, V. Brancato, P. Formisano, A. Colao, F. Beguinot, G. Tarantino.
Serum 25-Hydroxyvitamin D Levels, Phosphoprotein Enriched in Diabetes Gene Product (PED/PEA-15) and Leptin-to-Adiponectin Ratio in Women with PCOS. NutrMetab (Lond). 2011 Nov 23;8(1):84.
V. D’Esposito, F. Passaretti, A. Hammarstedt, D. Liguoro, D. Terracciano, G. Molea, L. Canta, C. Miele, U. Smith, F. Beguinot, P. Formisano.
Adipocyte-released insulin-like growth factor-1 is regulated by glucose and fatty acids and controls breast cancer cell growth in vitro. Diabetologia. 2012
Oct;55(10):2811-22. Epub 2012 Jul 15.
G. Tarantino, R. Valentino, C. Di Somma, V. D'Esposito, F. Passaretti, G. Pizza, V. Brancato, F. Orio, P. Formisano, A. Colao, S. Savastano. Bisphenol
A in polycystic ovary syndrome and its association with liver-spleen axis.
ClinEndocrinol (Oxf). 2013 Mar;78(3):447-53.
F. Passaretti, M. Tia, V. D'Esposito, M. De Pascale, M. Del Corso, R. Sepulveres, D. Liguoro, R. Valentino, F. Beguinot, P. Formisano, G. Sammartino. Growth-promoting action and growth factor release by different
platelet derivatives. Platelets. 2013 Jul.
R. Valentino, V. D' Esposito, F. Passaretti, A. Liotti, S. Cabaro, M. Longo, G. Perruolo, F. Oriente, F. Beguinot, P. Formisano. Bisphenol-A impairs insulin
action and up-regulates inflammatory pathways in human subcutaneous adipocytes and 3T3-L1 cells. PLoSOne. 2013 Dec 9;8(12):e82099.
List of abbreviations
LIST OF ABBREVIATIONS
ANG-II: angiotensin-IIaP2: adipocyte protein 2 apoE: apolipoprtotein E ATF2: activating transcription factors 2
ATM: adipose tissue macrophage BAT: brown adipose tissue BMI: body mass index CNS: central nervous system DTH: delayed-type
hypersensitivity
EGF: epidermal growth factor Elk-1: ETS domain-containing protein
ERK: extracellular-signal-regulated kinase
FA: fatty acid FFA: free fatty acid
FGF: fibroblast growth factor GC: glucocorticoid
IFN-γ: interferon-gamma
IGF1: insulin-like growth factor 1
IGFBP: insulin-like growth factor binding protein
IGT: impaired glucose tolerant IkBα: nuclear factor kB inhibitor alpha
IKK-β: IkB kinase-beta IL: interleukin
IR: insulin receptor
IRS1-4: insulin receptor substrate 1-4
JNK: c-Jun N-terminal kinase LPL: lipoprotein lipase
MAPK: mitogen-activated protein kinase
MCP-1: monocyte chemoattractant protein-1
MIF: macrophage migration inhibitory factor
mTOR: mammalian target of rapamycin
NF-kB: nuclear factor-kB NGF: nerve growth factor NK: natural killer
List of abbreviations
PAI-1: plasminogen activator inhibitor-1
PET/TC: positron emission
tomography/computed tomography PI3K: phosphatidylinositol 3 kinase
PKB/AKT: protein kinase B PPARs: peroxisome proliferator-activated receptors
RANTES/CCL5: regulated on activation normal T cell expressed and secreted/CCL5
SCD1: stearoyl CoA desaturase SYP: SH-PTP2 Src homology domain tyrosine phosphatase T2D: type 2 Diabetes TG: triglyceride TGF-β: transforming growth factor-beta TH: T helper TLR4: toll-like receptor 4 TNF-α: tumor necrosisi factor-alpha
TNFR1: TNF receptor 1 TREG: T regulatory
VMN: ventro-medial hypothalamic nucleus
WAT: white adipose tissue WHO: world Health Organization
Abstract
ABSTRACT
Obesity is a chronic disorder characterized by a tonic low-grade activation of the innate immune system that affects steady-state measures of metabolic homeostasis over time. In addition, obesity is often accompanied by elevations in tissue and circulating FFA concentrations. Systemic levels of FFAs can induce inflammatory cascades in adipocytes and macrophages through TLR4-dependent effect. Signaling through TLR4 activates a broad range of intracellular cascades that include stimulation of IKK-β, NF-kB, JNK and AP1. Indeed, in addition to store excess calories in the form of lipid, adipose tissue produces classical cytokines and chemokines such as MCP-1, IL-8 and CCL5. CCL5, as other chemokines, participates in mediating leukocyte infiltration of adipose tissue. Moreover circulating CCL5 concentrations are elevated in obesity, impaired glucose tolerance (IGT) and type 2 diabetes. In this study I have investigated the molecular mechanisms involved in the metabolic control of CCL5 expression in adipocytes. Cytokine/growth factor screening of conditioned media from 3T3-L1 pre-adipocytes and pre-adipocytes revealed that pre-adipocytes secreted higher amount of CCL5 compared to their undifferentiated precursors. Higher concentrations of glucose and fatty acids (oleate and palmitate) increased CCL5 secretion by 3T3-L1 adipocytes. Moreover, both oleate and palmitate enhanced CCL5 mRNA levels and induced an activation of JNK, NF-kB, MAPK and PI3K/AKT pathways. In cells treated with JSH23, a NF-kB inhibitor, the effect of FFAs on CCL5 mRNA levels was reduced thus indicating a direct involvement of NF-kB. Treatment of the cells with SP600125, a JNK inhibitor, also significantly reduced the stimulatory effect of oleate and palmitate on CCL5 mRNA and interestingly prevented FFA-induced NF-kB binding to CCL5 promoter. I have also obtained evidence that insulin exerted an inhibitory effect on CCL5 mRNA and counteracted fatty acid-induced stimulation. Both PD98059 and LY294002, inhibitors of MAPK and PI3K, respectively, increased CCL5 expression levels reverted anti-inflammatory effect of insulin in presence of fatty acids. Consistently, insulin exposure reduced NF-kB recruitment onto CCL5 promoter, and almost completely prevented fatty acid effect. In conclusion, oleate and palmitate induce CCL5 mRNA, possibly via JNK and NF-kB pathways. Fatty acid effect on CCL5 is largely prevented by insulin and may involve PI3K/AKT and MAPK.
Sommario
SOMMARIO
L’obesità è una malattia cronica caratterizzata da un’infiammazione di basso grado e da elevate concentrazioni tissutali e plasmatiche di acidi grassi liberi. Gli acidi grassi possono indurre la stimolazione di recettori posti sulla membrana di adipociti e macrofagi, come ad esempio il TLR4, e attivare pathway infiammatori (IKK-β, NF-kB, JNK e AP1). Il tessuto adiposo immagazzina l’eccesso di calorie sotto forma di lipidi e produce numerose citochine e chemochine come ad esempio MCP-1, IL-8 e CCL5. CCL5, come altre chemochine, è coinvolta nei processi di infiltrazione leucocitaria del tessuto adiposo. Sono stati riscontrati elevati livelli circolanti di CCL5 in soggetti obesi, in individui con alterata tolleranza al glucosio e pazienti con diabete mellito di tipo 2. In questo studio, ho indagato i meccanismi molecolari coinvolti nel controllo metabolico dell’espressione di CCL5 negli adipociti. L’analisi di sovranatanti cellulari ha rivelato che adipociti murini 3T3-L1 rilasciano elevati livelli di CCL5 rispetto ai loro precursori indifferenziati. Il trattamento con alte concentrazioni di glucosio e acidi grassi (oleato e palmitato) aumenta la secrezione di CCL5 da parte degli adipociti 3T3-L1. Inoltre, sia oleato che palmitato incrementano i livelli di mRNA di CCL5 e inducono un’attivazione dei pathway di JNK, NF-kB, MAPK e PI3K/AKT. In cellule trattate con l’inibitore specifico di NF-kB, JSH23, l’effetto degli acidi grassi sui livelli di mRNA di CCL5 è ridotto, suggerendo un diretto coinvolgimento di NF-kB. Anche il trattamento con SP600125, inibitore specifico di JNK, riduce significativamente l’effetto di oleato e palmitato sul messaggero di CCL5 e, inoltre, previene il binding di NF-kB sul promotore di CCL5. Sono state anche ottenute evidenze che l’insulina esercita un effetto inibitorio sull’espressione di CCL5 e contrasta la stimolazione indotta dagli acidi grassi. Il trattamento con gli inibitori delle vie delle MAPK e della PI3K, PD98059 e LY294002, rispettivamente, aumenta l’espressione di CCL5 opponendosi all’effetto anti-infiammatorio dell’insulina. Infine, il trattamento con l’insulina riduce il reclutamento di NF-kB sul promotore di CCL5, e previene quasi completamente l’effetto degli acidi grassi. In conclusione, oleato e palmitato inducono il messaggero di CCL5 via JNK e NF-kB. L’insulina previene l’effetto degli acidi grassi su CCL5 e questo meccanismo potrebbe essere mediato da PI3K/AKT e MAPK .
Chapter 1 Background
1. BACKGROUND
1.1 Adipose tissue
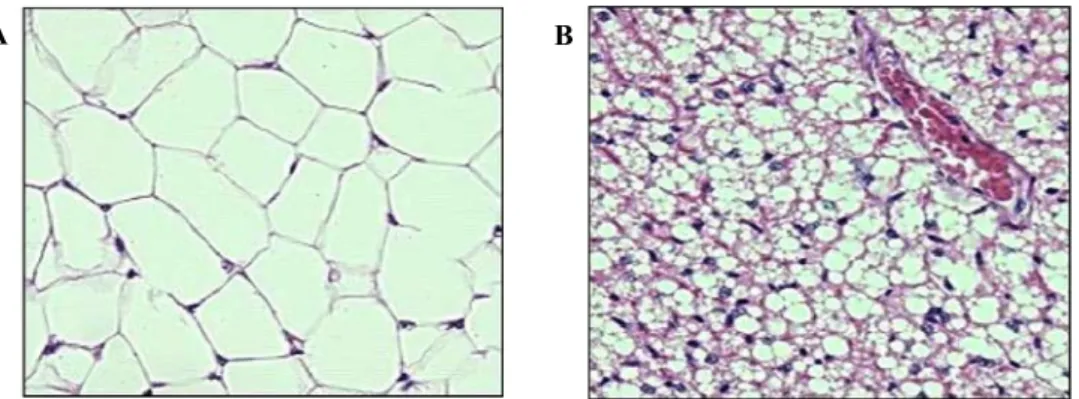
Energy stores are depleted intermittently during sleep-wake cycles and over prolonged periods during famine or illness. To maintain vital cellular functions, human and other mammals consume more calories than is required for immediate metabolic needs and store excess calories as glycogen, protein and lipids. Adipose tissue, commonly called ‘fat’, is a type of loose connective tissue comprised of lipid-filled cells (adipocytes) surrounded by a matrix of collagen fibers, blood vessels, fibroblasts and immune cells (Ahima and Flier 2000). There are different kinds of adipose tissues that are generally regarded as connective tissues without a specific anatomy (Figure 1).
Figure 1: Comparative image of two different kinds of adipose tissue. White adipose has little cytoplasm and has huge oil droplet (A). Brown adipose tissue has more capillaries and has much more cytoplasm (B).
However, accumulating data support the idea that adipose tissues are organized to form a large organ with discrete anatomy, specific vascular and nerve supplies, complex cytology, and high physiological plasticity (Cinti 2011).
Among adipose tissue kind, Brown adipose tissue (BAT) is a specialized tissue whose main function is to produce heat. In small mammals, it is located in discrete depots and has largely been investigated for its role in thermogenesis (Richard et al. 2012). There are many evidences that BAT is not only found in small mammals but also in adult humans. A number of
B A
Chapter 1 Background
studies involving imaging procedures such as positron emission tomography/computed tomography (PET/CT) scanning have revealed symmetrical distribution of metabolically active brown fat depots around cervical, clavicular, and paraspinal regions in humans (Richard at al 2012). White adipose tissue (WAT), the predominant type of adipose tissue in humans, provides a virtually limitless storage site for triglycerides. It is characterized by adipocytes with a single lipid inclusion and eccentrically located nucleus, whereas brown adipocytes are polygonal cells with a roundish nucleus and several cytoplasmic lipid droplets (Cinti 2012).
Thus, white and brown adipocytes are not only different in their morphology but also in their physiology: white adipocytes store energy for the metabolic needs of the organism, whereas brown adipocytes burn energy for thermogenesis (Cinti 2012). Both cell types are contained in the multiple depots of the adipose organ. White adipocytes of different sizes are present in subcutaneous depots (mainly large adipocytes) and visceral depots (mainly small adipocytes). Brown adipocytes in visceral depots are mainly found near aorta. Paucocilocular adipocytes, which are cells with intermediate morphology between that of white and brown adipocytes, are also present in the adipose organ. It should be noted that some groups also refer to ‘beige’ (Ishibashi and Seale 2010) or ‘brite’ (brown in white) (Petrovic et al. 2010) regions of white adipose tissue, containing brown or brown-like adipocytes. Adipocytes in visceral depots are sensitive to lypolitic stimuli, whereas adipocytes from structural depots (such as around the eyes and in the heel pads) do not release stored lipid easily.
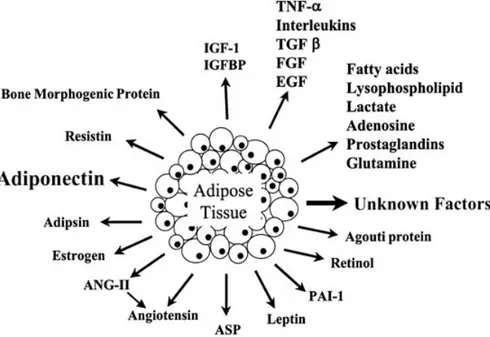
Classically thought of as a tissue mass that stores excess energy and provides insulation and padding to the body, adipose tissue is now accepted to be an endocrine organ that secretes numerous hormones, growth factors, cytokines, matrix proteins, enzymes and complement factors (Figure 2). For instance, classical cytokines include tumor necrosis factor-α (TNF-α) and interleukin-1, 6, 10, and 18 (IL-1, IL-6, IL-10, IL-18), whereas monocyte chemoattractant protein-1 (MCP-1), macrophage migration inhibitory factor (MIF), regulated on activation normal T cell expressed and secreted/CCL5 (RANTES/CCL5) and interleukin-8 (IL-8) belong more to the subgroup of chemokines (D’Esposito et al. 2012). The diversity of secreted molecules includes also factors involved in lipid and glucose metabolism such as lipoprotein lipase
Chapter 1 Background
proliferator-activated receptor (PPAR), glucocorticoids, sex steroids, prostaglandins, adipsin, acylation stimulating protein, leptin, resistin, adiponectin/Acrp30/adipoQ, osteonectin, and cathepsins, among others. Finally, secreted growth factors include insulin-like growth factor 1 (IGF1), nerve growth factor (NGF), macrophage colony-stimulating factor, transforming growth factor-β (TGF-β), vascular endothelial growth factor (VEGF), heparin-binding epidermal growth factor, leukemia inhibitory factor, and bone morphogenetic proteins (Fruhbeck 2008).
Figure 2: Adipokines secreted by white adipose tissue. White adipose tissue (WAT) secretes various humoral factors called adipokines. Adipokines have important effects on lipid and glucose metabolism, and so on.
Adapted from Ravussin. Pharmacogenomics J. 2002;2(1):4-7.
The secreted factors identified to date play a role in fat mass regulation and regulation of adipocyte differentiation, vascular and blood flow regulation, lipid and cholesterol metabolism, and immune system function. With such varied biological functional roles, it is likely that these adipokines have a significant role in disease processes known to be metabolic consequences of obesity, such as insulin resistance, cardiovascular disease, and altered lipid homeostasis (Poulus et al. 2009).
Chapter 1 Background 1.2 Obesity
Obesity is characterized by excessive fat accumulation in adipose tissue and other organs. It is a major cause of morbidity and mortality, associated with an increased risk of cardiovascular disease, metabolic syndrome and certain forms of cancer. The BMI (Body Mass Index), calculated as weight (kg) divided by height squared (m2), is used as a measurement of body fat in
clinical and epidemiologic studies. The National Heart, Lung and Blood Institute and the world Health Organization (WHO) define overweight as a BMI equal to or greater than 25 Kg/m2 and obese as a BMI equal to or greater than 30 Kg/m2. The WHO estimates that 1.5 billion people are overweight and more than 500 million are obese worldwide (Gilbert and Slingerland 2013). Once considered a problem only in the USA and other high-income countries of the Western world, obesity has become a major contributor to the global burden of disease (Misra and Khurana 2008). The worldwide increase in the incidence of obesity and related chronic diseases has largely been driven by global trade liberalization, economic growth and rapid urbanization, which continue to fuel dramatic changes in living environments as well as in diets and lifestyles that promote positive energy balance. Positive energy balance occurs when individual’s caloric intake exceeds their energy expenditure, leading to weight gain (Haweks 2006; Malik et al. 2012). Indeed the balance between energy intake (food consumption) and energy expenditure (basal metabolic rate) is tightly regulated (Singla et al. 2010). Combined with reduction in physical activity, these factors are driving the global obesity epidemic (Fuster and Kelly 2010).
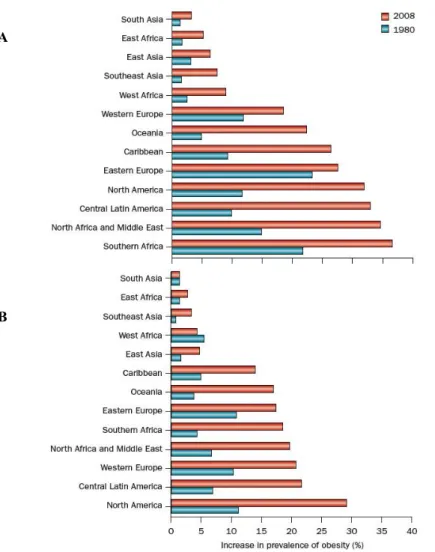
The global effect of the obesity epidemic was formally recognized by the WHO during a special obesity consultation in 1997. National survey data show that obesity epidemic began in the USA over 40 years ago, with the estimated prevalence having more than doubled in the USA from 1980 to 2010 and worldwide from 1980 to 2008. In the USA alone in 2009-2010, 35.5% of men and 35.8% of woman had obesity (Flegal et al. 2012). In 2008 it was estimated that 500 million adults had obesity, which represents 10-14% of the world’s population. Among women, obesity prevalence increased in all regions. The greatest magnitudes of increase were observed in central Latin America, North America and North Africa and the Middle East. The
Chapter 1 Background
from around 14% to 18%. Other regions had increases ranging from <3% in east Asia to close to 7% in Western Europe. For men, obesity increased in all regions except South Asia. The greatest magnitude of increase was observed in North America, with an increase of <18%. In central Latin America, Southern Africa, Oceania, north Africa and the Middle East, Western Europe and the Caribbean prevalence increased by <9-15%. In the remaining regions, prevalence increased by between 1.4% in East Africa and <6% in Eastern Europe. In the 2008, the sex-specific prevalence of obesity was highest in North America (men: 29.2%) and in southern Africa (women: 36.5%) (Figure 3) (Malik et al. 2012).
Fig. 3: Global trends in the prevalence of obesity among women and men in 1980 and 2008 from select regions of the world. Estimates of obesity prevalence in women (A) and
A
Chapter 1 Background men (B) are shown. Among women, obesity prevalence increased in all regions. For men, obesity increased in all regions except South Asia.
Adapted from Finucane et al. Lancet. 2011 Feb 12;377(9765):557-67.
The prevalence of obesity is higher in adults than in children but the increase in the incidence of obesity among children has occurred more rapidly than that among adults in some countries, such as the USA, Brazil and China (Popkin et al. 2006). The worldwide prevalence of childhood overweight and obesity increased from 4.2% to 6.7% between 1990 and 2010 (de Onis et al. 2010). Genetic predisposition is a key contributing factor in obesity, as has been demonstrated by familial aggregation, twin and adoption studies. Estimates for a genetic basis for obesity range from approximately 40% to 70%. The idea that genetic loci alter body fat content has been substantiated by the identification of mutations that cause low- or high-fat phenotypes in rodents and humans (Friedman 2000).
The hypothalamus is the major nervous centre controlling food intake. It has two major areas that play an important role in maintaining the normal energy homeostasis of the body by controlling the hunger and satiety centres. The portion of hypothalamus, called the ventro-medial hypotalamic nucleus (VMN), is known as the ‘satiety centre’. Stimulation of VMN causes suppression of food intake, whereas a bilateral VMN lesion induces hyperphagia and obesity. On the contrary, stimulations or any lesion of lateral hypotalamic area, known as ‘hunger centre’, induce the opposite set of responses. Various neuropeptides (e.g. the melanocortin system, neurpeptide Y) and neurotrasmitters (e.g. serotonin, dopamine, and noradrenaline) along with insulin and leptin molecules function in hypothalamus and thus coordinate the behavioral, physiological and metabolic responses (Singla et al. 2010). In addition to these long-term adiposity signals, short-term meal related signals are also transmitted to the central nervous system (CNS) through afferent nerves or gut-secreted peptides (e.g. cholecystockinin, ghrelin). In the CNS neurons are also directly sensitive to carbohydrates and fats (Arora et Anubhuti 2006).
Adipose tissue is major endocrine organ, producing various hormones that regulate body metabolism. An increase in the fat cell mass leads to an alteration of hormone-adipose tissue release, which can have various
Chapter 1 Background
the metabolic syndrome, consist of insulin resistance, often culminating in β-cell failure, impaired glucose tolerance and type 2 diabetes, dyslipidemia, hypertension and premature heart disease (Singla et al. 2010). Moreover obesity is characterized by a low-grade inflammation not only in adipose tissue but also in others organs.
1.3 Adipose tissue inflammation in obesity
Over the past decade, the search for a potential unifying mechanism behind the pathogenesis of obesity-associated diseases has revealed a close relationship between nutrient excess and derangements in the cellular and molecular mediators of immunity and inflammation. The inflammatory response triggered by obesity involves many component of the classical inflammatory response to pathogens and includes systemic increases in circulating inflammatory cytokines and acute phase proteins (e.g. C-reactive protein), recruitment of leukocytes to inflamed tissue, activation of tissue leucocytes and generation of reparative responses (e.g. fibrosis) (Spencer et al. 2010). The chronic nature of obesity produces a tonic low-grade activation of the innate immune system that affects steady-state measures of metabolic homeostasis over time. Superimposed on this chronic inflammation are recurrent acute episodes of nutrition-related immune activation induced by nutrient availability (fasting or high-fat meals) (Lumeng and Saltiel 2011). Adipose tissue can respond rapidly and dynamically to alternations in nutrient deprivation and excess through adipocyte hypertrophy and hyperplasia that can both contribute to adipose tissue expansion (Sun et al. 2011). It has been described that macrophage infiltration has a key role into expanding of adipose tissue, causing inflammation and linking obesity to insulin resistance. Several mechanisms including fatty acid flux, hypoxia, adipocyte cell death and augmented chemokine and adipokine secretion have been proposed to be initiators of macrophage infiltration (Weisberg et al. 2003; Xu et al. 2003). Plasma Free fatty acids (FFAs) concentrations are chronically elevated in human obesity because of the blunted capacity of insulin to inhibit lipolysis and the excessive consumption of dietary lipids (Cnop 2008).
FFAs, stored in the form of triglycerides in adipose tissue, are released from hypertrophic adipocytes through lipolysis during fasting. Some of these FFAs are shunted to the liver and stored in lipid droplets, while some of them are
Chapter 1 Background
oxidized in other organs. However, many of them are locally re-esterified in adipocytes. Those FFAs that escape re-esterification play a critical role in several organs as a primary energy source during prolonged fasting (Sun et al. 2011). However, FFAs can also serve as ligands for the toll like receptor 4 (TLR4) complex, thereby activating the classical inflammatory response in the context of increased local extracellular lipid concentrations, which ultimately drives adipose tissue macrophage accumulation. Even though adipose tissue is not considered as a conventional tissue suffering from lipotoxic side effects, either high rates of lipolysis or an influx of saturated FFAs into adipocytes do cause temporary inflammation within the tissue (Shi et al. 2006). FFAs cause inflammation via TLR4 in all cellular fractions of adipose tissue. Thus, FFAs induce a pro-inflammatory pattern of adipokine production in primary adipocytes or adipocyte cell line (Nguyen et al. 2005; Shi et al. 2006). FFAs also activate macrophages, especially the CD11c+ subset, thereby exacerbating their pro-inflammatory activity (Suganami et al. 2007). Many of the metabolic stresses, through activation of TLR4, promote inflammation and induce several kinases, such as IkB kinase-β (IKK-β) and C-Jun N-terminal kinase (JNK), which may have key roles in pathogenesis of insulin resistance. Indeed, IKK-β activates the transcription factor nuclear factor-kB (NF-kB), and obesity induces the expression of NF-kB target genes, such as pro-inflammatory cytokines, in the liver and adipose tissue. These cytokines, including TNF-α, IL-6, IL-8 and IL-1β, may promote insulin resistance in the tissues where they are produced, such as the liver and adipose tissue, and may also be transported through the circulation to affect more distant sites, including the vessel walls, skeletal and cardiac muscle, the kidneys and circulating leukocytes. The other potentially important kinase, JNK, activates transcription factors such as ETS domain-containing protein (Elk-1), activating transcription factors 2 (ATF2) and Jun (Osborn and Olefsky 2012). IKK-β and JNK belong to group of kinases that phosphorylate on serine 307 the insulin receptor substrate (IRS) leading to an alteration of insulin signaling. Insulin signaling involves a complex signaling cascade downstream of the insulin receptor. This signaling cascade branches into two main pathways. The first is the phosphatidylinositol 3-kinase (PI3K)/AKT (also called protein kinase B (PKB)) pathway that is largely responsible for insulin action on glucose uptake, as well as other metabolic actions of insulin,
Chapter 1 Background
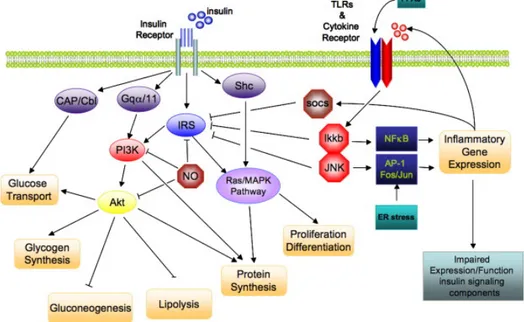
mitogen-activated protein kinase (MAPK) pathway, which mediates gene expression, but also interacts with PI3K-AKT pathway to control cell growth and differentiation. The common intermediate to these pathways is IRS, which include four distinct family members, IRS-1-4. Activation of the insulin receptor leads to tyrosine phosphorylation of IRS-1 thereby initiating signal transduction. When IRS-1 is alternatively phosphorylated on serine 307, its downstream signaling ability is diminished (Figure 4) (de Luca and Olefsky 2008).
Figure 4: Direct interaction of insulin signaling and inflammatory pathways. Insulin signaling cascade branches into two main pathways. The PI3K/AKT pathway mediates insulin action on nutrient metabolism including glucose uptake. The Ras/MAPK pathway mediates insulin’s effect on gene expression, but also interacts with the PI3K-AKT pathway to control cell growth and differentiation. Activation of the insulin receptor leads to tyrosine phosphorylation of IRS1 thereby initiating signal transduction. Stimulation of the NF-kB and AP-1 Fos/Jun inflammatory pathways results in the activation of the serine kinases, Ikkb and Jnk1, which reduce the signaling ability of IRS-1. Additional inflammation-related negative regulators of IRS proteins include the Socs proteins and NO, which are induced in inflammation, and promote IRS degradation. NO also reduces PI3K/AKT activity by s-nitrosylation of AKT.
Chapter 1 Background
Adipose tissue inflammation probably results from a complex crosstalk between adipocytes, macrophages and other immune cells, with contributions from both the innate and adaptive arms of immune system (Sell et al. 2012). An important finding that helped elucidate the cause of adipose tissue inflammation from obese mice and humans is the infiltration with a large numbers of macrophages. These adipose tissue macrophages (ATMs) can comprise up to 40% of the cells in obese adipose tissue (Osborn and Olefsky 2012).
In the adipose tissue, macrophages have been shown to aggregate, forming crown-like structures (CLSs) surrounding necrotic adipocytes in advanced obesity. In this state they fuse to phagocyte the residual lipid droplet, forming large lipid-laden multinucleated syncytia in the process, a commonly accepted hallmark of chronic inflammation (Sun et al. 2011).
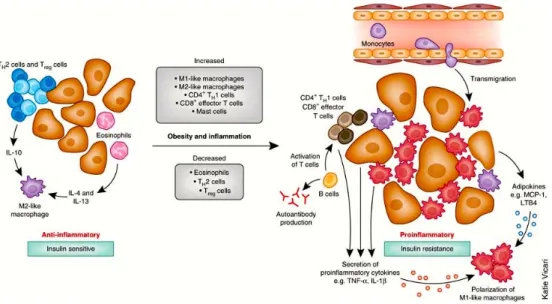
Figure 5: Immune cells mediate inflammation in adipose tissue. In the lean state, adipose tissue TH2 T cells, TREG cells, eosinophils and M2-like resident macrophages predominate.
TREG cells secrete IL-10 and also stimulate IL-10 secretion from resident M2-like
macrophages. Eosinophils secrete IL-4 and IL-13 and further contribute to the anti-inflammatory, insulin-sensitive phenotype. In obesity-induced inflammation, immune cells are recruited and contribute to adipose tissue inflammation. Monocytes respond to chemotactic signals and transmigrate into the adipose tissues and become polarized to the highly inflammatory M1-like state. Once recruited, these M1-like macrophages secrete pro-inflammatory cytokines that work in a paracrine fashion. The eosinophil content declines in
Chapter 1 Background decrease in TREG content and an increase in CD4+ TH1 and CD8+ effector T cells, which
secrete pro-inflammatory cytokines. B cell numbers also increase and activate T cells, which potentiate M1-like macrophage polarization, inflammation and insulin resistance. Cytokines and chemokines from the adipose tissue can also be released into the circulation and work in an endocrine manner to promote inflammation in other tissues.
Adapted from Osborn and Olefsky. Nat Med. 2012 Mar 6;18(3):363-74.
Obesity is accompanied by a transformation in the polarized states of macrophages; from an anti-inflammatory “alternatively activated” M2 form that primarily accumulates during negative balance, to a more pro-inflammatory classically activated M1 form (Sun et al. 2011). The M1 population, CD11c+ macrophages, demonstrates a positive correlation with insulin resistance and dominates in states of overnutrition by targeting FFA-mediated increases in pro-inflammatory responses (Lumeng et al. 2007; Shoelson et al. 2006). This phenotypic switch of macrophages could be a key step of adipose tissue inflammation and might provide a link to the involvement of cells of adaptive immune system (Figure 5) (Sell et al. 2012). In lean mice about 10% of the stroma-vascular fraction (SVF) from the visceral fat depot is composed of CD3+ T lymphocytes, with a 1:3 ratio of
CD8+ to CD4+. Adipocytes themselves could have immune-cell-like functions that lead to CD4+ T-cell activation, potentially triggering inflammation independently of macrophage infiltration. The CD4+ T-cell compartment could be subdivided into pro-inflammatory T-helper type 1 (TH1) and TH17 cells,
and anti-inflammatory TH2 and T-regulatory cells (TREG) that express forkhead
box protein P3 (mFoxp3) (Feuerer et al. 2009).
In mouse models of diet-induced obesity, T-cell populations differ in adipose tissue. A higher CD8+ and CD4+ T-cell ratio is found in visceral adipose tissue of high-fat diet fed mice compared with lean mice. Diet-induced obesity also leads to a dramatic increase in TH1-polarized cells, whereas the TH2-polarized
fraction in significantly reduced by ≈ 50%. After feeding with a high-fat diet, moreover, the TH17 subset in visceral adipose tissue represents <1% of the
CD4+ population and TREG cells are reduced by 70%. Unlike visceral adipose
tissue, the proportions of CD4+ and CD8+ T-cell subsets in subcutaneous
adipose tissue were reduced, whereas TREG numbers did not change during
obesity (Feuerer et al. 2009; Caspar-Bauguil et al. 2005).
Other immunity cells are implicated in inflammatory response to adipocyte hypertrophy such as CD8+, natural killer (NK), NKT and B cells. CD8+ are
Chapter 1 Background
involved in macrophage differentiation, activation and migration, thereby initiating inflammatory cascades in adipose tissue that lead to insulin resistance. NK cells are present in large numbers in visceral adipose tissue where they might be involved in regulation of adipose tissue homeostasis and their number is decreased in a leptin-dependent manner. NKT cells are described as innate-like T lymphocytes, because they possess invariant pattern recognition receptors instead of antigen-specific T-cell receptors, and release a mixture of TH1 and TH2 cytokines such as IFN-γ and IL-4, thereby formation
of subsequent adaptive immune responsive (Van Kaer 2007). Lymphocytes B are also involved in obesity-released inflammation. In fact, reconstitution with wild type B cells from high-fat-diet fed mice lead to impaired glucose metabolism and decreased insulin sensitivity as a result of the antigen-dependent activation of T cells (TH1 and CD8+ T cells), pro-inflammatory M1
macrophages and secretion of pathogenic IgG antibodies from B cells. Treatment with a B cell-depleting antibody attenuates these effects, whereas transfer of IgG from mice with diet-induced obesity quickly induces insulin resistance and glucose tolerance (Winer et al. 2011).
Based on these studies in mouse models, lymphocytes infiltration in adipose tissue might occur in a chronological sequence that begins with B and T lymphocytes (TH1 and CD8+ cells) being rectruited during early
obesity-induced inflammation by preadipocytes or adipocytes-derived chemokines like CCL5, MCP-1 (CCL2), CXCL12 (also known as SDF-1α) and CXCL5 (Wu et al. 2007). These cells direct the local inflammatory process through the release of pro-inflammatory TH1 cytokines such as IFN-γ, which promote M1
macrophage recruitment by inducing pre-adipocytes and adipocytes to release chemokines and activated macrophages (Sell et al. 2012).
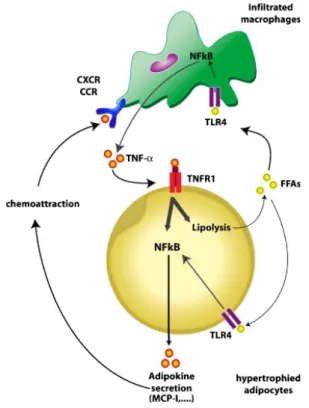
It has been suggested that a paracrine loop between adipocytes and macrophages establishes a vicious circle that aggravates the inflammatory changes in adipose tissue. Interactions between both cell types are critical. This paracrine loop involves FFAs and TNF-α (Figure 6). Enlarged adipocytes release in excess saturated FAs that activate macrophages via TLR4 signaling. As a result, macrophages secrete the pro-inflammatory adipokine TNF-α, which in turn acts on TNF-α receptor 1 (TNFR1) and induces inflammatory changes in hypertrophied adipocytes through activation of the
Chapter 1 Background
There is considerable evidence for the pathophysiological role of macrophage and hypertrophic adipocyte-derived chemotactic MCP-1/CCR2 pathways in the regulation of monocyte accumulation in obese adipose tissue. In particular, increased expression levels of MCP-1, CXCL14, MIP-1α, MCP-2, MCP-3, and CCL5 can be observed in obese and diabetes mice adipose tissue (Sun et al. 2011).
Figure 6: Cross-talk between adipocytes and macrophages of adipose tissue in obesity. TNF-α, which is mainly overproduced by macrophages appears to be a crucial contributor to adipokine dysregulation in adipocytes. Adipocytes of obese subjects overproduce adipokines in response to TNF-α. This hyper-responsiveness is mediated by TNF-α-receptor-1 (TNFR1) and by hyper-activation of NF-kB pathway. TNF-α also induces lipolysis (FFA release). Saturated FFAs in turn activate the TLR4/NF-kB pathway in both macrophages and adipocytes, thereby further increasing the production of TNF-α and other pro-inflammatory adipokines. Some of these adipokines exert chemoattractant activity through binding to specific receptors (CXCR and CCR) of macrophages leading to their infiltration in obese AT. Adapted from Maury and Brichard. Mol Cell Endocrinol. 2010 Jan 15;314(1):1-16.
Chapter 1 Background 1.4 Regulated on Activation, Normal T cell Expressed and Secreted/CCL5 (RANTES/CCL5)
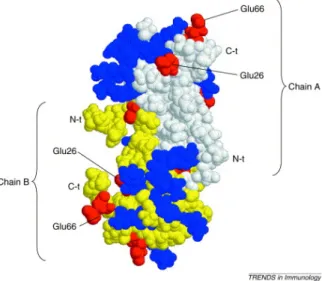
The chemokines are involved in many aspects of the immune response including lymphocyte chemo-attraction, adhesion, and activation. The family contains more than 40 members, which have been divided into subfamilies based on a conserved pattern of cysteines. Members of the CC subfamily have overlapping in vitro biological activities including chemo-attraction for monocytes and T cells (Makino et al. 2002). They also play a pivotal role in diseases such as autoimmune and allergic inflammatory disorders, cancer and organ transplant where excessive cellular recruitment plays a deleterious role. Their function is not limited to recruitment, since they also play a role in cellular activation, differentiation, degranulation and in processes such as organ development, angiogenesis, lymphogenesis and wound repair (Proudfoot 2006). CCL5 is a typical chemokine of 68 amino acids that is able to recruit leucocytes to sites of inflammation. It induces leucocyte migration by binding to specific receptors in the seven-transmembrane G-protein-coupled receptor (GCPR) family, namely CCR1, CCR3, CCR4 and CCR5. In common whit other chemokines, there is a clear structural basis for the dimerization of CCL5, although dimer formation is not essential for its chemokine receptor interactions, and CCL5 can signal through its specific receptors as a monomer. However, a peculiar characteristic of CCL5 is its ability to self-aggregate, forming multimers at high concentrations. The amino acids involved in this self-aggregation, Glu66 and Glu26, are negatively charged residues. CCL5 also contains several positively charged residues on its surface, which makes it likely that ionic bindings are involved in the formation of multimers (Figure 7) (Appay and Rowland-Jones 2001).
Chapter 1 Background
Figure 7: Structure of a dimer of human CCL5. Positively charged residues are colored in blue and negatively charged residues are in red. The dimerization of CCL5 has a structural basis (white-colored residues belong to chain A, and yellow-colored residues belong to chain B) but, in addition, CCL5 self-aggregates to form multimers. The dimerization occurs at the N-terminal part of the molecule, which is also essential for receptor binding and signaling. The residues involved in the multimerization, Glu66 and Glu26, are found at the surface of the protein, suggesting that ionic binding with positively charged surface residues from other CCL5 molecules occurs and leads to self-aggregation. Changing these residues to serine abrogates aggregation.
Adapted from Appay and Rowland-Jones. Trends Immunol. 2001 Feb;22(2):83-7.
CCL5 mediates the trafficking and homing of classical lymphoid cells such as T cells and monocytes, but also acts on a range of other cells, including basophils, eosinophils, naural killer (NK) cells, dendritic cells and mast cells (Appay and Rowland-Jones 2001). It also promotes T cell adherence to activated endothelial cells (Taub et al. 1993) and stimulates T cell proliferation (Taub et al. 1996).
To better define CCL5 in vivo activity Makino et al. have used gene targeting to produce CCL5-deficient (-/-) mice. Analysis of these mice reveals that CCL5 plays a role in the delayed-type hypersensitivity (DTH) response, T cell proliferation, and the production of IL-2 and IFN-γ. One of the functional consequences of the absence of CCL5 is an impaired DTH reaction. Because CCL5 plays a role in several aspects of the immune response, the decreased DTH response is likely the consequence of the sum of this effects including
Chapter 1 Background
decreased T cell priming and proliferation as well as possible changes in the TH1 response as indicated by the decreases in IFN-γ production (Makino et al.
2002).
When CCL5 was identified, it attracted particular attention because it was demonstrated to be a potent inhibitor of HIV replication in vitro. In 1995 CCL5 was shown to be the most potent member of a trio of CC chemokines released by CD8+ T cells that were able to suppress the replication of
non-syncitium-inducing (NSI) HIV-1 strains in vitro. The others chemokines were macrophage inflammatory protein 1 alpha (MIP-1α) and MIP-1β. The three chemokines bind to the CCR5 receptor on the surface of CD4+ T cells, and this receptor is also the means by HIV gains entry to the cell. The HIV-suppressive effect of CCL5 appears to be critically dependent on the presence of glycosamminoglycans (GAG) on the target cell surface (Appay and Rowland-Jones 2001).
Protein and RNA levels of CCL5 are increased in a gender-dependent fashion in white adipose tissue of obesity (Wu et al. 2007). CCL5 is expressed by adipocytes and has been hypothesized to mediate leukocyte infiltration of adipose tissue in obesity (Poulain-Godefroy and Froguel 2007; Wu et al. 2007). Circulating CCL5 concentrations are elevated in obesity, impaired glucose tolerance (IGT) and type 2 diabetes (Nomura et al. 2000; Herder et al. 2005). Moreover, in the Finish Diabetes Prevention Study, high CCL5 levels were associated with resistance to lifestyle intervention and higher incidence of type 2 diabetes in the intervention group (Herder et al. 2006). Wu et al. found higher CCL5 mRNA levels in visceral compared with subcutaneous adipose tissue in obese humans. In their studies, Madani et al. showed CCL5 production by human subcutaneous adipose tissue in vivo and release of this chemokine in novel depots, the gastric fat pad and epicardial fat. They demonstrated that while epicardial CCL5 was related to obesity, neither systemic CCL5 nor its release from the subcutaneous and the abdominal visceral adipose tissue is a good marker of adiposity. There is significant heterogeneity in the release of CCL5 from the various depots, a finding that suggests differential regulation by autocrine/paracrine factors (Madani et al. 2009)
Chapter 2 Aim of the Study
2. AIM OF THE STUDY
Obesity is associated with insulin resistance, hyperglycaemia, dyslipidemia, hypertension and other components of the metabolic syndrome (Sell and Eckel 2009). Enlargement of adipose tissue is the consequence of a sedentary lifestyle and increased energy intake, and is associated with a prominent inflammatory response in the visceral compartment that leads to adipose tissue dysfunction (Sell et al. 2012). Adipocytes, in addition to their storage function, are also active endocrine cells that produce and release various adipokines such as adiponectin, visfatin, resistin, adipsin, cytokines (TNF-α, IL-6, IL-1, IL-10, IL-18) and chemokines including MCP-1, IL-8 and CCL5 (D’Esposito et al. 2012). Chemokines may be directly linked to a chronic state of low-grade inflammation and macrophage infiltration in adipose tissue (Sell and Eckel 2009). Macrophage infiltration has a key role into expanding of adipose tissue, causing inflammation and linking obesity to insulin resistance (Weisberg et al. 2003; Xu et al. 2003). It has been described that several mechanisms may contribute to the initial adipose macrophage infiltration and impair adipocyte insulin signaling such as stressed adipocytes secreting multiple chemokines and cytokines, fatty acid flux, hypoxia and adipocyte cell death (Jiao et al. 2011). Obesity is characterized by chronically elevated concentrations of plasma FFAs caused in part by the blunted capacity of insulin to inhibit lipolysis and the excessive consumption of dietary lipids (Cnop 2008). Excessive overnutrition and macrophage infiltration in adipose tissue lead to an inflammatory pathway activation and cytokine/chemokine production in adipocytes. Recent interest has focused on CCL5 chemokine, and in particular, its role in regulating the recruitment of inflammatory cells into adipose tissue. CCL5 levels have been found elevated in serum of obese, impaired glucose tolerance (IGT) and type 2 diabetes patients (Nomura et al. 2000; Herder et al. 2005; Wu et al. 2007). The aim of this study is to identify the molecular mechanisms involved in the metabolic control of CCL5 expression in adipocytes. In particular, I have evaluated whether metabolic perturbations such as different concentrations of glucose and free fatty acids may affect CCL5 adipocyte production. Moreover, I have investigated the role of different pathways normally activated by FFAs in adipocytes in the regulation of CCL5 production. Finally, I have observed the effect of insulin on FFA-induced CCL5 expression in adipocytes.
Chapter 3 Materials and Methods
3. MATERIALS AND METHODS
3.1 Materials
Media, sera, antibiotics for cell culture were from Lonza (Basel, Switzerland). Antibodies against specific phospho-Serine473-AKT/PKB, phospho-Threonine183/Tyrosine185-JNK, AKT/PKB, JNK, ERK, IkBα, NF-kB, 14.3.3 and NF-kB activation inhibitor II (JSH23) were purchased from Santa Cruz Biotechnology (Santa Cruz, CA, USA). Phospho-Threonine202/Tyrosine204-ERK and phospho-Serine32-IkBα were obtained from Cell Signaling Technology (Denvers, MA, USA). JNK inhibitor (SP600125), MEK inhibitor (PD98059), PI3K inhibitor (LY294002), sodium oleate and sodium palmitate were purchased from Sigma-Aldrich (Steinhem, DE). Protein electrophoresis and real time RT-PCR reagents were purchased from Bio-Rad (Hercules, CA, USA), Western blotting and ECL reagents from Amersham Biosciences (Arlington Heights, IL, USA).
3.2 Cell culture
The 3T3-L1 murine fibroblast cells were available in host laboratory. They were grown in Dulbecco’s modified Eagle’s medium (DMEM) supplemented with 10% calf serum (CS), 100 IU/ml penicillin, 100 IU/ml streptomycin, and 2% L-glutamine in a 5% humidified CO2 incubator. 3T3-L1
cells were differentiated as previously described (Engelman et al. 1998). In brief, after 2 days from confluence (Day 0), the DMEM 10% FBS was changed and new DMEM 10% FBS was added to the cells with the addition of 160 nm insulin, 250 nm dexamethasone, and 0.5mm 3-isobutyl-1-methylxanthine. After 2 days (Day 2), this medium was replaced with fresh DMEM 10% FBS containing only 160 nm insulin. After another 2 days, the cells were then propagated in 10% FBS medium. Adipogenesis was scored by analysis of the expression of adipocyte-specific genes (aP2 and peroxisome proliferator-activated receptor γ (PPARγ)) (Chavey et al. 2003) and by lipid accumulation using microscopic analysis or oil red O staining (Ramirez-Zacarias et al. 1992).
Chapter 3 Materials and Methods 3.3 Conditioned media system
The conditioned media was isolated in the following way: confluent 3T3-L1 adipocyte plates were identified, the 10% FBS removed, the plates washed two times with sterile phosphate-buffered saline (PBS), and 3–5 ml of serum-free DMEM 0,25%BSA (DMEM-BSA) added to the plates and incubated for approximately 8h. After the incubation, the DMEM-BSA was collected and centrifuged at 14000xg to remove cellular debris.
3.4 Bioplex cytokine and growth factor assay
Supernatants were collected after 8 h of plating the different cells. Concentrations of IL-1a, IL-1b, IL-2, IL-3, IL-4, IL-5, IL-6, IL-9, IL-10, IL- 12 (p40), IL-12(p70), IL-13, IL-17, Eotaxin, G-CSF, GM-CSF, IFN-γ, KC/IL-8, MCP-1, MIP-1α, MIP-1β, CCL5, TNF-α, PDGF, VEGF and IGF1 were determined using the Bioplex multiplex Mouse Cytokine and Growth factor assay kits (Bio-Rad, Hercules, CA) according to the manufacturer’s protocol. Briefly, 50 µl of the culture supernatant or cytokine standard was plated in a 96 well filter plate coated with a multiplex of beads coupled to antibodies against the above mentioned cytokines and incubated for 30 min on a platform shaker at 300 rpm at RT. After a series of washes to remove the unbound proteins, a mixture of biotinylated detection antibodies, each specific for a different epitope was added to the reaction resulting in the formation of antibodies assimilated around the target proteins. Streptavidin-phycoerythrin (streptavidin-PE) was then added to bind to the biotinylated detection antibodies on the bead surface. The data from the reaction were then collected and analyzed by using the Bio-Plex suspension array system (or Luminex 100 system) from Bio-Rad Laboratories (Hercules, CA).
3.5 ELISA
CCL5 protein secreted into the cell culture supernatants was quantified by ELISA, according to the manufacturer’s protocol (R&D System).
Chapter 3 Materials and Methods 3.6 Real-time RT-PCR analysis
Total RNA was isolated from 3T3-L1 adipocytes by using the Rneasy Kit (Qiagen Sciences) according to the manufacturer’s instruction. For real-time RT-PCR analysis, 1 µg cell RNA was reverse transcribed using SuperScript II Reverse Transcriptase (Invitrogen). PCR were analyzed using SYBR Green mix (Invitrogen). Reactions were performed using Platinum SYBR Green Quantitative PCR Super-UDG using an iCycler IQ multicolour Real-Time PCR Detection System (Biorad Hercules, CA). All reactions were performed in triplicate and ACTIN was used as an internal standards. Primer sequences used were as follows: CCL5 forward primer 5’- AGG AAC CGC CAA GTG TGT GCC -3’, reverse primer 5’- AGT GGC ATC CCC AAG CTG GC -3’; ACTIN forward primer 5’- CGC CCT AGG CAC CAG GGT GTG -3’, reverse primer 5’- TCG GTG AGC AGC ACA GGG TG-3’.
3.7 Western Blot analysis
3T3-L1 adipocytes were lysed in lysis buffer (50mM HEPES pH 7.6, 150mM NaCl, 10mM EDTA, 10mM Na4P2O7, 2mM Na3VO4, 100mM NaF,
10% glycerol, 1mM PMSF, 100 IU/ml aprotinin, 20µM leupetin, 1% Triton X-100), for 2 h at 4 °C and lysates were centrifuged at 14,000 x g for 15 minutes to remove cellular debris. Cell lysates were separated by sodium dodecyl sulfate-polyacrylamide gel electrophoresis(SDS-PAGE) and analyzed by western blot as previously described (Laemmli 1970). Nitrocellulose membranes were probed with antibodies for specific proteins.
3.8 Chromatin Immunoprecipitation (ChIP) assay
The cross-linking solution, containing 1% formaldehyde, was added directly to cell culture media. The fixation proceeded for 10 min and was stopped by the addition of glycine to a final concentration of 125 mM. 3T3-L1 adipocytes were rinsed twice with cold phosphate buffered saline plus 1 mM phenylmethylsulfonyl fluoride and then scraped. Cells were collected by centrifugation at 800 X g for 5 min at 4 °C. Cells were swelled in cold cell lysis buffer containing 5 mM PIPES (pH 8.0), 85 mM KCl, 0.5% Nonidet P-40, 1 mM phenylmethylsulfonyl fluoride, and inhibitors mixture (Sigma) and incubated on ice for 10 min. Samples were broken by sonication into
Chapter 3 Materials and Methods
chromatin fragments of an average length of 500/ 1000 bp and then microcentrifuged at 16,000 X g for 10 min at 4 °C. The sonicated cell supernatant was diluted 8-fold in chromatin immunoprecipitation (ChIP) dilution buffer containing 0.01% SDS, 1.1% Triton X-100, 1.2 mM EDTA, 16.7 mM Tris- HCl (pH 8.0), and 167 mM NaCl and precleared by adding salmon sperm and conjugating protein at equimolar concentration for 90 min at 4 °C. Precleared chromatin from 1X10⁶ cells was incubated with 1 g of polyclonal antibody (anti-NF-kB) or no antibody and rotated at 4 °C for 16 h. Mouse IgG antibody (Upstate Biotecnology/Millipore) was used as a non-specific antibody control. Immunoprecipitates were washed five times with radioimmune precipitation assay buffer containing 10 mM Tris-HCl (pH 8.0), 1 mM EDTA, 1% Triton X-100, 0.1% sodium deoxycholate, 0.1% SDS, 140 mM NaCl, and 1 mM phenylmethylsulfonyl fluoride, twice with LiCl buffer containing 0.25 M LiCl, 1% Nonidet P-40, 1% sodium deoxycholate, 1 mM EDTA, 10 mM Tris-HCl (pH 8.0), and then 3 times with TE (10 mM Tris-HCl (pH 8.0), 1 mM EDTA). Before the first wash, the supernatant from there action lacking primary antibody was saved as total input of chromatin and was processed with the eluted immunoprecipitates beginning at the cross-link reversal step. Immunoprecipitates were eluted by adding 1% SDS, 0.1 M NaHCO3, and reverse cross-linked by the addition of NaCl to a final concentration of 200 mM and by heating at 65 °C for at least 4 h. Recovered material was treated with proteinase K, extracted with phenol-chloroform-isoamyl alcohol (25:24:1), and precipitated. The pellets were resuspended in 30µl of TE and analyzed by PCR using specific primers for the analyzed regions. The input sample was resuspended in 30µl of TE and diluted 1:10 before PCR.
Eluited DNA amplified by real time RT-PCR with specific oligos: forward primer: 5’- TTT GGC CAG AGA GGG AGT CAT CCT -3’, reverse primer: 5’- AGT CCT CTG CAA GGG GTG CTC T -3’.
3.9 Statistical procedures
Data were analyzed with the Stat view software (Abacus-concepts) by one-factor analysis of variance. P values of less than 0.05 were considered statistically significant.
Chapter 4 Results
4. RESULTS
4.1 Analysis of cytokine and growth factor release by 3T3-L1 adipocytes and their precursors
For decades, adipose tissue was considered an inert mass of stored energy with some advantageous properties, such as its function as an insulating substance and as a mechanical support for more important structure (Rosen and MacDougald 2006). Adipose tissue is now accepted to be an endocrine organ that secretes numerous hormones, growth factors, matrix proteins, enzymes, cytokines and complement factors (Poulos et al. 2010).
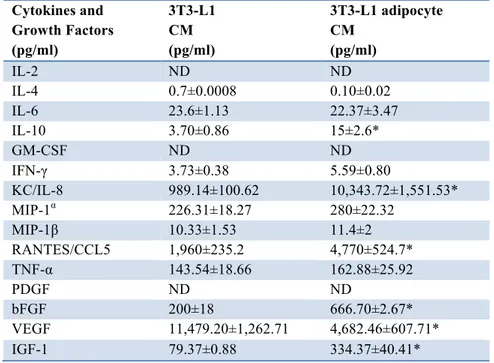
Table 1: Screening of cytokines and growth factors in 3T3-L1 pre-adipocyte and adipocyte CM. Supernatants from 3T3-L1 pre-adipocytes L1 CM) and adipocytes (3T3-L1 adipocyte CM) were collected after 8h of incubation with serum-free medium and tested for 23 cytokines and 4 growth factors by Bioplex multiplex assay. The table represents the concentration (pg/ml) of some of these cytokines and growth factors. Asterisks denote statistically significant values (*p < 0.05).
In order to identify the factors released from adipocytes, I used ELISA/multiplex analysis. In particular, I analyzed the conditioned media for
Cytokines and Growth Factors (pg/ml) 3T3-L1 CM (pg/ml) 3T3-L1 adipocyte CM (pg/ml) IL-2 ND ND IL-4 0.7±0.0008 0.10±0.02 IL-6 23.6±1.13 22.37±3.47 IL-10 3.70±0.86 15±2.6* GM-CSF ND ND IFN-γ 3.73±0.38 5.59±0.80 KC/IL-8 989.14±100.62 10,343.72±1,551.53* MIP-1α 226.31±18.27 280±22.32 MIP-1β 10.33±1.53 11.4±2 RANTES/CCL5 1,960±235.2 4,770±524.7* TNF-α 143.54±18.66 162.88±25.92 PDGF ND ND bFGF 200±18 666.70±2.67* VEGF 11,479.20±1,262.71 4,682.46±607.71* IGF-1 79.37±0.88 334.37±40.41*
Chapter 4 Results
the content of growth factors and cytokines produced by both 3T3-L1 pre-adipocytes and pre-adipocytes.
The cells were incubated with serum-free medium. After 8 h conditioned media (CM) were collected and tested for 23 cytokines and 4 growth factors by using the Bioplex multiplex cytokine assay kit and the Bioplex multiplex growth factor assay kit.
Table 1 shows that both 3T3-L1 fibroblasts and 3T3-L1 adipocytes released detectable amounts of IL-4, IL-6, IL-10, IFN-γ, KC/IL-8, MIP-1α, MIP-1β, CCL5 and TNF-α. However the levels of KC/IL-8 and CCL5 were significantly higher in 3T3-L1 adipocytes compared with their precursors. Moreover, levels of IL-10, an anti-inflammatory cytokine, were also significantly higher in 3T3-L1 adipocytes compared with fibroblasts.
I also screened for growth factor release and found that VEGF, bFGF and IGF-1 were detectable in both pre-adipocytes and adipocytes. However, bFGF and IGF-1 concentrations were significantly higher in CM of differentiated cells compared to fibroblasts, while the amount of VEGF was significantly reduced in adipocyte CM.
4.2 Glucose and FFA effect on CCL5 secretion and mRNA levels
Many adipokines synthesized by adipocytes are candidates to attract inflammatory cells in adipose tissue. It has been shown that chemotactic proteins, particularly those of the chemokine family, were related in vivo to the metabolic syndrome, obesity and type 2 diabetes. Among chemokines, CCL5 is elevated in the serum of obese patients as compared with lean controls (Sell and Eckel 2009).
Therefore, I examined whether perturbations of the metabolic environment may affect the CCL5 production by adipocytes.
I evaluated the effect of free fatty acids and glucose on CCL5 secretion and mRNA levels in adipocytes. 3T3-L1 adipocytes were cultured for 24 h either in 5.5 mM glucose (LG, low glucose), a concentration corresponding to normal fasting glucose levels in humans, or in 25mM glucose (HG, high glucose), corresponding to the regular culture condition for this cell line, but resembling hyperglycaemia in humans. Moreover I added to culture media (LG) either 10 µM oleate or 100 µM palmitate, two major fatty acids whose
Chapter 4 Results
and cells were allowed to secrete factors into freshly added serum-free medium. After 8 h, media were collected and tested for the content of CCL5 chemokine. Moreover, I also evaluated CCL5 mRNA in adipocytes after 24 h of treatment with glucose and free fatty acids.
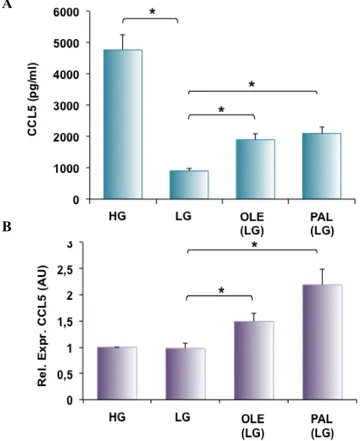
Figure 8: FFA- and glucose-induced CCL5 secretion and mRNA levels in adipocytes. 3T3-L1 adipocytes were incubated with either high glucose medium (25 mM-HG) or low glucose medium (5.5 mM-LG) in presence or absence of 10µM oleate (OLE (LG)) and 100µM palmitate (PAL (LG)). After 24 h media were collected and analyzed for the content of CCL5 chemokine by ELISA assay (A). CCL5 mRNA levels were determined by real-time RT-PCR; bars represent the mRNA levels in these cells and are relative to those in cells incubated with HG medium (B). Asterisks denote statistically significant values (*p < 0.05).
As shown 3T3-L1 adipocytes cultured in HG medium released significantly higher levels of CCL5 compared with those cultured in LG medium. Oleate and palmitate significantly increased CCL5 secretion (Figure 8A). No significant change was detected for CCL5 mRNA levels when cells were incubated in media containing different glucose concentrations while CCL5
B A
Chapter 4 Results
mRNA levels were significantly increased by oleate and palmitate (Figure 8B).
4.3 Molecular pathway activation in adipocytes: FFA effect
Systemic levels of fatty acids (FAs) are increased in obesity and, through TLR4-dependent effects, FAs can induce the activation of proteins belonging to inflammatory cascades in adipocytes (Shi et al. 2006).
In order to identify molecular pathways potentially involved in CCL5 regulation, I initially investigated the effect of oleate and palmitate on PI3K/AKT, JNK, MAPK and NF-kB pathways in adipocytes.
I evaluated the phosphorylation of AKT and ERK, proteins that are downstream PI3K and MAPK signaling pathways respectively.
Figure 9: Effect of oleate and palmitate on PI3K, MAPK, JNK and NF-kB signaling. 3T3-L1 adipocytes were starved for 16 h and stimulate with either 10µM oleate or 100µM palmitate. After 24 h the cells were solubilized as described in Materials and Methods. Cell lysates were blotted whit specific phospho-Serine473-AKT/PKB antibody (pAKT), anti-phospho-Threonine183/Tyrosine185-JNK antibody (pJNK), anti-phospho-Threonine202/Tyrosine204-ERK antibody (pERK) and anti-phospho-Serine32-IkBα antibody (pIkBα) and then reblotted whit anti-AKT/PKB (AKT), anti-JNK (JNK), anti-ERK (ERK) and IkBα (IkBα). To ensure the equal protein transfer, membranes were blotted whit an anti-14.3.3 antibody (anti-14.3.3).
Chapter 4 Results
In addition, I evaluated the activation of inflammatory pathways such as JNK and NF-kB signaling pathways investigating the phosphorylation of JNK and of nuclear factor kB inhibitor alpha (IkBα), a protein that inhibits NF-κB by masking the nuclear localization signals (NLS) of NF-κB proteins and keeping them sequestered in an inactive state in the cytoplasm.
3T3-L1 adipocytes were treated with either 10µM oleate or 100µM palmitate for 24 h. As shown in Figure 9, both oleate and palmitate induced the phosphorylation of AKT on Ser473, JNK on Thr183/Tyr185, ERK on Thr202/Tyr204 and IkBα on Ser32. The treatment with palmitate, almost invariably, induced higher phosphorylation of all the proteins compared to oleate, but no statistically significant difference between oleate- and palmitate-induced protein phosphorylation was detected.
4.4 Role of JNK and NF-kB pathways on CCL5 mRNA levels induced by FFAs
Specific inhibitors were used to characterize the potential role of oleate- and palmitate-activated JNK and NF-kB on CCL5 regulation.
3T3-L1 adipocytes were pre-incubated with low glucose medium for 18 h. In order to block JNK and NF-kB pathways and then treated with either 20µM SP600125 or 5.5µM JSH23, JNK and NF-kB inhibitors respectively, for 1 h. Next, adipocytes were stimulated with either 10µM oleate or 100µM palmitate for 24 h.
Figure 10: Effect of FFAs on CCL5 mRNA levels in adipocytes treated with JNK and NF-kB inhibitors. 3T3-L1 adipocytes were incubated with LG medium in presence or absence of 20µM SP600125 and 5.5µM JSH23, JNK and NF-kB inhibitors respectively, for 1
Chapter 4 Results h. Then adipocytes were incubated with either 10µM oleate or 100µM palmitate. After 24 h CCL5 mRNA levels were determined by real-time RT-PCR. Bars represent the mRNA levels in these cells and are relative to those in cells incubated with LG medium. * denote statistically significant values vs LG medium (p < 0,05). # denote statistically significant values vs OLE (p<0.05). § denote statistically significant values vs PAL (p<0.05).
As also previously shown, free fatty acids induced a significant increase of CCL5 mRNA levels. JNK and NF-kB inhibitions reduced CCL5 mRNA levels, impairing the effect of both oleate and palmitate. In particular, SP600125 inhibitor reduced oleate- and palmitate-induced CCL5 mRNA levels by 46.3% and 35.6% respectively, while JSH23 reduced oleate- and palmitate-induced CCL5 mRNA levels by 26.2% and 40.6% respectively (Figure 10).
Thus, JNK and NF-kB inhibitors reduced free fatty acid effect on CCL5 mRNA levels in adipocytes.
4.5 FFA effect on NF-kB binding to CCL5 promoter in adipocytes
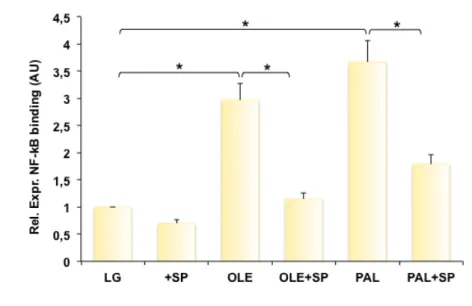
NF-kB is a transcription factor normally involved in regulation of pro-inflammatory molecules. I hypothesized that oleate and palmitate activated NF-kB affecting CCL5 gene transcriptional control and that the NF-kB activation could be mediated by JNK. Indeed, I examined whether oleate and palmitate may affect NF-kB binding to CCL5 in presence or absence of the JNK inhibitor SP600125.
Bioinformatic analysis revealed the presence of one binding site for NF-kB in the 2000 pair region upstream the CCL5 transcription initiation site (Figure 11A; positions nucleotide -175 to -41). To evaluate NF-kB binding to CCL5 promoter, I performed chromatin immunoprecipitation (ChIP) experiments in 3T3-L1 adipocytes. The cells, previously incubated in LG medium, were treated with 20µM SP600125 for 1 h and then stimulated with either 10µM oleate or 100µM palmitate for 24 h.
Chapter 4 Results
Figure 11: Effect of SP600125 on FFA-induced NFkB binding to CCL5 promoter. Schematic representation of 5’ sequence upstream the putative CCL5 transcription start site that includes the binding site for NF-kB (A). 3T3-L1 adipocytes were treated for 1 h with 20µM SP600125 and then incubated in presence or absence of 10µM oleate, 100µM palmitate. After 24 h the cells were processed to perform ChIP assay as described in Material and Methods. Soluble chromatin was immunoprecipitated with p65 NF-kB antibodies. Total and immunoprecipitated DNAs were amplified using primer pairs encompassing the CCL5 promoter by real-time RT-PCR. Bars represent the p65 binding levels and are relative to those in cells maintained in LG medium. Asterisks denote statistically significant values (*p < 0.05) (B).
I obtained evidence that oleate and palmitate significantly increased the NF-kB binding to CCL5 promoter by 3- and 3.7-fold, respectively (Fig. 11B). When the cells were treated with JNK inhibitor, there was a significant reduction of oleate- and palmitate-induced NF-kB binding by 61.3% and 51.2%, respectively (Figure 11B).
4.6 CCL5 mRNA levels induced by FFAs: role of ERK and AKT
I previously showed that, in 3T3-L1 adipocytes, oleate and palmitate activated the MAPK and PI3K/AKT signaling pathways increasing the phosphorylation of ERK and AKT, downstream proteins of these pathways,