1 TITLE PAGE
1
Title: 2
Associations between Motor Unit Action Potential Parameters and Surface EMG Features 3
4
Authors: 5
Alessandro Del Vecchio1,3, Francesco Negro2, Francesco Felici1 and Dario Farina3 6
Affiliations: 7
1Department of Movement, Human and Health Sciences, University of Rome “Foro Italico”, 00135 Rome, Italy; 8
2
Department of Clinical and Experimental Sciences, University of Brescia, 25123 Brescia, Italy; 9
3
Department of Bioengineering, Imperial College London, London, UK 10
Corresponding author: 11
D. Farina. Department of Bioengineering, Imperial College London, London, UK. Email: [email protected] 12
Key words 13
Surface electromyography; Motor unit; Recruitment; Conduction velocity; EMG features; Size principle 14
Acknowledgements 15
Alessandro Del Vecchio has received funding from the University of Rome “Foro Italico”. Francesco Negro has 16
received funding from the European Union’s Horizon 2020 research and innovation programme under the Marie 17
Skłodowska-Curie grant agreement No 702491 (NeuralCon). 18 19 20 21 22 23
2 ABSTRACT
24
The surface interference EMG signal provides some information on the neural drive to muscles. However, the 25
association between neural drive to muscle and muscle activation has long been debated with controversial 26
indications due to the unavailability of motor unit population data. In this study, we clarify the potential and 27
limitations of interference EMG analysis to infer motor unit recruitment strategies with an experimental 28
investigation of several concurrently active motor units and of the associated features of the surface EMG. For 29
this purpose, we recorded high-density surface EMG signals during linearly increasing force contractions of the 30
tibialis anterior muscle, up to 70% of maximal force. The recruitment threshold (RT), conduction velocity 31
(MUCV), median frequency (MDFMU) and amplitude (RMSMU) of action potentials of 587 motor units from 13 32
individuals were assessed and associated to features of the interference EMG. MUCV was positively associated 33
with RT (R2 = 0.64 ± 0.14) whereas MDFMU and RMSMU showed a weaker relation with RT (R2 = 0.11 ± 0.11; 34
0.39 ± 0.24, respectively). Moreover, the changes in average conduction velocity estimated from the interference 35
EMG predicted well the changes in MUCV (R2 = 0.71), with a strong association to ankle dorsi-flexion force (R2 = 36
0.81 ± 0.12). Conversely, both the average EMG MDF and RMS were poorly associated to motor unit 37
recruitment. These results clarify the limitations of EMG spectral and amplitude analysis in inferring the neural 38
strategies of muscle control and indicate that, conversely, the average conduction velocity could provide relevant 39
information on these strategies. 40
41
New and Noteworthy 42
The surface EMG provides information on the neural drive to muscles. However, the associations between EMG 43
features and neural drive have been long debated due to unavailability of motor unit population data. Here, by 44
using novel highly-accurate decomposition of the EMG, we related motor unit population behavior to a wide 45
range of voluntary forces. The results fully clarify the potential and limitation of the surface EMG to provide 46
estimates of the neural drive to muscles. 47
48
3 50
INTRODUCTION 51
The generation of force is accomplished by the concurrent recruitment and modulation of the discharge rate of 52
motor units. Motor units are recruited orderly according to the size of the motor neurons (31). When motor 53
neurons discharge action potentials, a local depolarization at the neuromuscular junction generates action 54
potentials in the innervated muscle fibers. This connection creates a one-to-one relation between axonal and 55
muscle fiber action potentials (30). 56
57
When an array of electrodes is placed in the direction of the muscle fibers, it is possible to observe and measure 58
the propagation of action potentials from the neuromuscular junction to the tendon, with a velocity that ranges 59
between 2 and 6 m/s (3). The average propagation velocity of action potentials along muscle fibers (muscle fiber 60
conduction velocity, MFCV) can be measured in vivo during voluntary contractions from an interference EMG 61
signal and represents the weighted mean of conduction velocities of the active muscle fibers. The interference 62
EMG signal can also be processed to extract features, such as its amplitude (e.g., root mean square, RMS) and 63
power spectral components (e.g., Mean/Median frequency, MNF/MDF) (24, 25). These variables are often 64
referred to as global EMG features because they represent the activity of all active motor units and not individual 65
motor unit properties. The conduction velocity of the fibers in individual motor units (MUCV) can be measured by 66
decomposing the EMG signals and extracting the action potentials for isolated motor units (15, 45). Amplitude 67
and power spectral features may be used to further characterize the decomposed action potentials of individual 68
units. 69
70
With respect to EMG decomposition and the study of individual motor units, the global EMG analysis can be 71
applied to a broader range of experimental conditions (e.g., dynamic contractions, explosive contractions, gait 72
analysis). Therefore, the relations between global EMG variables that represent muscle activation and the neural 73
drive to muscle (individual motor unit discharge timings) have been investigated with simulation models and 74
experimentally (6, 19, 24, 58). In these studies, the feasibility and reliability of associating global EMG variables 75
to the underlying behavior of the active units have been extensively debated. Despite it has been shown that 76
these associations are weak (17, 21, 37), global EMG analysis is still often used for indirectly inferring the type of 77
4 recruited motor units (e.g., (28, 34, 40, 41, 54, 57, 59, 62). This approach is sometimes justified by the fact that 78
criticisms on the use of global EMG variables for assessing the neural strategies are mainly based on simulation 79
work that may provide different results depending on tuning of model parameters (13, 40, 61). There are indeed 80
no systematic studies that experimentally reported the relations between global EMG variables and the behavior 81
of large groups of concurrently active motor units. The difficulty of these investigations is the identification of the 82
activity of relatively large populations of motor units, as it is needed to investigate the association between 83
neural drive to muscles and global EMG variables. 84
85
Recently, it has become possible to concurrently identify several motor units by high-density EMG 86
decomposition (27, 49, 50), as opposed to the small number of motor units that can be studied with selective 87
intramuscular recordings. These techniques allow us for the first time to assess the extent to which information 88
about the neural drive to the muscle can be extracted from recordings of muscle activation during a large range 89
of voluntary forces in the tibialis anterior muscle. The results fully clarify the potentials and limitations in the use 90
of global surface EMG analysis for studying the neural control of muscle activation. 91
92
METHODS 93
Thirteen healthy, recreationally active young men (mean (SD), 24.6 (2.6) yr, 180 (5.8) cm, 80 (6.3) kg) were 94
recruited and completed the experiment that was approved by the Ethical Committee of the Universitätmedizin 95
Göttingen (approval n. 1/10/12). None of the subjects reported any history of neuromuscular disorders or 96
previous lower limb surgery. An informed consent form was signed by all the volunteers before participating in 97
the experiments. 98
Experimental procedure
99
The subjects were familiarized with the experimental conditions before participating in the testing procedures. 100
The experimental conditions consisted of a series of isometric maximal and submaximal ankle dorsi-flexions. 101
The contractions were completed in the following order: isometric maximal voluntary force contractions (MVC) 102
and isometric ramp contractions. Participants completed three MVC separated by at least 30s, during which they 103
were instructed to “push as hard as possible” for at least 3 s. The greatest force produced during any of the 104
5 MVCs was considered as the maximum voluntary contraction (MVC) force. The MVC measure was followed by 105
contractions during which the force increased at the rate of 5% MVC/s-1 to reach target forces of either 35, 50, 106
and 70% MVC, which were sustained for 10 s. The volunteers completed a total of six contractions of this type, 107
two for each target force. The contractions were performed in randomized order and were separated by 5 min of 108
rest. 109
Force and electromyogram recordings
110
The participants were seated in the chair of a Biodex System 3 in an upright position (Biodex Medical Systems 111
Inc., Shirley, NY, USA), with the dominant leg (self-reported) extended and the ankle flexed at ~30° with respect 112
to the neutral position (0°), which allowed a comfortable and stable position. The ankle and the foot were tightly 113
fastened by Velcro straps. The ankle strap was in series with a load cell that was positioned perpendicular to the 114
lateral malleolus. The visual feedback on force was provided by a cursor displayed on a computer monitor. The 115
participants were instructed to follow a trapezoidal force trajectory. 116
High density surface electromyography (HDEMG) signals were recorded from the tibialis anterior muscle with a 117
grid of 64 electrodes (5 columns and 13 rows; gold coated; 1-mm diameter; 8-mm interelectrode distance; OT 118
Bioelettronica, Torino, Italy; Fig 1). Before fixing the high-density grid, a dry electrode array of 16 electrodes (OT 119
Bioelettronica, Torino, Italy) was used to identify the distal innervation zone of the tibialis anterior muscle. The 120
array was moved in the distal portion of the tibialis anterior to estimate the direction of the muscle fibers that 121
corresponded to the alignment that led to the observation of action potentials propagating along the array 122
without substantial changes in waveform shape. The electrode position was performed following the anatomical 123
description for the location of the distal innervation zone of the tibialis anterior muscles reported in (14–16). 124
Specifically, once the distal innervation zone and the fiber direction were identified, the adhesive high-density 125
grid was placed as indicated in Fig. 1, with the first 4 rows in correspondence to the innervation zone and the 126
electrode columns aligned to the fiber direction. Before placement of the grid, the skin was shaved, when 127
needed, lightly abraded and cleansed with 70% ethanol. The electrode-skin contact was improved by conductive 128
paste (SpesMedica, Battipaglia, Italy). The HDEMG signals were recorded in monopolar recordings with a 129
multichannel amplifier (3dB bandwidth, 10-500 Hz; EMG-USB2+ multichannel amplifier, OT Bioelettronica, 130
Torino, Italy). The EMG and force signals were concurrently sampled at 2048 samples/s, with 12 bits per 131
sample. 132
6
Interference EMG signal analysis
133
HDEMG signals were digitally band-pass filtered with a 20-500 Hz Butterworth filter. Double differential signals 134
(DD-HDEMG) were obtained from the monopolar recordings along the fiber direction (columns of the grid). The 135
DD-HDEMG recordings were then inspected and the six channels with the highest cross-correlation in 136
propagation were selected. From these channels, we computed MFCV, median frequency (MDF), and root mean 137
square amplitude (RMS) from intervals of 500 ms (Fig 1. B). The MFCV estimation was obtained with a 138
multichannel maximum-likelihood algorithm that was previously shown to provide estimates with an associated 139
standard deviation <0.1 ms-1 (26). The MDF was computed from an estimate of the power spectrum based on 140
the periodogram (23). The values of RMS and MDF estimated from the six DD-HDEMG channels used for 141
MFCV estimation were averaged. Moreover, bipolar RMS and MDF signals were also derived from a bipolar 142
recording with larger electrodes. For this purpose, the monopolar signals from two sets of five neighbor 143
electrodes in the grid (with the central electrodes corresponding to those used for global MFCV analysis) were 144
averaged to derive an approximation of two EMG signals recorded by large electrodes. These two EMG signals 145
were differentiated to obtain a bipolar derivation with an interelectrode distance of 1.6 cm. This derivation will be 146
referred to as large bipolar EMG. 147
Motor unit analysis
148
HDEMG signals were decomposed into single motor unit action potentials (MUAPs) by convolutive blind source 149
separation (44, 50). This approach has been previously validated and guarantees high accuracy in the 150
identification of motor unit discharges for the tibialis anterior muscle at least up to 70% MVC force (20, 35, 50). 151
The decomposition accuracy was assessed with the silhouette measure (SIL) with a threshold of SIL> 0.90 (50). 152
The double differential MUAP waveforms were extracted by spike averaging, triggered with the discharge 153
timings of the decomposed motor units over intervals of 15 ms (Fig 1.D) (15). A custom MATLAB (Mathworks, 154
Natic, MA) program was used to visually display the MUAPs in the two-dimensional array and a minimum of 155
three up to a maximum of six channels were manually selected for each individual MUAP estimates (MUCV, 156
MDFMU, and RMSMU). The EMG channel selection criterion for individual MUAP properties was the maximum 157
cross-correlation between channels, as for the global EMG estimates. The channels automatically selected with 158
this criterion were manually inspected. In a few cases, the action potentials were influenced by end-of-fiber 159
components despite shape similarity and high cross-correlation. In these rare cases, the channels were 160
7 manually re-selected to maximize propagation. Fig. 1D shows an example of motor unit action potential and 161
channel selection for the computation of the motor unit properties (the channels highlighted in bold are selected 162
for the analysis). MUCV, MDFMU and RMSMU were calculated with the same algorithms used for the global EMG 163
estimates applied to the single motor unit action potentials (see above). Finally, the average motor unit 164
discharge rate and voluntary force in ankle-dorsi-flexion (%MVC) were computed. 165
Regression analysis and statistics
166
Subject-specific correlations between global EMG and single motor unit variables with the respective joint torque 167
were assessed with Pearson statistics. The slope of the regression lines between global EMG variables and joint 168
torque (e.g., rate of change per %MVC) was correlated with the slope of the regression lines between motor unit 169
variables and recruitment thresholds. The same procedure was used to assess the relations between the 170
amplitude and power spectral frequencies to the rate of change in MUCV. Paired sample t-tests were used to 171
assess differences in the intercepts between global and single motor unit properties. Statistical analyses were 172
performed using MATLAB and statistical significance was accepted for P values smaller than 0.05. Results are 173
reported as mean and standard deviation (SD). 174 175 RESULTS 176 HDEMG decomposition 177
The total number of decomposed motor units was 537 with an average of 41 (21) motor units per subject. The 178
decomposition accuracy corresponded to an average SIL of 0.93 (0.02), indicating high accuracy in the 179
identification of discharge timings. The mean discharge rate was 15.67 (4.75) pulses per second. 180
EMG variables and force
181
Global EMG estimates of conduction velocity and amplitude increased with force in all the tested subjects (R2 182
mean, (SD) and [range], MFCV = 0.81 (0.12), [0.60-0.90], RMSGLO = 0.88 (0.03), [0.82-0.94], p<0.001, Fig 2B, 183
Table 1). Conversely, the median frequency of the interference EMG signal was correlated with force only in 184
some subjects (R2= 0.27 (0.21) Table 1., Fig 3D). Moreover, when the median frequency was significantly 185
associated with force, the correlation was very weak (Fig 3D, Table 1.). 186
8 At the motor unit level, the progressive recruitment of motor units corresponded to a linear increase in MUCV in 187
all the tested subjects (R2 = 0.64 (0.14) [0.41-0.94], p<0.001, Fig 3A, Table 1.). Conversely, the median 188
frequency and amplitude of the motor unit action potentials showed highly variable strengths of correlation with 189
motor unit recruitment thresholds (R2 mean and (SD), MDFMU = 0.11 (0.11), RMSMU = 0.34 (0.29), Fig 2C,E). 190
Moreover, in the cases when the amplitude and the spectral frequencies of individual motor unit action potentials 191
were significantly correlated with recruitment thresholds, the relations were weak (Fig 2C,E, Table 1). 192
Subject-specific regression values (R2,significance, intercepts, and slopes) of global variables when correlated 193
with joint force and single motor unit variables with respect to motor unit recruitment thresholds are reported in 194
the Tables 1-3. 195
Recruitment Thresholds and EMG variables
196
We studied the associations between the rate of change of motor unit variables with recruitment threshold and 197
the rate of change in EMG global variables with joint force. For this purpose, the rate of change in motor unit 198
variables as a function of recruitment thresholds was correlated with the rate of change in global EMG variables 199
with respect to force. These relations indicate the level of association between motor unit recruitment and global 200
EMG analysis. 201
The rate of change in the average conduction velocity of the action potentials along the muscle fibers (MFCV) 202
predicted well the progressive increase in single motor unit conduction velocities with respect to motor unit 203
recruitment thresholds (R2 = 0.71, p<0.001, Fig 3A-C). The rate of change in global EMG median frequencies 204
was also significantly correlated with the rate of change in single motor unit median frequency, but with a weaker 205
relation (R2 = 0.36, p<0.05, Fig 3B). A similar correlation was found when the EMG median frequency was 206
correlated with the median frequency of individual motor unit action potentials from the bipolar electrodes (R2 = 207
0.30; p=0.05). 208
The relations between amplitude of the surface EMG and the respective motor unit action potential amplitudes 209
were highly variable (Fig 3C). For example, when subject #11 was removed from the correlation statistics 210
between rate of change in EMG global amplitude and rate of change in the single motor unit amplitudes (Fig 211
3C), the Pearson P value was not significant (R2 = 0.10, P = 0.30). The negative association between motor unit 212
action potential amplitude and global EMG activity was due to the large variability in action potential amplitude 213
9 when analyzed as a function of recruitment thresholds (Fig 2E). Similarly, global and single motor unit
214
amplitudes from the large bipolar EMG were not correlated (R2 = 0.01 p>0.05). Therefore, the monotonic 215
increase in global EMG amplitude was not correlated to the progressive motor unit recruitment. 216
The amplitude and spectral frequencies of the EMG and of single motor unit action potentials were correlated 217
with the rate of change in MUCV with respect to recruitment thresholds (Fig. 4. A-D). Interestingly, the rate of 218
change in single motor unit median frequency was correlated with the rate of change in motor unit conduction 219
velocity(Fig 4A, p<0.05), despite the fact that the increase the EMG spectral frequencies did not predict the 220
changes in MUCV (Fig 4B, p>0.05). It is important to add that albeit the increase in single motor unit median 221
frequency was correlated with the rate of change in MUCV, the relations between motor unit spectral estimates 222
and recruitment thresholds were highly variable between subjects (Fig 2C, Table 1). 223
Further, the monotonic increase in global EMG amplitude did not relate to the progressive recruitment of motor 224
units (p>0.05 Fig 4D) which agrees with the dissociation between the rate of change in global EMG amplitude 225
and the rate of change in single motor unit amplitudes (see Recruitment Thresholds and EMG variables). 226
Similarly, the rate of change in motor unit action potential amplitude was not correlated with the rate of change in 227
MUCV (p>0.05, Fig 4B). These two variables were also not correlated when using the large bipolar EMG 228
(p>0.05; R2=0.01). Overall, the only global EMG variable that predicted the progressive recruitment of motor 229
units was the rate of change in average muscle fiber conduction velocity (Fig 2.A-B Fig. 3.A). Moreover, the 230
initial values for single motor unit conduction velocity and for the average muscle fiber conduction velocity were 231
not statistically different (intercepts mean (SD), MUCV = 3.88 (0.35), MFCV = 3.77 (0.35) m/s; paired t-test, 232 p<0.001, Table 2). 233 234 DISCUSSION 235
We have experimentally analyzed the relations between motor unit recruitment and global EMG variables. 236
Global and single motor unit estimates were related with the respective motor unit properties during recruitment. 237
The only variable that was positively associated with the progressive recruitment of motor units was the average 238
conduction velocity of motor unit action potentials along the muscle fibers, as estimated from the interference 239
EMG. Conversely, the amplitude and power spectral frequencies of the surface EMG signal were largely variable 240
among subjects and not significantly correlated with motor unit recruitment. 241
10
Motor unit recruitment and global EMG estimates
242
Global EMG estimates have been extensively used for the analysis of the neuromuscular function. However, the 243
interpretation of EMG features has also been debated (12, 24, 25, 51, 58), primarily due to the associations 244
between characteristics of the interference EMG signal and motor unit behavior. For example, the power spectral 245
frequencies have been used to infer MFCV and motor unit recruitment in several conditions (5, 40, 42, 46, 58, 246
61, 62), albeit these associations were demonstrated only for steady contractions (2). Similarly, the amplitude of 247
the surface EMG is widely used to assess the neural drive to muscles, but the underlying contribution of single 248
motor units to global EMG amplitude remains unclear. The challenges in interpretation of global EMG variables 249
depend on the difficulty to experimentally identify large populations of motor units. Therefore, the relations 250
between motor unit population behavior and global EMG estimates with respect to joint force were previously 251
mainly based on simulation studies. Here, we assessed for the first time these relations experimentally for the 252
full recruitment range of the tibialis anterior muscle. We assessed the properties of individual motor unit action 253
potentials for interpreting the influence of motor unit behavior on the surface EMG features. 254
Conduction velocity 255
It has been previously suggested that the increase in MFCV during voluntary force contractions is related to 256
progressive recruitment of larger, higher-threshold motor units (1). Following stimulation of single motor axons in 257
the tibialis anterior muscle, a significant correlation between MUCV and motor unit mechanical properties was 258
found (1). This strong correlation suggested that the propagation velocity of action potentials along muscle fibers 259
can be considered as a size principle parameter (1). This result is due to the association between fiber diameter 260
and conduction velocity (7, 29). However, due to classic technical limitations, it has not been possible to relate 261
MUCV and recruitment thresholds for large populations of motor units. 262
In the present study, a strong correlation between MUCV and recruitment threshold was found. This association 263
is in agreement with previous human and animal research that indirectly correlated the recruitment threshold of 264
motor neurons to muscle fiber properties in the muscle units. Indeed, in human stimulation studies (1), during 265
voluntary force contractions (10, 11, 22, 30, 45), and in animal studies (9, 29, 31, 32, 60), a strong correlation 266
between size of the motor unit and motor unit mechanical properties has been observed. However, contrary to 267
all previous research, this is first study that provides a systematic association between the voluntary recruitment 268
11 of motor units and muscle unit property. The relation between recruitment threshold and MUCV reported in the 269
present study underlies the association between spinal (motor neuron size) and muscular properties (muscle 270
fiber diameters in muscle units) (8, 32, 33). 271
The study of MUCV requires the decomposition of a surface EMG signal, thus it is limited to controlled laboratory 272
conditions, mainly in isometric slow-force contractions (20). Conversely, the average propagation velocity of 273
action potentials along muscle fibers can be measured during a wide range of experimental conditions from the 274
interference EMG (4, 18, 22, 53). The present study showed that the rate of change of average MFCV with 275
respect to force is strongly correlated to the rate of change of individual motor unit MUCV with respect to 276
recruitment thresholds (Fig 3. A.). This experimental observation implies that average MFCV during increasing 277
force contractions can be used to assess the progressive recruitment of motor units. Despite MFCV has indeed 278
been used for this purpose in dynamic exercises in previous studies, e.g., (4, 22, 53), the current study directly 279
proves that the trends of MUCV can be predicted from the global analysis of the EMG by MFCV. Moreover, there 280
was no difference in the initial value for MUCV and MFCV estimates. This observation confirms that the 281
estimates of MFCV for low forces represents an accurate average of the conduction velocity of the lower 282
threshold motor units, as indicated in Table 2. 283
Power spectral frequencies
284
The relations between EMG spectral variables and motor unit recruitment received substantial attention in the 285
past decades (19, 42, 58, 62). Simulation and animal studies were conducted to investigate the association 286
between EMG frequency components to the underlying motor unit activity (19, 40, 42, 58). 287
The use of EMG spectral analysis as a motor unit recruitment parameter is based on the theoretical prediction 288
that the conduction velocity of an action potential scales the power spectrum of the action potential waveform (5, 289
19, 42, 46, 58). Further, previous research showed an association between MDF and MFCV during fatiguing 290
contractions (2). However, when the power spectral frequencies were assessed during isometric linearly 291
increasing force contractions, the results were largely different among studies. In some studies, MDF increased 292
with force (48, 56), whilst in other it remained constant (38, 52), or even decreased (55, 63). In the present 293
study, we report the same large variability among subjects as seen in previous studies (e.g., Table 1-3). These 294
differences across subjects may be explained by the volume conductor and random position of muscle units 295
12 within the muscle tissue. For example, a large, high-threshold motor unit with fibers located deep in the muscle 296
may lower the frequency content of the EMG and cause a decrease in power spectral frequencies despite a high 297
conduction velocity (e.g., Fig 1D-F). 298
When individual motor unit spectral variables were related to motor unit recruitment thresholds, a large variability 299
between subjects was still found (Fig 4C). These results are in agreement with the theoretical and simulation 300
predictions (19, 24, 25). Indeed, the association between conduction velocity and power spectral frequencies at 301
the level of individual motor units is only valid for relative changes, such as those occurring during sustained 302
fatiguing contractions, but not between different motor units, as directly proven experimentally in this study (Fig. 303
4A). Further, the interference EMG spectral frequencies were associated to the spectral frequencies of individual 304
motor unit action potentials, as theoretically predicted. Indeed, the discharge rates of motor units have a smaller 305
impact on the spectral components of the interference EMG than the shapes of the action potential waveforms 306
(25), which explains the experimental association between single motor unit action potential and interference 307
EMG spectral properties (Fig. 3B). These results indicate that the claims that the volume conductor effect does 308
not impact the association between conduction velocity and EMG spectral properties (62) are not substantiated. 309
A significant correlation was found between the rate of change of single motor unit power spectral frequencies 310
and that of MUCV (Fig. 4A) (19, 42). However, the correlation was weak and variable among subjects, 311
indicating the effects of the volume conductor, discussed above, when making absolute rather than relative 312
comparisons. Indeed, as a consequence of the high variability in single motor unit spectral frequencies (Fig 2. E 313
Table 1), global EMG spectral frequencies did not correlate with torque consistently (Fig 2. D Table 1). This 314
result clearly indicates that the relation between EMG spectral frequencies and force cannot be used to test 315
differences in motor unit recruitment among subjects, during exercise/learning interventions or in pathology (34, 316
40, 41, 59, 61, 62). For example, the peak in EMG power spectral frequency during an increasing force 317
contraction does not correspond to the end of motor unit recruitment, but rather depends on characteristics of 318
the volume conductor and locations of the motor units in the muscle tissue. 319
Amplitude
320
EMG amplitude systematically increased with force in all subjects (Fig 2. F, Table 1), which is theoretically 321
predicted (25) and well in agreement with a vast literature (e.g., 34, 37, 40, 44). However, at the single motor unit 322
13 level, the amplitude of the motor unit action potentials showed a relation with force that differed greatly among 323
subjects (Fig 2. E, Table 1). For example, the action potential of a motor unit recruited at 24.9% MVC shows a 324
significant larger size when compared to a motor unit recruited at 63.9 % MVC (Figure 1D-F). Further, the rate 325
of change in global EMG amplitude was only weakly correlated with the rate of change in single motor unit action 326
potential amplitudes with recruitment threshold (Fig 4. C), as it was anticipated in previous simulations studies 327
(17, 37). For example, in Fig. 1, the motor unit recruited at 24% MVC had an action potential with greater 328
amplitude compared to the higher threshold motor unit recruited at 64% MVC. These associations between the 329
size of the motor unit action potential and the EMG amplitude suggest that the amplitude of the EMG signal does 330
not only reflect recruitment and therefore it is not indicative of a specific recruitment order. Indeed, the increase 331
in the interference EMG amplitude would be observed with any type of recruitment strategy due to the monotonic 332
increase in the discharge rate of motor units with force. Further, motor unit synchronization also influences the 333
relation between EMG amplitude and motor unit action potentials, as previously shown in simulation studies (64). 334
The weak associations between EMG amplitude and progressive motor unit recruitment previously reported in 335
several simulation studies and now experimentally shown in large populations of motor units further strengthen 336
the evidence that global and motor unit EMG amplitude should not be used to test the neural strategies of 337
muscle control. 338
Conclusion
339
We have identified large populations of motor units by using high-density EMG techniques and we have 340
associated the motor unit properties to force and to the features of the interference EMG. The results have 341
clarified in a direct experimentally way the nature and strengths of long-discussed associations between 342
properties of the interference EMG and the neural strategies of muscle control. Whereas the spectral properties 343
of the surface EMG did not correlate reliably with motor unit recruitment, the average conduction velocity of 344
action potentials as estimated from the interference EMG was a good predictor of motor unit recruitment. This 345
association may be used for inferring recruitment strategies in conditions when a full EMG decomposition into 346
individual motor unit activity is not possible, such as in fast dynamic tasks. Conversely, the use of spectral EMG 347
analysis for inferring recruitment strategies should be abandoned. 348
349 350
14 Reference
351
1. Andreassen S, Arendt-Nielsen L. Muscle fibre conduction velocity in motor units of the human anterior 352
tibial muscle: a new size principle parameter. J Physiol 391: 561–571, 1987. 353
2. Arendt-Nielsen L, Mills K. The relationship between mean power frequency of the EMG spectrum and 354
muscle fibre conduction velocity. Electroencephalogr Clin Neurophysiol 60: 130–134, 1985. 355
3. Arendt-Nielsen L, Zwarts MJ. Measurement of Muscle Fiber Conduction Velocity in Humans: 356
Techniques and Applications. J Clin Neurophysiol 6: 173–190, 1989. 357
4. Bazzucchi I, De Vito G, Felici F, Dewhurst S, Sgadari A, Sacchetti M. Effect of exercise training on 358
neuromuscular function of elbow flexors and knee extensors of type 2 diabetic patients. J Electromyogr 359
Kinesiol 25: 815–823, 2015.
360
5. Bernardi M, Solomonow M, Nguyen G, Smith A, Baratta R. Motor unit recruitment strategy changes 361
with skill acquisition. Eur J Appl Physiol Occup Physiol 74: 52–59, 1996. 362
6. Bigland-Ritchie B, Donovan EF, Roussos CS. Conduction velocity and EMG power spectrum changes 363
in fatigue of sustained maximal efforts. J Appl Physiol 51: 1300–1305, 1981. 364
7. Blijham PJ, ter Laak HJ, Schelhaas HJ, van Engelen BGM, Stegeman DF, Zwarts MJ. Relation 365
between muscle fiber conduction velocity and fiber size in neuromuscular disorders. J Appl Physiol 100: 366
1837–1841, 2006. 367
8. Burke RE. Motor units: anatomy, physiology, and functional organization. Handb Physiol - Nerv Syst 543: 368
345–422, 2011. 369
9. Burke RE, Levine DN, Tsairis P, Zajac FE. Physiological types and histochemical profiles in motor units 370
of the cat gastrocnemius. J Physiol 234: 723–748, 1973. 371
10. Van Cutsem M, Duchateau J, Hainaut K. Changes in single motor unit behaviour contribute to the 372
increase in contraction speed after dynamic training in humans. J Physiol 513: 295–305, 1998. 373
11. Van Cutsem M, Feiereisen P, Duchateau J, Hainaut K. Mechanical properties and behaviour of motor 374
units in the tibialis anterior during voluntary contractions. Can J Appl Physiol 22: 585–597, 1997. 375
12. Enoka RM, Duchateau J. Inappropriate interpretation of surface EMG signals and muscle fiber 376
characteristics impedes progress on understanding the control of neuromuscular function. J Appl Physiol 377
119: 1516–1518, 2015. 378
13. Farina D. Counterpoint: Spectral properties of the surface EMG do not provide information about motor 379
unit recruitment and fiber type. J Appl Physiol 105: 1673–1674, 2008. 380
14. Farina D, Arendt-Nielsen L, Graven-Nielsen T. Effect of temperature on spike-triggered average torque 381
and electrophysiological properties of low-threshold motor units. J Appl Physiol 99: 197–203, 2005. 382
15. Farina D, Arendt-Nielsen L, Merletti R, Graven-Nielsen T. Assessment of single motor unit conduction 383
velocity during sustained contractions of the tibialis anterior muscle with advanced spike triggered 384
averaging. J Neurosci Methods 115: 1–12, 2002. 385
16. Farina D, Arendt-Nielsen L, Merletti R, Graven-Nielsen T. Effect of experimental muscle pain on motor 386
unit firing rate and conduction velocity. . 387
17. Farina D, Cescon C, Negro F, Enoka RM. Amplitude Cancellation of Motor-Unit Action Potentials in the 388
Surface Electromyogram Can Be Estimated With Spike-Triggered Averaging. J Appl Physiol 100: 431– 389
400, 2008. 390
18. Farina D, Ferguson RA, Macaluso A, De Vito G. Correlation of average muscle fiber conduction 391
velocity measured during cycling exercise with myosin heavy chain composition, lactate threshold, and 392
VO2max. J Electromyogr Kinesiol 17: 393–400, 2007. 393
19. Farina D, Fosci M, Merletti R. Motor unit recruitment strategies investigated by surface EMG variables. 394
15
J Appl Physiol 92: 235–247, 2002. 395
20. Farina D, Holobar A. Characterization of Human Motor Units from Surface EMG Decomposition. Proc 396
IEEE 104: 353–373, 2016.
397
21. Farina D, Holobar A, Merletti R, Enoka RM. Decoding the neural drive to muscles from the surface 398
electromyogram. Clin Neurophysiol 121: 1616–1623, 2010. 399
22. Farina D, Macaluso A, Ferguson RA, De Vito G. Effect of power, pedal rate, and force on average 400
muscle fiber conduction velocity during cycling. J Appl Physiol 97: 2035–2041, 2004. 401
23. Farina D, Merletti R. Comparison of algorithms for estimation of EMG variables during voluntary 402
isometric contractions. J Electromyogr Kinesiol 10: 337–349, 2000. 403
24. Farina D, Merletti R, Enoka RM. The extraction of neural strategies from the surface EMG. J Appl 404
Physiol 96: 1486–1495, 2004.
405
25. Farina D, Merletti R, Enoka RM. The extraction of neural strategies from the surface EMG: an update. J 406
Appl Physiol 117: 1215–1230, 2014. 407
26. Farina D, Muhammad W, Fortunato E, Meste O, Merletti R, Rix H. Estimation of single motor unit 408
conduction velocity from surface electromyogram signals detected with linear electrode arrays. Med Biol 409
Eng Comput 39: 225–236, 2001.
410
27. Farina D, Negro F, Muceli S, Enoka RM. Principles of motor unit physiology evolve with advances in 411
technology. Physiology 31: 83–94, 2016. 412
28. González-Izal M, Malanda A, Gorostiaga E, Izquierdo M. Electromyographic models to assess muscle 413
fatigue. J Electromyogr Kinesiol 22: 501–512, 2012. 414
29. Håkansson CH. Conduction Velocity and Amplitude of the Action Potential as Related to Circumference 415
in the Isolated Fibre of Frog Muscle. Acta Physiol Scand 37: 14–34, 1956. 416
30. Heckman CJ, Enoka RM. Motor Unit. Compr Physiol 2: 2629–2682, 2012. 417
31. Henneman E. Relation between size of neurons and their susceptibility to discharge. Science 126: 1345– 418
7, 1957. 419
32. Henneman E, Olson C. Relations between structure and function in the design of skeletal muscles. J 420
Neurophysiol 28: 581–598, 1965.
421
33. Henneman E, Somjen G, Carpenter DO. Functional Significance of Cell Size in Spinal Motoneurons. J 422
Neurophysiol 28: 560–580, 1965. 423
34. Herda T, Siedlik J, Trevino M, Cooper M, Weir J. Motor unit control strategies of endurance versus 424
resistance trained individuals. Muscle Nerve : 1–23, 2015. 425
35. Holobar A, Minetto M a, Farina D. Accurate identification of motor unit discharge patterns from high-426
density surface EMG and validation with a novel signal-based performance metric. J Neural Eng 11: 427
16008, 2014. 428
36. Holtermann A, Roeleveld K. EMG amplitude distribution changes over the upper trapezius muscle are 429
similar in sustained and ramp contractions. Acta Physiol 186: 159–168, 2006. 430
37. Keenan KG, Farina D, Merletti R, Enoka RM. Amplitude cancellation reduces the size of motor unit 431
potentials averaged from the surface EMG. J Appl Physiol 100: 1928–1937, 2006. 432
38. Komi P V., Viitasalo JHT. Signal Characteristics of EMG at Different Levels of Muscle Tension. Acta 433
Physiol Scand 96: 267–276, 1976.
434
39. Lawrence JH, De Luca CJ. Myoelectric signal versus force relationship in different human muscles. J 435
Appl Physiol 54: 1653–1659, 1983.
436
40. Lee SSM, de Boef Miara M, Arnold AS, Biewener AA, Wakeling JM. EMG analysis tuned for 437
16 determining the timing and level of activation in different motor units. J Electromyogr Kinesiol 21: 557– 438
565, 2011. 439
41. Li X, Shin H, Zhou P, Niu X, Liu J, Rymer WZ. Power spectral analysis of surface electromyography 440
(EMG) at matched contraction levels of the first dorsal interosseous muscle in stroke survivors. Clin 441
Neurophysiol 125: 988–994, 2014. 442
42. Lindström LH, Magnusson RI. Interpretation of Myoelectric Power Spectra: A Model and Its 443
Applications. Proc IEEE 65: 653–662, 1977. 444
43. Lippold OCJ. The relation between integrated action potentials in a human muscle and its isometric 445
tension. J Physiol 117: 492–499, 1952. 446
44. Martinez-Valdes E, Negro F, Laine CM, Falla D, Mayer F, Farina D. Tracking motor units longitudinally 447
across experimental sessions with high-density surface electromyography. J Physiol 44, 2016. 448
45. Masuda T, De Luca CJ. Recruitment threshold and muscle fiber conduction velocity of single motor 449
units. J Electromyogr Kinesiol 1: 116–123, 1991. 450
46. Merletti R, Knaflitz M, De Luca CJ. Myoelectric manifestations of fatigue in voluntary and electrically 451
elicited contractions. J Appl Physiol 69: 1810–1820, 1990. 452
47. Milner-Brown HS, Stein RB. The relation between the surface electromyogram and muscular force. J 453
Physiol 246: 549–569, 1975. 454
48. Moritani T, Muro M. Motor unit activity and surface electromyogram power spectrum during increasing 455
force of contraction. Eur J Appl Physiol 56: 260–265, 1987. 456
49. Muceli S, Poppendieck W, Negro F, Yoshida K, Hoffmann KP, Butler JE, Gandevia SC, Farina D. 457
Accurate and representative decoding of the neural drive to muscles in humans with multi-channel 458
intramuscular thin-film electrodes. J Physiol 17: 3789–3804, 2015. 459
50. Negro F, Muceli S, Castronovo AM, Holobar A, Farina D. Multi-channel intramuscular and surface 460
EMG decomposition by convolutive blind source separation. J Neural Eng 13: 26027, 2016. 461
51. Neyroud D, Kayser B, Place N. Commentaries on Viewpoint : Inappropriate interpretation of surface 462
EMG signals and muscle fiber characteristics impedes understanding of the control of neuromuscular 463
function. J Appl Physiol 119: 8750, 2015. 464
52. Petrofsky JS, Lind AR. Frequency analysis of the surface electromyogram during sustained isometric 465
contractions. Eur J Appl Physiol 43: 173–182, 1980. 466
53. Pozzo M, Merlo E, Farina D, Antonutto G, Merletti R, Di Prampero PE. Muscle-fiber conduction 467
velocity estimated from surface EMG signals during explosive dynamic contractions. Muscle and Nerve 468
29: 823–833, 2004. 469
54. Qi L, Wakeling JM, Green A, Lambrecht K, Ferguson-Pell M. Spectral properties of electromyographic 470
and mechanomyographic signals during isometric ramp and step contractions in biceps brachii. J 471
Electromyogr Kinesiol 21: 128–135, 2011.
472
55. Rainoldi A, Galardi G, Maderna L, Comi G, Lo Conte L, Merletti R. Repeatability of surface EMG 473
variables during voluntary isometric contractions of the biceps brachii muscle. J Electromyogr Kinesiol 9: 474
105–119, 1999. 475
56. Sbriccoli P, Bazzucchi I, Rosponi A, Bernardi M, De Vito G, Felici F. Amplitude and spectral 476
characteristics of biceps Brachii sEMG depend upon speed of isometric force generation. J Electromyogr 477
Kinesiol 13: 139–147, 2003. 478
57. da Silva RA, Vieira ER, Cabrera M, Altimari LR, Aguiar AF, Nowotny AH, Carvalho AF, Oliveira MR. 479
Back muscle fatigue of younger and older adults with and without chronic low back pain using two 480
protocols: A case-control study. J Electromyogr Kinesiol 25: 928–936, 2015. 481
58. Solomonow M, Baten C, Smit J, Baratta R, Hermens H, D’Ambrosia R, Shoji H. Electromyogram 482
17 power spectra frequencies associated with motor unit recruitment strategies. J Appl Physiol 68: 1177– 483
1185, 1990. 484
59. Tillin NA, Jimenez-Reyes P, Pain MTG, Folland JP. Neuromuscular performance of explosive power 485
athletes versus untrained individuals. Med Sci Sports Exerc 42: 781–790, 2010. 486
60. Tötösy de Zepetnek JE, Zung H V, Erdebil S, Gordon T. Innervation ratio is an important determinant 487
of force in normal and reinnervated rat tibialis anterior muscles. J Neurophysiol 67: 1385–403, 1992. 488
61. von Tscharner V, Nigg BM. Spectral properties of the surface EMG can characterize /do not provide 489
information about motor unit recruitment strategies and muscle fiber type. J Appl Physiol : 1671–1673, 490
2008. 491
62. Wakeling JM. Patterns of motor recruitment can be determined using surface EMG. J Electromyogr 492
Kinesiol 19: 199–207, 2009.
493
63. Westbury J, Shaughness T. Associations between spectral representation of the surface 494
electromyogram and fiber type distribution and size in human masseter muscle. Electroencephalogr Clin 495
Neurophysiol 27: 427–35, 1987.
496
64. Yao W, Fuglevand RJ, Enoka RM. Motor-unit synchronization increases EMG amplitude and decreases 497
force steadiness of simulated contractions. J Neurophysiol 83: 441–452, 2000. 498 499 500 501 502 503 504 505 506 507 508 509 510 511 512 513 514 515 516 517 518 519
18 Figure captions
520
Fig. 1. A. Example of an isometric linearly increasing (ramp) contraction (black line) up to 70% of maximal 521
voluntary force (MVC). Eight surface EMG signals from one column of the matrix are reported (inter-electrode 522
distance 8 mm). Clear increase in the EMG activity as the muscle is generating force can be observed. B. An 523
example of two EMG time windows (500 ms) used for the extraction of global EMG features. Clear propagation 524
of several motor unit action potentials (MUAPs) can be observed. C. High-density surface grids (64 electrodes, 525
gold-coated). The motor unit comprising the EMG signal were decomposed into single MUAP trains and 526
successively the first 50 discharge timings were used to trigger the MUAP signatures in the high-density surface 527
electromyogram. D. The signature of a motor unit propagating in the matrix recruited at 24.9 % MVC can be 528
seen. The lower left column of the matrix is removed in order to improve figure clarity. E-F. A low and high 529
threshold motor unit propagating in the matrix. Only the column of the matrix which corresponded to clearest 530
MUAP propagation is reported. The high threshold MUAP propagates at a greater velocity with respect to the 531
low threshold motor unit. Moreover, the motor unit recruited at 24.9% MVC (D) has action potentials with greater 532
amplitude with respect to the high threshold motor unit (F). The action potentials highlighted in bold correspond 533
to the channels selected for the estimates of CV, MDF and RMS (D-F). (*RT = Recruitment Thresholds, *CV = 534
motor unit conduction velocity, *MDF = median frequency, *RMS = root mean square). 535
536
Fig. 2. A. Motor unit conduction velocities (MUCV, m/s) plotted as a function of recruitment thresholds (%MVC, 537
537 motor units), p<0.001. B. The average muscle fiber conduction velocity (MFCV, m/s) plotted against the 538
respective voluntary force, p<0.001. C. Individual motor unit median frequencies (MDFMU, Hz) plotted as a 539
function of motor unit recruitment thresholds (%). D. The average power spectra estimate of the interference 540
EMG (MDFGLO, Hz), signal plotted against muscular force. E. Single motor unit amplitudes (RMSMU, µV) plotted 541
as a function of recruitment thresholds F. Global EMG (RMSGLO, µV) amplitude against the respective voluntary 542
force, p<0.001. Each color corresponds to a specific subject. R2 mean and (standard deviation) for each subject 543
are given. 544
Fig. 3. A. Fig. 3. A. The rate of change in the average muscle fiber conduction velocity derived from the global 545
EMG signal (slope of the regression line between conduction velocity and force) is reported as a function of the 546
19 rate of change of single motor unit conduction velocities (e.g., slope of the regression line between motor unit 547
conduction velocity and recruitment threshold). B. The rate of change in the interference EMG median 548
frequencies per percentages of MVC plotted against the rate of change in single motor unit median frequencies 549
per percentages of motor unit recruitment thresholds. C. The rate of change in global EMG amplitudes per 550
percentages of MVC as a function of the rate of change in single motor unit amplitudes per percentages of 551
recruitment thresholds. Each color corresponds to a specific subject. ** = p<0.001, * = p<0.05. 552
553
Fig. 4. A-B. The rate of change in single motor unit spectral frequencies (MDF) and amplitudes (RMS), (e.g., 554
slope of the MDF and RMS regression lines per percentages of Recruitment Thresholds) was plotted against the 555
rate of change in single motor unit conduction velocities (MUCV) (e.g., slope of the regression lines per 556
percentages of Recruitment Thresholds). C-D The rate of change in global interference EMG median 557
frequencies (e.g., slope of the global MDF and RMS regression lines was correlated with the rate of change in 558
single motor unit conduction velocities). Each color corresponds to a specific subject. * = p<0.05. 559 560 561 562 563 564 565 566 567 568 569 570
20 571
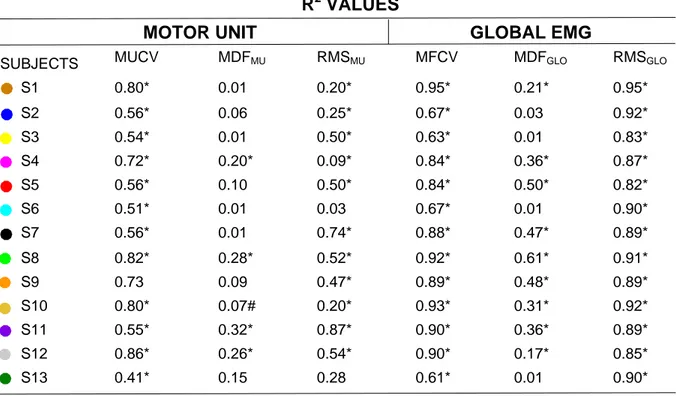
Table 1. Subject-specific coefficient of correlations (R2) values. Motor unit variables were correlated with 572
recruitment thresholds in percentages of MVC. Global EMG variables were correlated with force in percentages 573
of MVC. * = p<0.001, # = p<0.05. 574
R
2VALUES
MOTOR UNIT
GLOBAL EMG
SUBJECTS MUCV MDFMU RMSMU MFCV MDFGLO RMSGLO
S1 0.80* 0.01 0.20* 0.95* 0.21* 0.95* S2 0.56* 0.06 0.25* 0.67* 0.03 0.92* S3 0.54* 0.01 0.50* 0.63* 0.01 0.83* S4 0.72* 0.20* 0.09* 0.84* 0.36* 0.87* S5 0.56* 0.10 0.50* 0.84* 0.50* 0.82* S6 0.51* 0.01 0.03 0.67* 0.01 0.90* S7 0.56* 0.01 0.74* 0.88* 0.47* 0.89* S8 0.82* 0.28* 0.52* 0.92* 0.61* 0.91* S9 0.73 0.09 0.47* 0.89* 0.48* 0.89* S10 0.80* 0.07# 0.20* 0.93* 0.31* 0.92* S11 0.55* 0.32* 0.87* 0.90* 0.36* 0.89* S12 0.86* 0.26* 0.54* 0.90* 0.17* 0.85* S13 0.41* 0.15 0.28 0.61* 0.01 0.90* 575 576 577 578 579 580 581 582 583 584 585 586 587 588 589 590 591
21 592
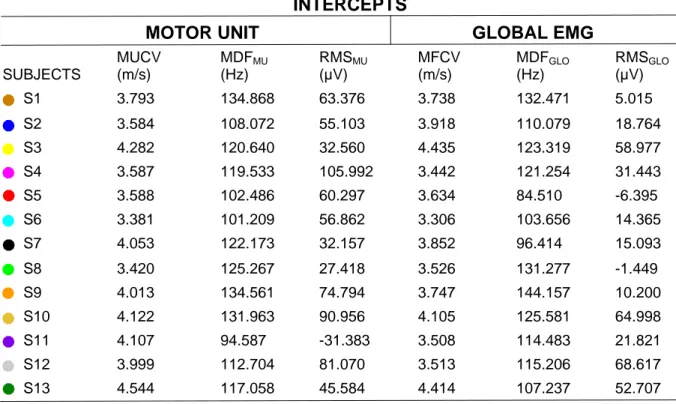
Table 2. Subject-specific intercepts values. Motor unit intercepts values represent the initial value from the 593
regression line between motor unit variables and motor unit recruitment thresholds. Global EMG variables 594
intercepts corresponded to the initial value of the regression line between global EMG and muscular force in 595
percentages of MVC. 596
INTERCEPTS
MOTOR UNIT
GLOBAL EMG
SUBJECTS MUCV (m/s) MDFMU (Hz) RMSMU (µV) MFCV (m/s) MDFGLO (Hz) RMSGLO (µV) S1 3.793 134.868 63.376 3.738 132.471 5.015 S2 3.584 108.072 55.103 3.918 110.079 18.764 S3 4.282 120.640 32.560 4.435 123.319 58.977 S4 3.587 119.533 105.992 3.442 121.254 31.443 S5 3.588 102.486 60.297 3.634 84.510 -6.395 S6 3.381 101.209 56.862 3.306 103.656 14.365 S7 4.053 122.173 32.157 3.852 96.414 15.093 S8 3.420 125.267 27.418 3.526 131.277 -1.449 S9 4.013 134.561 74.794 3.747 144.157 10.200 S10 4.122 131.963 90.956 4.105 125.581 64.998 S11 4.107 94.587 -31.383 3.508 114.483 21.821 S12 3.999 112.704 81.070 3.513 115.206 68.617 S13 4.544 117.058 45.584 4.414 107.237 52.707 597 598 599 600 601 602 603 604 605 606 607 608 609 610 611 612
22 613
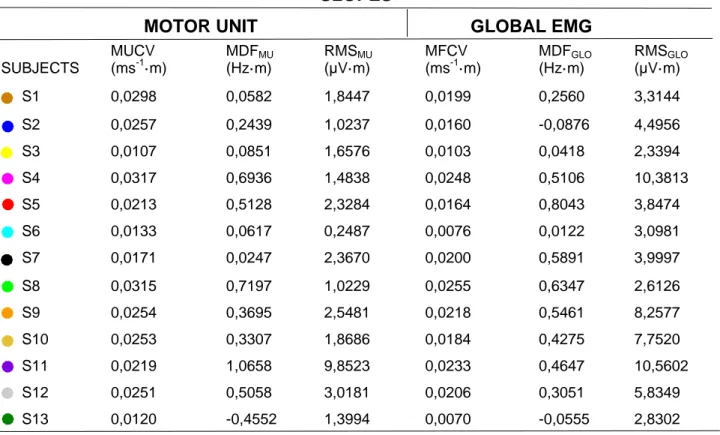
Table 3. Subject-specific rate of change in motor unit and global EMG variables when correlated as a function of 614
either recruitment thresholds or force (e.g., regression slope values per percentages of MVC). 615
SLOPES
MOTOR UNIT
GLOBAL EMG
SUBJECTS MUCV (ms-1·m) MDFMU (Hz·m) RMSMU (µV·m) MFCV (ms-1·m) MDFGLO (Hz·m) RMSGLO (µV·m) S1 0,0298 0,0582 1,8447 0,0199 0,2560 3,3144 S2 0,0257 0,2439 1,0237 0,0160 -0,0876 4,4956 S3 0,0107 0,0851 1,6576 0,0103 0,0418 2,3394 S4 0,0317 0,6936 1,4838 0,0248 0,5106 10,3813 S5 0,0213 0,5128 2,3284 0,0164 0,8043 3,8474 S6 0,0133 0,0617 0,2487 0,0076 0,0122 3,0981 S7 0,0171 0,0247 2,3670 0,0200 0,5891 3,9997 S8 0,0315 0,7197 1,0229 0,0255 0,6347 2,6126 S9 0,0254 0,3695 2,5481 0,0218 0,5461 8,2577 S10 0,0253 0,3307 1,8686 0,0184 0,4275 7,7520 S11 0,0219 1,0658 9,8523 0,0233 0,4647 10,5602 S12 0,0251 0,5058 3,0181 0,0206 0,3051 5,8349 S13 0,0120 -0,4552 1,3994 0,0070 -0,0555 2,8302 616
1 (s)
A. Tibialis anterior myoelectrical activity during an increasing force contraction
0 10 20 30 40 50 60 70 F o rc e (%) RT* = 24.9 (%) CV* = 4.41 (m/s) MDF* = 147 .80 (Hz) RMS* = 248.06 (µV) 6.19 (%) 3.82 (m/s) 120.95 (Hz) 115.75 (µV) 63.9 (%) 5.20 (m/s) 124.07 (Hz) 143.45 (µV) B. D. E. F.
Motor unit discharge times +
Spike triggered average
C.
Single motor unit action potential propagating in the matrix
Low threshold motor unit High threshold motor unit 2000 (µV) 25 (ms) a.u a.u