Forest Fire Modelling
Unione Europea UNIVERSITÀ DEGLI STUDI DI SALERNO
FONDO SOCIALE EUROPEO
Programma Operativo Nazionale 2007/2013
“Ricerca Scientifica, Sviluppo Tecnologico, Alta Formazione” Regioni dell’Obiettivo 1 – Misura III.4
“Formazione superiore ed universitaria”
Department of Industrial Engineering
Dottorato di Ricerca in Scienza e Tecnologie per
l’Industria Chimica, Farmaceutica e Alimentare
(XI Cycle-New Series)
FOREST FIRE MODELLING
Supervisor
Ph.D. student
Prof. Salvatore Vaccaro Luca Malangone
Scientific Committee
Prof. Paola Russo
Prof. Domingos Xavier Viegas
Ph.D. Course Coordinator
Acknowledgments
Over the past three years, several people have contributed in different ways to shape my research work. First of all, I would like to express my deepest gratitude to my supervisor, prof. Salvatore Vaccaro for giving me the opportunity to accomplish such a complex and very interesting field of study offering me support, encouragment, positive discussion, criticism and motivation to finish it.
I would like to truly thank prof. Paola Russo, my second supervisor, for the positive discussions and raccomandations for my work and for patiently sharing my ups and down throughout this time
Special thanks to prof. Domingos X. Viegas for approving and positively assessing my work, giving me support and a great deal of encouragment.
Thanks to prof. Paolo Ciambelli for his support and coordination activity. I would also like to thank all the present and former members of the department of Industrial Engineering for creating a very dynamic and positive working experience.
Last, but not least, my deepest gratitude goes to my family for supporting and lifting me up during the hard moments
List of References
1. Malangone L., Russo P., Vaccaro S., Viegas, DX (2012): Fire Behaviour
in Canyons due to symmetric and asymmetric ignitions. International
Congress "Fire Computer Modeling" October 18-19th, Santander (Spain) ISBN 978-84-86116-69-9.
2. Malangone L., Russo P., Vaccaro S.(2012): Simulation by a physical
model of fire spread within a relatively large domain with complex geometry. XXXV Meeting of the Italian Section of the Combustion
Institute, Milano, 10-12 Ottobre. doi:10.4405/35proci2012.III1, ISBN: 978-88-88104-14-0.
3. Malangone L., Russo P., Vaccaro S. (2011): Effects of wind and terrain
slope on flames propagation in a vegetative fuel bed. XXXIV Event of
the Italian Section of the Combustion Institute Roma, 24-26 October. doi:10.4405/34proci2011.III22, ISBN: 978-88-88104-13-3.
4. Malangone L., Russo P., Vaccaro S. (2011): Ruolo del carico di
combustibile superficiale nella propagazione di un incendio forestale.
Convegno Scientifico Nazionale Sicurezza nei Sistemi Complessi, VI Edizione, Bari 18-19-20 ottobre.
5. Malangone L., Russo P., Vaccaro S. (2011): The role of the terrain
geometry on the flames propagation through a vegetative fuel bed. In
MCS 7, Mediterranean Combustion Symposium, Chia Laguna, Cagliari, Sardinia, Italy, September 11-15, ISBN: 978-88-88104-12-6
6. Ciambelli P., Malangone L., Russo P., Vaccaro S. (2010): Preliminary
Modelling Study of Wildland Fires by WFDS. In: VI International
Conference on Forest Fire Research. Coimbra, 15-18 November, 2010. 7. Ciambelli P., Malangone L., Russo P., Vaccaro S. (2010). Preliminary
Study of Wildland Fires. In: Processes and Technologies for a Sustainable
Energy. Ischia, June 27-30, 2010, vol. unico. p. IV-3,1-IV-3,6, ISBN: 978-88-88104-11-9, doi: 10.4405/ptse2010.IV3
I
Contents
Chapter I - Forest fires and fire management
I
.1 Wildland fires as agents of damage of wooded areas 1I.1.1 European statistics 3
I.1.2 Global emissions of selected pyrogenic species 6 I.2 Management activities over fire prevention and suppression 7
I.3 Role of fire behaviour modelling 8
I.2 Aim of the work 9
I.3 Outline of the thesis 9
I.4 References 10
Chapter II - Literature review and main characteristics of the
prediction tools used for surface vegetation fires
II.1 Fundamentals of fire and combustion phenomenon 13
II.1.1 Fuel chemistry 15
II.1.2 Solid phase reactions: competing processes 16
II.1.3 Gas phase reactions 18
II.2 Physics of combustion 18
II.2.1 Advection or Fluid transport 19
II.2.2 Buoyancy, convection and turbulence 19
II.2.3 Radiant heat transfer 20
II.2.4 Firebrands (solid fuel transport) 20
II.2.5 Atmospheric interactions 21
II.2.6 Topographic interactions 21
II.3 Physical Models 21
II.3.1 Weber (1991) 22
II.3.2 AIOLOS-F (CINAR S.A., Greece) 23
II.3.3 FIRETEC (Los Alamos National Laboratory, USA) 23
II.3.4 Forbes (1997) 24
II.3.5 Grishin (Tomsk State University, Russia) 24 II.3.6 IUSTI (Institut Universitaire des Systemes
Thermiqes Industriels, France) 25
II
II.3.8 LEMTA (Laboratoire d’Énergétique et de
Mécanique Théorique et Appliquée, France) 27 II.3.9 UoS (University of Salamanca, Spain) 27 II.3.10 WFDS (National Institute of Safety
Technology, USA) 28
II.4 Discussion and summary 29
II.5 References 32
Chapter III - Forest fire modelling: basic equations
and numerical constraints
III.1 Physical mechanisms and characteristic length scales 37
III.2 Fundamental equations 41
III.3 Simulation conditions 43
III.3.1 Domain meshing 44
III.4 References 46
Chapter IV- Fire propagation on flat and sloped surface. Role of
the surface fuel in generating a crown fire
IV.1 Introduction 49
IV.2 Simulation conditions 50
IV.2.1 Flat and sloped terrain 50
IV.2.2 Forest stand domain 51
IV.3 Results and discussion 53
IV.3.1 Flat and sloped terrain 53
IV.3.2 Forest stand domain 61
IV.4 Conclusions 67
IV.5 References 68
Chapter V - Fire propagation across double-slope and
canyon configurations
V.1 Introduction 69
V.2 Simulation conditions 71
V.2.1 Double-slope domain 71
V.2.2 Canyon configuration 73
V.3 Results and discussion 73
V.3.1 Double-slope domain 73
III V.3.2.1 Effect of the position of the ignition source 81
V.3.2.1.1 Symmetric vs. asymmetric ignition:
qualitative comparison 82 V.3.2.1.2 Symmetric vs. asymmetric ignition:
quantitative comparison 83
V.4 Conclusions 89
V.5 References 90
Chapter VI - Simulation of fire spread within a relatively large
scale domain with complex geometry
VI.1 Introduction 93
VI.2 Simulation conditions 94
VI.3 Results and discussion 96
VI.4 Conclusions 97
VI.5 References 98
V
Index of figures
Figure I.1 Total area of fires burned in North America, Europe and CIS –
countries IFFN (2002). 2
Figure I.2 Burnt area in the Southern Member States 3 Figure I.3 Number of fires in the Southern Member States 3 Figure I.4 Average fire size in the Southern Member States 4
Figure I.5 The wildland fire triangle. 7
Figure II.1 Schematic of chemical structure of portion of neighbouring cellulose chains, indicating some of the hydrogen bonds (dashed lines) that may stabilise the crystalline form of cellulose (Source: Ball et al.
(1999) 15
Figure II.2 Degradation of wood by low-temperature and high-temperature
pathways 17
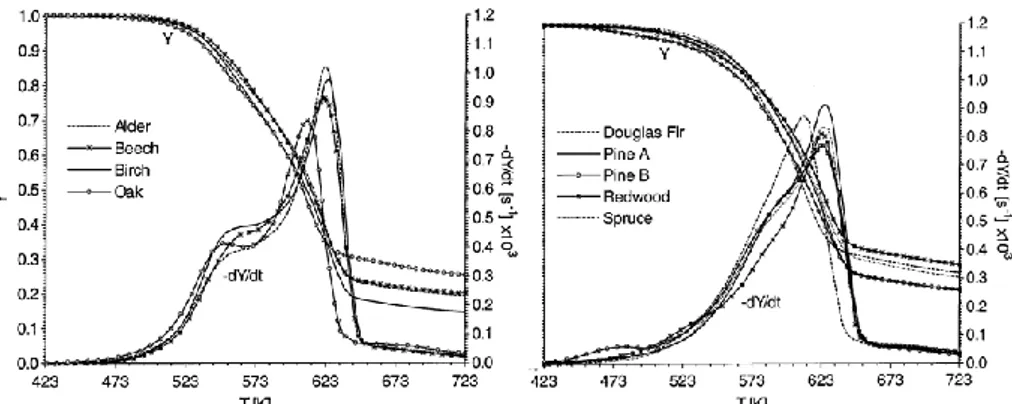
Figure II.3 Mass fraction and time derivative of the mass fraction as
functions of temperature for several softwoods 17 Figura III.1 Mechanisms of thermal degradation of vegetation 41 Figure III.2 Experimental fire and simulation (using WFDS) carried out
in a tall Douglas fir (Mell et al., 2009) 44
Figure IV.1 Configuration of the computational forest domain. d is the distance between the tree trunks. Wind is constant at the boundary
surface ( → ) and blows along x at 5 m/s. 51 Figure IV.2 Fire spreading on flat and sloped terrains in the absence of
wind. Colourbar for the temperatures in the gas phase (in
correspon-dence of y=0) is reported on the right. 53
Figure IV.3 Fire spreading on flat and slope terrains for wind blowing at 5 m/s along x. Colourbar for the temperatures in the gas phase (in cor-respondence of y=0) is reported on the right. 54 Figure IV. 4a (left column) Surfaces (m2) spanned by the fire in time (s)
at fixed domain inclinations (α) for different wind velocities (v in m/s) 56 Figure IV.4b (right column) Surfaces (m2) spanned by the fire in time (s)
VI
at fixed wind velocities (v) for different domain inclinations (slope) 56 Figure IV.5a (left) Influence of the terrain slope on the rate of spread
(ROS= Rl) in (m/s) at different wind velocities. 58 Figure IV.5a (right) Influence of wind velocity on the rate of spread
(ROS= Rl) in (m/s) at different terrain slopes. Symbols stand for results of simulations while curves are calculated by Eq. IV.6. 58 Figure IV.6a (left) Influence of the terrain slope on the rate of spread
(ROSl) in (m/s) at different wind velocities. 59 Figure IV.6b (right) Influence of wind velocity on the rate of spread
(ROSl) in (m/s) at different terrain slopes. Symbols stand for results of simulations. Lines represent the interpolating curves. 59 Figure IV.7 Time evolution of HRR for flat domain under calm (v=0 m/s)
and windy (v=4 m/s) conditions. 60
Figure IV.8a Distance spanned by the fire front at the ground level at different d for fixed ρF (1:ρF=0.90; 2:ρF=1.80; 3:ρF=2.70) (cfr. Table IV.2). Black lines mark the separation (x=5 in Figure IV.1) between the zone where only surface fuel existed and that where both fuels were
present
.
61
Figure IV.8b Distance spanned by the fire front at the ground level at different ρF for a fixed d (1: d=0; 2: d=-1; 3: d=1) (cfr. Table 2). Black lines mark the separation (x=5 in Figure 1) between the zone where only surface fuel existed and that where both fuels were present. 61 Figure IV.9 Time evolution of the temperature space profiles on the y=0
plane, for the case A1 of Table IV.2, during a surface to crown fire transition. Colourbar on the top is the same for each time step 62 Figure IV.10 Temperature space profiles at t=143.4 s on the y=0, y=-1
and y=-2 planes (cfr. Figure IV.1) for the case C2 of Table 2. Solid lines represent the sections of the tree stand cut by the y planes 63 Figure IV.11 x-component of the velocity field at 80 s in correspondence
of the base of the tree canopies (z=1m). (left): d= 3 m (case A1 of Table IV.3), (centre): d= 2 m (case B1 of Table IV.3) and (right): d= 4
(case C1 of Table IV.3). 64
Figure IV.12 Time evolution of the temperature space profiles on the z =0 plane. d=3 m. (left) ρF =0.90 kg/m3(case A1 of Table IV.3) and (right)
VII Figure IV.13 Time evolution of HRR. d=3 m. (blue line) ρF=0.90 kg/m3
(case A1 of Table IV.3) and (red line) ρF=2.70 kg/m3 (case A3 of
Table IV.3) 66
Figure V.1 Double-slope plane configuration. 71
Figure V.2 Dihedral plane during a fire test (Viegas 2010b) 72
Figure V.3 Canyon Configuration (β=δ= 40°) 73
Figure V.4 Comparison between the experimental and simulated
rate of spread for flames moving on plane b 74 Figure V.5 Comparison between the experimental and simulated
rate of spread for flames moving on plane a 74 Figure V.6 Evolution in time of the fire profiles. Red line marks the
changing in slope between the two faces forming the dihedral table. Time in seconds is reported for each profile. 75 Figure V.7 Heat Release Rate (HRR) vs. time on the plane a for β=-20°
and -40°. 76
Figure V.8. Heat Release Rate (HRR) vs. time on the plane a, at β= 20° and 40°. Plane a ignition time: 30s and 75s at β= 40° and 20°,
respectively 76
Figure V.9 Comparison between experimental and simulation results (MC=0.13). Dotted lines, at 78, 107 and 124 s, evidence the different fire contours between the experimental and simulation results. 77 Figure V.10 Comparison of burnt area growth in canyon configuration
between the experimental tests and the simulated results at different moisture contents. Exponential fitting curves are represented by solid
lines. 78
Figure V.11 Heat release rate profiles for canyon geometry at
different moisture content (MC) 79
Figure V.12 Pinus needles: Comparison between experimental (solid line)
and simulated results (solid+squares line) 80
Figure V.13 Fire simulation for the symmetric ignition. Frame times: 5s;
20s; 40s; 60s; 80s; 100s; 120s; 140s 82
Figure V.14 Fire simulation for the asymmetric ignition. Frame times: 50s; 130s; 210s; 280s; 320s; 340s; 380s; 400s; 420s; 460s; 500s; 550s. 82
VIII
Figure V.15 Time profiles of HRR for the cases of symmetric (right) and
asymmetric (left) ignition source. 83
Figure V.16 Fire shape evolution in time for symmetric ignition
(grey dot). Time step between lines is 20 s 84
Figure V.17 Fire shape evolution in time for asymmetric ignition
(grey dot). Time step between lines is 40 s. First fire profile is at 20 s 85 Figure V.18 Surface evolution in time for symmetric ignition (β=40° top,
β =40° bottom) 86
Figure V.19 Surface evolution in time for the asymmetric ignition (β =40°
top, (β =40° bottom) 87
Figure V.20 HRR time evolution for the asymmetric ignition (β = 40°) 88 Figure VI.1 Aerial view of the Lousã area (left), its visualization in
SURGE software (top) and its conversion in WFDS code (right). 94 Figure VI.2 Time shape profiles. Dashed line: canyon water line 96 Figure VI.3 Area growth in the field experiment compared with the
IX
Index of tables
Table I.1 Number of fires and burnt area in the five Southern Member
States in the last 32 years (FFEMA, 2011) 4
Table I.2: Global emissions of selected pyrogenic species in the late 1990s (In mass of species per year; Tg/a) (IFFN 2004). 6 Table II.1 Outline of the major biological, physical and chemical
components and processes occurring in a wildland fire and the temporal and spatial (vertical and horizontal) scales over which they occur
(Sullivan, 2008) 14
Table II.2 Approximate analysis of some biomass species
(Shafizadeh, 1982) 16
Table II.3 Summary of the physical models (1990-present) discussed 22 Table II.5 Summary of the physical models (adapted from Sullivan, 2008) 30 Table III.1 Typical attenuation lenght scale for various ecosystems 40 Table IV.1 Physical properties of the fuel families in the forest domain 52 Table IV.2 Numerical simulations set in the forest domain 52 Table IV.3 Parameters of Equations IV.2 to IV.5 obtained through linear
Summary
Wildland fires have always been undesired and dangerous events. The danger includes the destruction of a renewable natural resource, damage of the atmospheric environment through the emissions of pollutant gases, which contribute to the greenhouse effect, and threat to the lives of people living in the areas surrounding the place where fire occurs and of the members of firefighting teams. To cope with all this, it is necessary to know the behaviour of the fire in order to be able to make adequate and proper decisions that will assist activities implemented in fire suppression and prevention. In this context, fire behaviour modelling is utilized to determine these characteristics and to simulate fire propagation in a variety of vegetations, under diverse climatic and topographic conditions.
In this context the aim of the thesis work was to study and describe the fire propagation under different fuel features and boundary conditions with particular attention to terrain configurations where fire propagation may be characterized by abrupt variations in intensity and propagation rate. These areas include double-slope domain and canyons where such a phenomena (commonly identified as eruptive behaviour) occurs without any change in the main factors governing the fire propagation (i.e. atmospheric condition, vegetative fuel, domain topography). This work aims to provide an increase of knowledge in the fire spreading, currently still limited, thanks to the adoption of a physically-based code (WFDS) to model flame propagation; in fact, through the numerical resolution of the fundamental balance equation describing the fire phenomenon, it offers a way to analyze the fire behaviour on a scientific basis. To purse this target different aspects, reported in different chapters, were considered in this work.
The first part examines shortly the social, economical and ecological impact of wildland fires on a global scale and for the countries of the Euro– Mediterranean region. The role of fire behaviour modelling as a tool for fire fighting activities and prevention management is put in evidence and discussed.
In the second part the role of fire behaviour modelling as a tool for fire fighting activities and prevention management is put in evidence and discussed. Such a part endeavours to shortly review the main surface fire spread models developed since 1990 with particular attention to physically-based codes. These models are alternative to empirical or quasi-empirical models, which do not have physical basis and are only statistical in nature or make use of some form of physical framework upon which to base the statistical modelling chosen. A comparison between the most frequently used simulation codes is accomplished and the advantages to consider a
physical code - for instance WFDS - rather than an empirical or quasi-empirical one is highlighted.
The subsequent section presents an outline of the physical mechanisms and length scales governing the propagation of wildfires, which have to be considered when a physical modelling approach is employed. In this context, the literature highlights two regimes in the propagation of surface fires, i.e. wind-driven fires and plume-dominated fires, which are governed by radiation and convective heat transfer, respectively. In this part a short outline of the mathematical background, which is used to describe the physical and chemical aspects involved in the fire phenomena along with its numerical implications, is also provided.
The fourth chapter discuss about the way by which the wind and the terrain inclination affect the fire propagation across a homogeneous fuel; in this case also the possibility for the occurrence of a transient regime even under constant geometric and ambient conditions is also addressed. Furthermore, the role played by the understorey vegetation on the development of a crown fire is investigated by considering a domain made of a heterogeneous surface fuel under a linear stand of trees.
The fifth part deals with the description of fire behaviour across double-slope terrains and canyon configuration. Simulations, performed by the WFDS code, help, in the first case, to understand the main parameters affecting the variation of fire propagation in correspondence of the domain slope change. In the second case, the numerical approach provides insights in the understanding and description of the so-called eruptive behaviour, characterized by an exponential increase in the fire propagation rate, promoted by the particular domain configuration.
In the sixth section the numerical code WFDS is used to study the behaviour of a fire propagating over a relatively large area with a real surface configuration. In particular, the code provides information to deduce the fire front shape profiles and terrain area burned in time.
Finally, part seven discusses the findings of this thesis and summarizes the main conclusions. The potentiality of the numerical code in providing reliable and detailed predictions of the behaviour and effects of fire over a wide range of conditions is highlighted. However information about the limitations of the code is also provided.
Chapter I
Forest fires and fire management
The two main aspects in examining wildland fires involve the damage caused by such natural disasters and the activities involved in fire prevention and suppression. This section presents some forest fire data for a global scale and countries of the Euro–Mediterranean region. Additionally, a short review of basic activities encompassed by scientific research for fire prevention and wildland suppression is provided. Section 1.2 presents the main objectives of fire management while section 1.3 introduces the role of fire behaviour modelling as a tool for fire fighting activities and prevention. Next sections report the aim of the work and the outline of the thesis work.
I.1 Wildland fires as agents of damage of wooded areas
Wildland fires have always been undesired and dangerous events throughout the world. The damages caused by them can be classified into three major groups:
• Destruction of a renewable natural resource used as an energy source and also as a source for a number of products of substantial economic and social significance.
• Environmental damage resulting from the emissions into atmosphere of contaminant gases thus contributing to the greenhouse effect. Additional damage results from contamination of fertile soils, deforestation, contamination of underground water, activation of erosion and landslide processes, desertification of large land areas, etc.
• Human injuries and/or deaths both among the population living in the fire affected areas, and among members of firefighting teams. Moreover, material damage is caused affecting the way of life of local population living in the areas where the fire events occurred.
Wildfire incidences have been increasing worldwide, with adverse effects on economies, livelihoods, and human health and safety that are comparable to those associated with other natural disasters as earthquakes, floods, droughts and volcanic eruptions (ISDR 2003). Main global vegetation zones
Chapter I
2
are considered to be the northern boreal forest, the temperate forest, the Mediterranean, the tropical rainforest and the tropical/savanna regions.
International forest fires news (2004) indicated that within 1997–1998 fires have destroyed twenty million hectares of rainforest in Latin America and Southeastern Asia. During the same period five million hectares were destroyed in Borneo and another 9.5 in East Kalimantan, Indonesia. Brazil has lost as a result of fires 15 million forest hectares in the period 1988–1997 (ISDR Working Group of Wildland Fire 2003). These data become even more significant when it is realised that these fires are not natural phenomena in tropical rainforests and they do not facilitate any vegetation regeneration.
Figure I.1 Total area of fires burned in North America, Europe and CIS –
countries IFFN (2002).
Figure I.1 illustrates the distribution of the total area affected by forest fires that have occurred on the territory of the US, Canada, European countries and the countries of the Commonwealth of Independent States (CIS) in the period 1991–2001. These fires have occurred in areas of the northern boreal forest and in the part of the temperate forest (USA, Mediterranean basin and the Balkans). It is apparent that the average surface area of forests devastated by fires is about 6 million hectares and in 1998 this figure reached 12 million hectares. It should be noted here that this maximum was due to the high temperatures experienced that year (one of the hottest in the 20th century) and also to the El-Nino phenomenon. Despite of the fact that no data is presented for other regions (such as Australia, African savannas), from all said above it is obvious that wildland fires represent a serious problem globally, burning millions of hectares of vegetation each year. 0 2000 4000 6000 8000 10000 12000 14000 1991 1992 1993 1994 1995 1996 1997 1998 1999 2000 2001 Year A re a o f f ir e s , [ th o u s a n d s h a ]
Forest fires and fire management
3
I.1.1 European statistics
For the period 1980–2011 the number of forest fires in five southern member - (Portugal, Spain, France, Italy, and Greece) varied greatly (Fig. I.2). The statistics vary considerably from one year to the next, which clearly indicates how much the burnt area depends on seasonal meteorological conditions.
Figure I.2 Burnt area in the Southern Member States
Figure I.3 Number of fires in the Southern Member States
Overall, the total burnt area for all 5 countries in 2011 is around 62% of the average for the last decade and 58% of the long term average (32 years;
0 200000 400000 600000 800000 1000000 1200000 1980 1983 1986 1989 1992 1995 1998 2001 2004 2007 2010 Year B u rn t a re a [h a ] 0 10000 20000 30000 40000 50000 60000 70000 80000 1980 1983 1986 1989 1992 1995 1998 2001 2004 2007 2010 Year N u m b e r o f fi re s
Chapter I
4
Table I.1). During 2011 fires in these 5 countries burned a total area of 269 081 ha. This is slightly higher than the area burnt in 2010, but among the lowest values since 1980 (only 1996, 1999, 2008 and 2010 were lower). The number of fires that occurred (55 543) is also higher than the number registered in 2010, but slightly below the average of the last 2 decades (see Table I.1 for details).Figure I.3 shows the yearly number of fires in the five southern member states listed above since 1980. After the increasing trend during the 1990s, which was also partly due to the improvement in recording procedures, the number of fires was stable for around one decade, and in the last decade a decrease was observed. However, in the last 5 years the trend has been slightly upward. Overall, 2011 was an average year in terms of number of fires. In 2011 the number of fires was 27% more than that recorded in 2010, but the total burnt area increased by only 6%.
Figure I.4 shows the yearly average fire size in the 5 countries since 1980. There is a clear difference in average fire size before and after 1990. This is a similar trend to that observed in the number of fires and is also partly due to the same reasons (the additional fires that are recorded thanks to the improvements in the statistical systems are the smallest ones). But it is also largely due to the improvements of the fire protection services of the countries.
Figure I.4 Average fire size in the Southern Member States
Forest fires in Italy in 2011 occurred much more in comparison to the previous three years. In 2011, there were 8 181 fires recorded, burning a total area of 72 004 hectares, 38 428 of which were wooded. In Italy forest fires occur in all regions. In winter they are located mostly in the Alpine regions (especially the North-western regions), while in summer they are mostly concentrated in the Mediterranean regions (Southern regions and
0 5 10 15 20 25 1980 1983 1986 1989 1992 1995 1998 2001 2004 2007 2010 Year A v e ra g e f ir e s ize [ h a ]
Forest fires and fire management
5 islands). In Liguria fires occur both in summer and winter at about the same frequency. In 2011 the number of fires was about 68% more than in 2010, while the wooded burned area was about 99% more. As usually, forest fires mainly occurred in southern regions. As far as the number of fires is concerned, Campania was the most affected region with 1 435 fires, but the worst burned area occurred in Calabria (total: 14 437 ha; wooded: 8 174 hectares)
Table I.1 Number of fires and burnt area in the five Southern Member States
in the last 32 years (FFEMA, 2011)
NUMBER OF FIRES PORTUGAL SPAIN FRANCE ITALY GREECE(*) TOTAL
2011 25 221 16 028 4 500 8 181 1 613 55 543 % of total in 2011 45% 29% 8% 15% 3% 100% Average 1980-1989 7 381 9 515 4 910 11 575 1264 34 645 Average 1990-1999 22 250 18 152 5 538 11 164 1748 58 851 Average 2000-2009 24 949 18 337 4 406 7 259 1695 56 645 Average 2010-2011 23 624 13 875 4 200 6 533 1333 49 564 Average 1980-2011 18 533 15 243 4 904 9 783 1554 50 017 Total (1980-2011) 593 052 487 788 156 931 313042 49723 1 600 536
BURNT AREAS (ha) PORTUGAL SPAIN FRANCE ITALY GREECE(*) TOTAL
2011 73 813 84 490 9 630 72 004 29 144 269 081 % of total in 2011 27% 31% 4% 27% 11% 100% Average 1980-1989 73 484 244 788 39 157 147 150 52417 556 995 Average 1990-1999 102 203 161 319 22 735 118 573 44108 448 938 Average 2000-2009 150 101 125 239 22 342 83 878 49238 430 798 Average 2010-2011 103 452 69 630 9 965 59 271 19056 261 373 Average 1980-2011 108 275 170 397 26 946 112 955 46742 465 314 Total (1980-2011) 3 464 789 5 454 717 862 262 3 614 546 1495735 14 890 049 (*) Number of fires are incomplete since 2009
Despite the reduction in number of fires and forest fires, Italy is among the European countries where the phenomenon is particularly serious. In many Italian regions, the majority of fires are detected and extinguished when the fires are of minimal size, so that only few fires escape control. However, these few fires are those determining the greater part of the burned area and often also affect urban areas and infrastructures, causing serious damage and particular concern.
The phenomenon of forest fires is not generalized throughout the country, as about 50 out of the 110 provinces are most affected and therefore these should receive special attention. The fire fighting system, which in some regions has reached levels of excellence, is overall fragile. In Italy the
Chapter I
6
Regions have primary responsibility in the field of forest fires and, through conventions and programme agreements, empower the Italian Forest Corps in prevention, preparedness, coordination in the regional operations rooms and in the survey of burned areas, and the National Service of Fire Brigades in active firefighting and coordination in the regional operations rooms. The Italian Forest Corps also submits the forest fire prevention plans of national and regional parks and protected natural areas for examination.
I.1.2 Global emissions of selected pyrogenic species
Scientific interest on biomass smoke as a pollutant grew when early estimates of pyrogenic emissions suggested that, for some atmospheric pollutants, biomass burning could rival fossil fuel use as a source of atmospheric pollution. These emissions could affect large world areas, especially in the tropics (IFFN 2004). Table I.2 presents data for assumed emission levels for gases causing the heaviest atmospheric pollution.
From these data it is clear that gaseous emissions released into atmosphere during fires and contributing to the greenhouse effect exceed the emissions released from burning biofuels and reach up to 30% of all emissions resulting from burning fossil fuels. The aerosols emitted from vegetation fires influence climate directly and indirectly. Direct effects are (a) backscattering sunlight into space, resulting in an increased albedo and a cooling effect and, (b) absorption of sunlight which leads to cooling of the Earth’s surface and atmospheric warming (ISDR 2003). Gaseous emissions in atmosphere from Latin America fires are estimated at roughly total carbon cost of $10–15 billion as per the Kyoto Protocol. Smoke resulting from the burning of vegetation contains a large amount of various chemicals many of them have adverse health impacts (Goh et al., 1999). Devastating South-eastern Asia fires in 1997–1998 caused respiratory health problems, which along with transport disorder were estimated at US$ 9.3 billion (ISDR 2003).
Table I.2: Global emissions of selected pyrogenic species in the late 1990s
(In mass of species per year; Tg/a) (IFFN 2004).
Savanna and
grassland Tropical forest Extra - tropical forest burning Biofuel Fossil fuel burning
CO2 5096 2101 1004 4128 23100
CO 206 139 68 206 650
CH4 7.4 9.0 3.0 16.2 110
Forest fires and fire management
7
I.2 Management activities over fire prevention and suppression
Fire suppression involves all activities associated with the control and final suppression of a wildland fire after it is initially started. In order to visualize the basic principles of fire suppression the fire triangle is usually used (Figure I.5).
Figure I.5 The wildland fire triangle.
To stop the free-burning fire it must be either (1) removed by removing the fuels ahead of the spreading combustion zone, (2) reduce the temperature of burning fuels, or (3) exclude oxygen by reaching the combustion zone by smothering (Alexander, 2000). From a practical viewpoint, most generally this means to create a physical barrier by removing the vegetation material, to cool down fire flames using water, or to reduce fire intensity by soil covering, suppressants like foam, or chemical fire retardants, which could be sprayed over from ground level or from the air above.
Scientific research involved with assisting activities for wildland fire management is basically focused into several fields (Lampin et al., 2004; Rodriguez y Silva & Moreno Robles 2005; Marzano et al., 2006; Xanthopoulos et al. 2006):
• Determination of wildland fire risk, ignition danger, propagation danger
and vulnerability. Ignition danger is the danger that arises due to
combination of factors that lead to wildfire inception. Propagation can be defined also as the fire spread danger. This type arises due to the combined existence or factors emergence that favour wildfire spread. Vulnerability is related to the potential fire impact or else potential damages on environmental and socio-economic elements and is defined by the factors that can favour such a process.
• Developing Decision Support Systems (DSS). These systems should meet various needs: observation and predicting of weather data, risk assessment, early fire detection, determination of fire behaviour, advising and pre-suppression planning, and suppression decision support.
Fire Combustion
Oxygen Heat
Chapter I
8
• Fuel management by reducing fuels through mechanical or physical
means or through the use of prescribed burning. Management objectives
must satisfy legal requirements, be thoroughly planned, and when conducted, be in accordance with clearly defined procedures providing for safe work practices and manageable fire behaviour. They should also be environmentally sensitive and have their outcomes recorded.
• Developing new methods and means for fighting fires and providing for
their efficient application in real conditions. Work in this field comprises
creating the material resources, training of fire-fighting crews and efficient interaction between individual departments involved in activities for fire prevention and suppression.
• Creating models that will assist the identification of social and economic
impacts of forest fires and of basic risk factors: forestry profitability,
demographic pressure, social tension, forestry culture and organisational logic.
I.3 Role of fire behaviour modelling
Fire behaviour is generally defined as the manner in which fuel ignites, flame develops, fire spreads as determined by the interaction of fuels, weather, and topography. The more important fire characteristics from the practical standpoint of fire suppression are: forward rate of spread, fire intensity, flame front dimensions, spotting pattern, fire size and shape, rate of perimeter increase, burn out time (Alexander, 2000). Various resource types in fighting forest fires usually feature efficiency limitations. Therefore, it is necessary to be aware of the characteristics and the behaviour of the fire in order to be able to make adequate and proper decisions that will assist activities involved in fire suppression. For example, Alexander (2000) considered that ‘…Direct attack on fire perimeters with excess of 4,000 kW/m intensities is generally not possible. Backfiring is possible, thought not always successful up to around 10,000 kW/m…’. Fire behaviour modelling is utilized to determine these characteristics and to simulate fire propagation in a variety of vegetations, under diverse climatic and topographic conditions. These models are used as a tool to assist activities involved in fire prevention, detection and suppression. The main application fields for these models comprise:
• Predicting a risk. The applicability of fire behaviour modelling is linked to determining the risk of ignition of the vegetation and the fire spread danger. Based on identifying the fire hazard and risk it is possible to make decisions to carry out activities involved in the prevention and early detection of wildland fires.
• Mathematical reconstruction of a fire. Using theoretical models for testing various hypothesis associated with the occurrence and spreading
Forest fires and fire management
9 of wildland fires. The results of such simulations can find practical application in all fields of fire management.
• Interpolation between or extrapolating beyond experimental results. Laboratory and field experiments feature limitations (financial, time-related, etc.) related to the number and parameter values describing vegetation and external conditions. Using fire models, based on experiments allows to test in practice an unlimited combination of external conditions.
• As part of a decision support system. In this case the application of fire behaviour modelling is associated with reducing the time span between the fire discovering and the actual action putting of firefighting crews based on options for activity plans developed in advance.
• Evaluation of effectiveness of fire suppression. Using the developed models it is possible to test the application of various means / techniques for suppressing fires and to determine the most efficient approach for given characteristics of fire behaviour.
I.2 Aim of the work
The aim of this thesis work was to increase the level of knowledge of the physical phenomena occurring during a fire spreading across a domain under different fuel and boundary conditions.
Accordingly, several fire configurations and scenarios have been considered. Preliminary investigation addressed the effect of wind and terrain inclination on fire propagation and the interaction between surface and vertical fuel in originating a crown fire. Furthermore, particular attention was focused to some terrain configurations which have not been particularly considered in the literature such as slope-changing domains and canyons where fire propagation may be characterized by abrupt variations in intensity and propagation rate. Study of fire spreading across a real heterogeneous terrain has also been accomplished.
The WFDS code has been employed to study and describe the fire propagation in the conditions listed above in order to put the basis to carry out a risk analysis of fire spreading taking into account specific terrain features and vegetative characteristics of a given geographic area. When available, clues from the literature have been considered in order to validate the code and put in evidence the main related aspects.
I.3 Outline of the thesis
To accomplish the aims summarized above different topics, organized in separated section were considered.
The second part endeavours to shortly review the main surface fire spread models developed since 1990 with particular attention to physically-based
Chapter I
10
codes. A comparison between the most frequently used simulation codes was accomplished and the advantages to consider a physical code - for instance
WFDS - to study the fire propagation and behaviour respect to a an empirical
or quasi-empirical one was highlighted.
The subsequent section presents an outline of the physical mechanisms and length scales governing the propagation of wildfires which have to be considered when a physical modelling approach is considered. In this part a short outline of the mathematical background, which is used to describe the physical and chemical aspects involved in the fire phenomena along with its numerical implications, is also provided.
The fourth chapter discusses about the way by which the wind and terrain inclination affect the fire propagation across a homogeneous fuel; in this case also the possibility for the occurrence of a transient regime even under constant geometric and ambient conditions was addressed. Furthermore, the role played by the understorey vegetation on the development of a crown fire was , investigated by considering a domain made of a heterogeneous surface fuel under a linear stand of trees.
The fifth part deals with the study and description of fire behaviour across double-slope and canyon configurations. Simulations, performed by the WFDS code, helps, in the first case, to understand the main parameters affecting the variation of fire propagation in correspondence of the domain slope change . In the second case, the numerical approach provides insights in the understanding and description of the so-called eruptive behaviour, characterized by an exponential increase in the fire propagation rate promoted by the particular domain configuration.
In the sixth chapter the numerical code is used to study the behaviour of a fire propagating over a relatively large area having a real surface configuration. Model results are compared with data, available in the literature, showing a good agreement.
Finally, part seven discusses the findings of this thesis and summarizes the main conclusions. Potentiality of the numerical code to provide reliable and detailed information on the fire behaviour is reported. However, it also stressed how for now long calculation times and difficulty of use and handling are serious limits to its use as a real-time tool for fire safety and emergency management
I.4 References
Alexander, M., 2000. Fire behaviour as a factor in forest and rural fire
suppression. Forest research, Rotoria, in association with the New
Zealand Fire Service Commission and National Rural Fire Authorities, Wellington. Forest research bulletin No. 197, Forest and Rural Fire Scientific and Technical Series, Report No. 5, p.28.
Forest fires and fire management
11 Forest Fires in Europe Middle East and North Africa (FFEMA), 2011, Europena Commision – Joint Research Centre – Institute for Environment and Sustainability . Scientific and technical Research series – ISSN 1018-5593 (print), ISSN 1831-9424 (online)
Goh, K., Schwela, D., Goldammer, J. & Simpson, O., 1999, Health
guidelines for vegetation fire events. Background paper. Published on
behalf of UNEP, WHO, and WMO. Institute of Environmental Epidemiology, Ministry of the Environment, Singapore. Namic Printers, Singapore, p.498.
International Forest Fires News (IFFN), 2002. Forest fires in Europe 1961–
1998 [online]. Available at: http://www.fire.unifreiburg.de/iffn/country/
global/ Europe_1.htm.
International Forest Fires News (IFFN), 2004 Assessment of Global missions
fromVegetation Fires [online]. Available at:
http://www.fire.unireiburg.de/ iffn/iffn_31/18-IFFN-31-Emissions.pdf ISDR Working Group of Wildland Fire, 2003. Background paper: An
overview of vegetation fires globally. International Wildland fire summit.
Australia, 8 October 2003.
Lampin, C., Molina, D., Martin, P. & Caballero, D., 2004. The Interest of
Socio-Economical Sciences in Wildland Fires: a State of the Art [online].
Available at: http://eufirelab.org/prive/directory/units_section_5/D-05-01/D-05-01.pdf.
Marzano, R. et al., 2006. Wildland Fire Danger and Hazards: a state of the
art, finalversion [online]. Available at: http://www.eufirelab.org/prive/
directory/ units_section_8/D-08-05/D-08-05.pdf
Rodriguez y Silva, F. & Moreno Robles, A., 2005. Towards methods for wildland fire suppression planning (intermediate) [online]. Available at: http://www.eufirelab.org/prive/directory/units_section_9/D-09-02/D-09-02.pdf
Xanthopoulos, G. et al., 2006. Methods to study fire impacts on plants (forest
stands,shrubs, herbaceous taxa), soil and fauna [online]. Available at:
http://www.eufirelab.org/prive/directory/units_section_4/D-04-10/D-04-10.pdf
Chapter II
Literature review and main characteristics
of the prediction tools used for surface
vegetation fires
This part of the work shortly reviews the main surface fire spread models developed since 1990 with particular attention to physically-based codes. These models are based on the fundamental chemistry and/or physics of combustion and fire spread and have become in the last years a promising tool to investigate the forest fire behaviour in a less subjective way. This approach, promoted by improvement in computer potentialities, aims to substitute or limit the use of empirical or quasi-empirical model: the former contains no physical basis at all (generally only statistical in nature) while the latter uses some form of physical framework upon which to base the statistical modelling chosen. Furthermore, the basics of the physic and chemical aspects of fire and combustion phenomena are provided to better explain the assumptions the models are based on.
II.1 Fundamentals of fire and combustion phenomenon
Wildland fire is the complicated combination of energy, in the form of heat, produced by chemical combustion , its transport to surrounding unburnt fuel and the subsequent ignition of this fuel. The former is the domain of chemistry (more specifically, chemical kinetics) and occurs on the scale of molecules, and the latter is the domain of physics (more specifically, heat
transfer and fluid mechanics) and occurs on scales ranging from millimetres
up to kilometres (Table II.1).
It is the interaction of these processes over the wide range of temporal and spatial scales that makes the modelling of wildland fire behaviour a considerable problem. According to Grishin (1997), several steps needs to be
Chapter II
14
considered in order to develop a physical model able to describe the fire behaviour:
1. Physical analysis of the phenomenon and isolation of the mechanism governing the heat transport from the fire front to the surrounding; 2. Determination of the physical and reaction properties of the medium and
deduction of the basic system of equations with corresponding boundary conditions;
3. Selection of a method of numerical solution of the problem; 4. Programming and test check of the program; .
5. Validation of the code through comparison with results obtained from real systems.
Stages one and two represent considerable sources of contention for the best method to represent the phenomenon of wildland fire. In fact, even if great advances in the understanding of what is going on in these processes, uncertainties still remains (di Blasi, 1998). The chemistry of combustion involved in wildland fire is really complex both because of the nature of the fuel itself and the wide range of conditions over which the combustion can occur.
Table II.1 Outline of the major biological, physical and chemical
components and processes occurring in a wildland fire and the temporal and spatial (vertical and horizontal) scales over which they occur (Sullivan, 2008)
TYPE TIME SCALE (s) VERTICAL SCALE (m) HORIZONTAL SCALE (m) Combustion reactions 0.0001 – 0.01 0.0001 – 0.01 0.0001 – 0.01 Fuel particles – 0.001 – 0.01 0.001 – 0.01 Fuel complex – 1 – 20 1 – 100 Flames 0.1 – 30 0.1 – 10 0.1 – 2 Radiation 0.1 – 30 0.1 – 10 0.1 – 50 Conduction 0.01 – 10 0.01 – 0.1 0.01 – 0.1 Convection 1 – 100 0.1 – 100 0.1 – 10 Turbulence 0.1 – 1000 1 – 1000 1 – 1000 Spotting 1 – 100 1 – 3000 1 – 10000 Plume 1 – 10000 1 – 10000 1 - 100
Literature review and main characteristics of the prediction tools used for vegetation fires
15
II.1.1 Fuel chemistry
Wildland fuel is composed of live and dead plant material consisting primarily of leaf litter, twigs, bark, wood, grasses, and shrubs, (Beall and Eickner, 1970),. The primary chemical constituent of biomass fuel is cellulose (of chemical form (C6O5H10)n), which is a polymer of a glucosan (variant of glucose) monomer, C6O6H12 (Shafizadeh, 1982; Williams, 1982). Cellulose (Figure II.1) is a linear, unbranched polysaccharide of ≃10,000 D-glucose units in β(1,4) linkage1.
Figure II.1 Schematic of chemical structure of portion of neighbouring
cellulose chains, indicating some of the hydrogen bonds (dashed lines) that may stabilise the crystalline form of cellulose (Source: Ball et al. (1999)
The parallel chains are held together by hydrogen bonds (Ball et al., 1999). Other major chemical components of wildland fuel include hemicelluloses (copolymers of glucosan and a variety of other possibly monomers) and lignin (a phenolic compound) in varying amounts, depending upon the species, cell type and plant part (Table II.2).
The cellulose is the same in all types of biomass, except for the degree of polymerisation (i.e. the number of monomer units per polymer). A lot of studies have been performed on the combustion of this component, but very few on the degradation of hemicelluloses and lignin (di Blasi, 1998), due perhaps to the relative thermal instability of these compounds.
The degradation of biomass is generally considered as the sum of the contribution of its main components (cellulose, hemicelluloses and lignin)
1 The D- prefix refers to one of two configurations around the chiral centre of
carbon-5. The β (1, 4) refers to the configuration of the covalent link between adjacent glucose units, often called a glycosidic bond.
Chapter II
16
but the extrapolation of the thermal behaviour of the main biomass components to describe the kinetics of such a complex fuels is only a rough approximation (di Blasi, 1998). The presence of inorganic matter in the biomass structure can act as a catalyst or an inhibitor for the degradation of cellulose making the description of the degradation process an even more complex process to study.
Table II.2 Approximate analysis of some biomass species (Shafizadeh,
1982)
SPECIES CELLULOSE (%) CELLULOSE HEMI-(%) LIGNIN (%) OTHER (%) Softwood 41.0 24.0 27.8 7.2 Hardwood 39.0 35.0 19.5 6.5 Wheat straw 39.9 28.2 16.7 15.2 Rice straw 30.2 24.5 11.9 33.4 Bagasse 38.1 38.5 20.2 3.2
II.1.2 Solid phase reactions: competing processes
When wood is exposed to elevated temperatures, changes can occur in its chemical structure. The extent of the changes depends on the temperature level and the length of time of the exposure.
At temperatures below 100°C, permanent reductions in strength can occur. The magnitude of the reduction depends on the moisture content, heating medium, exposure period and species. The strength degradation is probably due to depolymerization reactions, although little research has been done on the chemical mechanism. (Gerhards 1979, 1982, 1983; Koch, 1985).
At temperatures above 100ºC, chemical bonds begin to break. Between 100°C and 200ºC, non-combustible products, such as carbon dioxide, traces of organic compounds and water vapour, are produced. Above 200ºC the celluloses break down, producing tars and flammable volatiles that can diffuse into the surrounding environment. If the volatile compounds are mixed with air and heated to the ignition temperature, combustion reactions occur. The energy from these exothermic reactions radiates to the solid material, thereby propagating combustion, or pyrolysis, reactions. If the burning mixture accumulates enough energy to emit radiation in the visible spectrum, the phenomenon is known as flaming combustion. Above 450ºC all volatile material is gone. The residue that remains is char that can be oxidized to carbon dioxide, carbon monoxide and water vapour.
Literature review and main characteristics of the prediction tools used for vegetation fires
17 The thermal degradation of wood can be represented by two pathways (Figure II.2), one occurring at high temperatures (>300ºC), the other at lower temperatures. These two competing reactions occur simultaneously.
Figure II.2 Degradation of wood by low-temperature and high-temperature
pathways
Figure II.3 Mass fraction and time derivative of the mass fraction as
functions of temperature for several softwoods (left) and hardwoods (right)(Morten et al., 2002)
The thermal degradation of wood can be represented as the sum of the thermal degradation reactions of the individual components, namely cellulose, hemicellulose and lignin. The influence of these individual components on the thermal degradation reactions of wood can be seen by plotting the wood weight loss as a function of temperature (Figure II.3). The mass fraction, Y, and the time derivative of the mass fraction, -dY/dt (TG and DTG curves, respectively) are reported as functions of temperature in Figures II.3 for the hardwoods and softwoods (Morten et al., 2002). the DTG curves show two main regions. Because the temperature intervals of hemicellulose and cellulose decomposition partially overlap each other, the hemicellulose decomposition (first region) usually appears as a more or less pronounced “shoulder” instead of a well-defined peak. The second region is Wood
Glowing combustion Non-combustible gases, CO,
CO2, H2O, char residue Low temperature O2 Flaming combustion Combustible gases, CO2, H2O, char residue High temperature O2 Wood
Chapter II
18
associated with the attainment of the maximum, mainly because of cellulose decomposition, followed by a rapid decay and a long tail. The wide range of temperatures, where lignin decomposes, hinders the appearance of a peak attributable to this component. Quantitative methods can be applied to the thermogravimetric analysis curves to obtain the kinetic parameters of the thermal degradation which are highly dependent on the experimental conditions - such as heating rates, sample size – adopted in the tests. However, the comparison between the thermal degradation pathway in Figure II.3 shows a similar behaviour for different vegetative species, justifying the use of a single kinetic expression to model the pyrolysis kinetic of many vegetable fuels (Porterie et al., 2005; Morvan and Dupuy, 2004).
II.1.3 Gas phase reactions
Gas phase combustion of levoglucosan , the main tracer of wood pyrolysis, is highly complex and simplified as:
C6O5H10 + 6O2 → 6CO2 + 5H2O (II.1) This assumes that all intermediate reactions, consisting of oxidisation
reactions of derivative products are mostly complete. However, the number of reaction and their pathways is quite large: for example Williams (1982) gives a non-exhaustive list of 14 possible pathways for the combustion of CH4, one of the possible intermediates of the thermal degradation of levoglucosan, to H2O and CO2. Intermediate species include CH3, H2CO, HCO, CO, OH and H2.
At any stage in the reaction process, any pathway may stop (through loss of energy or reactants) and its products may be rejected to take no further part in combustion: these partially combusted components form the smoke. The faster and more turbulent the reaction, the more likely reaction components will be removed prior to complete combustion and, hence, the darker and thicker the smoke from a headfire will result.
II.2 Physics of combustion
The physics involved in the combustion of wildland fuel and its behaviour is, like the chemistry, complicated and strictly dependent on the conditions in which a fire is burning. The primary physical process in a wildland fire is that of heat transfer (Williams, 1982):
The primary physical processes driving the transfer of heat in a wildland fire are that of advection and radiation. In low wind conditions, the dominating process is that of radiation (Weber, 1989). In conditions where wind is relevant is advection that dominates (Grishin et al., 1984). However, in any condition it is reasonable to assume that both mechanisms must be
Literature review and main characteristics of the prediction tools used for vegetation fires
19 considered. In attempting to represent the role of advection in wildland fire spread, the application of fluid dynamics is of prime importance.
II.2.1 Advection or Fluid transport
The key aspect of fluid dynamics and its application to understanding the motion of gases is the notion of continuity. Here, the molecules or particles of a gas are considered to be continuous and thus behave as a fluid rather than a collection of particles. Another key aspect of fluid mechanics (and physics in general) is the fundamental notion of the conservation of quantities which represent the equations of motion.
The continuity equation describes the conservation of mass: 0 ) u ρ ( t ρ (II.2) where ρ is density, t is time anduis the fluid velocity (with vector
components u, v, and w) and is the Laplacian or gradient operator (i.e. in three dimensions z k y j x i ).
In order to solve this equation, the evolution of u is needed: this is obtained taking a balance of forces acting on the fluid resulting in the
conservation of momentum equation:
0 p u ) u ρ ( t u ρ (II.3)
where p is the pressure. However, the evolution of p is then needed to solve the equation and this is frequently done, utilising an equation of state to provide the closure mechanism. In fluid dynamics, the equation of state is generally that of the ideal gas law (e.g. pV = nRT).
II.2.2 Buoyancy, convection and turbulence
Heat release from the chemical reaction within the combustion zone results in heated gases, both in the form of combustion products and as ambient heated air. The reduction in density caused by the heating increases the buoyancy of the gas and results in the gas rising which can then lead to turbulence in the flow. Turbulence affects the whole range of scales in the atmosphere, from the scale of flame to the atmospheric boundary layer, and acts to mix heated gases with ambient air and to preheat the unburnt solid phase fuels. The action of turbulence also affects the transport of solid phase combustion, such as that of firebrands, resulting in spotfires downwind of the main burning front.
Chapter II
20
Suitably formulated Navier-Stokes equations can be used to incorporate the effects of buoyancy, convection and turbulence. Specific methods for numerically solving turbulence within the field of fluid dynamics, including renormalisation group theory (RNG) and large eddy simulation (LES), have been developed.
II.2.3 Radiant heat transfer
Radiant heat is a form of electromagnetic radiation emitted from a hot source and is in the infra-red wavelength band. In flame, the primary source of the radiation is thermal emission from carbon particles, generally in the form of soot (Gaydon and Wolfhard,1960). The general method of modelling radiant heat transfer is through the use of a radiant transfer equation (RTE), which assumes its simplest form in the Stefan-Boltzmann equation:
4
T σ
q (II.4) where σ is the Stefan-Boltzmann constant (5.67 x 10⁻⁸JK−4 m−2 s−1) and T is
the radiating temperature of the surface (K). Usually, the radiant heat flux is approximated as a surface emission from the flame face, but this does not fully capture the volumetric emission nature of the flame (Sullivan et al., 2003) and can lead to inaccuracies in flux estimations. More complex solutions of the RTE can improve the prediction of radiant heat but are, necessarily, more computationally intensive.
The Discrete Transfer Radiation Model (DTRM) solves the radiative transfer equation throughout a domain by a method of ray tracing from surface elements on its boundaries and thus does not require information about the radiating volume itself. Discrete Ordinate Method (DOM) divides the volume into discrete volumes for which the full RTE is solved at each instance and the sum of radiation along all paths from an observer calculated.
The Differential Approximation (or P1 method) solves the RTE as a diffusion equation which includes the effect of scattering but assumes the media is optically thick. Knowledge about the media’s absorption, scattering, refractive index, path length and local temperature are required for many of these solutions (Sacadura, 2005; Goldstein et al., 2006)
II.2.4 Firebrands (solid fuel transport)
Spotting ignition by firebrands is a significant mechanism of fire spread, as observed in many large-scale fires. Determination of the transport of solid fuel (i.e. firebrands), which leads to the initiation of spotfires is highly probabilistic (Ellis, 2000). This is due in part to the wide variation in firebrand sources and ignitions and the particular flight paths any firebrand
Literature review and main characteristics of the prediction tools used for vegetation fires
21 might take. Maximum distance that a firebrand may be carried is determined by the intensity of the fire, the height at which the firebrand was sourced and the wind profile aloft (Albini, 1979; Ellis, 2000). Whether or not the firebrand lands and starts a spotfire is dependent upon the nature of the firebrand, how it was ignited, its combustion properties and the ignition properties of the fuel in which it lands (e.g. moisture content, bulk density, etc) (Plucinski, 2003).
II.2.5 Atmospheric interactions
The transport of the gas phase of the combustion products interacts with the atmosphere around it, transferring heat and energy, through convection and turbulence. The condition of the ambient meteorological conditions, such as changes in wind speed and direction, moisture and temperature both at the surface and higher in the atmosphere, can have a significant impact on the state of the fuel (moisture content), the behaviour of a fire and its growth.
II.2.6 Topographic interactions
The topography in which a fire is burning also plays a part in the way in which energy is transferred to the unburnt fuel. It has recognised that fires burn faster upslope than they do down, even with a downslope wind. This is thought to be due to increased transfer of radiant heat due to the change in the geometry between the fuel on the slope and the flame; however, recent work (Wu et al., 2000) suggests that there is also increased advection in these cases.
II.3 Physical Models
This section briefly describes some of the physical models developed since 1990 (Table II.3) (Sullivan, 2008). The most distinguishing feature of a fully physical model of fire spread in comparison with one that is commonly identified as quasi-physical is the presence of some form of combustion chemistry. These models determine the energy released from the fuel, and thus the amount of energy which is subsequently transferred to surrounding unburnt fuel and to the other elements in the computational domain. This is done through a model describing the fundamental chemistry of the fuel and its combustion. Quasi-physical models, on the other hand, rely upon a fixed amount of energy released by combustion and on flame characteristics to be known a priori making their use generally applicable to specific conditions. This limitation makes them not suitable to be considered a good way for study fire spreading and behaviour.
Chapter II
22
Different approaches and final purposes characterize the physical models reported in table II.3. Some have continued development, some have been implemented and tested against observations, and others have not. Many are implemented in only one or two dimensions in order to improve computational or analytical feasibility.
Table II.3 Summary of the physical models (1990-present) discussed
MODEL AUTHOR YEAR COUNTRY DIMENSIONS
Weber Weber 1991 Australia 2
AIOLOS-F Croba et al. 1994 Greece 3
FIRETEC Linn 1997 USA 3
Forbes Forbes 1997 Australia 1
Grishin Grishin et al. 1997 Russia 2
IUSTI Larini et al. 1998 France 2
PIF97 Dupuy et al. 1999 France 2
LEMTA Sero-Guillaume 2002 France 2
UoS Asensio et al. 2002 Spain 2
WFDS Mell et al. 2006 USA 3
II.3.1 Weber (1991)
Weber’s (1991b) model was an attempt to provide the framework to build a physical model of fire spread, rather than an attempt to actually build one. To this end, he highlights several possible approaches but does not give any definitive answer.
Weber begins with a reaction-transport formulation of the conservation of energy equation, which states that the rate of change of enthalpy per unit time is equal to the spatial variation of the flux of energy plus heat generation. He then formulates several components that contribute to the overall flux of energy, including radiation from flames, radiation transfer to fuel through the fuel, advection and diffusion of turbulent eddies. Heat is generated through a chemical reaction that is modelled by an Arrhenius law which includes heat of combustion. This results in a first cut model that is one dimensional in x plus time.
In a more realistic version Weber determines the solution of the model in two dimensions producing two parametric equations for spatial x and y that yields an ellipse whose centre has been shifted. Weber favourably compares this result with that of Anderson et al. (1982), who first formalised the spread of a wildland fire perimeter as that of an expanding ellipse. No performance data are given.