UNIVERSITÀ DEGLI STUDI DI ROMA
"TOR VERGATA"
FACOLTA' DI ECONOMIA
DOTTORATO DI RICERCA IN ECONOMIA DELLE ISTITUZIONI E DEI
MERCATI MONETARI E FINANZIARI
XX CICLO
Three Essays in Empirical Finance
Alessandro Girardi
A.A. 2007/2008
Docente Guida/Tutor: Prof. Gustavo Piga
Coordinatore: Prof. Gustavo Piga
Three Essays in Empirical Finance
Alessandro Girardi
A Thesis Submitted in Fulfillment of the Requirements for the Doctoral Thesis
Doctorate in Money and Finance Coordinator: Professor Gustavo Piga
Department of Economics and Institutions University of Rome “Tor Vergata”
Supervisor: Professor Gustavo Piga
Contents
Summary
Acknowledgments ...9
The Informational Content of Trades on the EuroMTS Platform
Abstract ... 131 — Introduction... 14
2 — Institutional features of the MTS system... 16
2.1 — A duplicated market setting for benchmark securities ... 16
2.2 — Empirical issues... 17
3 — The empirical framework ... 18
3.1 — Dynamics of benchmark government securities in the MTS system... 18
3.2 — The econometric approach ... 19
4 — Data and preliminary analyses... 21
4.1 — Data description... 21
4.3 — Speed of covergence towards the long-run equilibrium ... 23
5 — Price discovery in the EuroMTS platform and its determinants ... 24
5.1 — Estimated price discovery measures ... 24
5.2 — Determinants of price discovery: liquidity conditions and institutional features ... 25
5.3 — Cross-sectional analysis: Tobit estimates... 27
5.4 — Robustness and extensions ... 29
6 — Conclusions and further discussions ... 30
Appendix A. List of selected government bonds ... 33
Appendix B. Construction of variables ... 34
References... 35
Tables and Figures ... 38
Drivers of Liquidity and Trading Activity Dynamics in the
European Treasury Bond Markets
Abstract ... 461 — Introduction... 47
2 — Data and measurement ... 49
2.1 — Data sources and summary statistics... 49
2.2 — Definition of liquidity and trading activity measures... 50
2.3 — How liquidity and trading activity evolve over time... 52
3.1 — The empirical model... 54
3.2 — Assessing the interplay between liquidity and trading activity... 57
4 — Drivers behind the interactions between quoted spreads and order imbalances... 60
4.1 — Definition of the candidate explanatory variables... 60
4.2 — The econometric framework ... 62
4.3 — Commonality across government bonds in Europe ... 63
4.4 — A closer look at the determinants: simulated probabilities ... 66
4.5 — A further step ahead: disentangling temporary and permanent effects ... 68
5 — Conclusions... 70
References... 72
Appendix. Construction of time-varying drivers of liquidity states ... 77
Tables and Figures ... 78
The Contribution of Domestic, Regional, and International
Factors to Latin America’s Business Cycle
Abstract ... 911 — Introduction... 92
2 — Modelling Latin American economies in a multi-country framework... 95
2.1 — The GVAR model ... 96
2.2 — Generalised Forecast Error Variance Decomposition ... 98
4 — Assessing the geographical origin of business cycle fluctuations in Latin America... 105
5 — Conclusions... 109
Appendix ... 110
A.1 Data sources... 110
A.2 Variables construction... 111
Summary
Financial markets constitute the leading thread of the research activities carried out to prepare this thesis. The present research investigates several aspects of financial markets by adopting a specific-to-general perspective, going from market microstructure issues to macro-finance subjects.
This thesis consists of three articles. In the first Chapter, I adopt a microeconomic perspective so as to investigate the process of price formation in the MTS (Mercato Telematico dei Titoli di Stato) system, the most relevant electronic trading platform for trading European government securities. The second Chapter consists of bridging a market microstructure analysis of the MTS system to macroeconomic conditions as well as spillover across financial segments and monetary policy developments in the Euro area. Finally, in the third Chapter I embrace a genuine macroeconomic perspective in order to analyze whether financial developments in the Euro area and other industrialized countries (namely Japan and the US) have a role in explaining business cycle fluctuations in selected Latin American (LA) economies.
Acknowledgments
I would like to express my profound appreciation and indebtedness to my thesis advisor, Professor Gustavo Piga, for his encouragement, guidance, and help during my academic journey. I would like to thank Dr. Paolo Paesani for mentoring and constant support throughout my entire doctoral study. Their work and careers served me as precious examples of a passionate and rigorous approach to research.
I thank Dr. Melisso Boschi for his help, encouragement, and thoughtful advice and for allowing me to use our joint work in Chapter 3 of this thesis. I also thank Professor Miche le Bagella, Professor Guglielmo Maria Caporale and my colleagues their many helpful comments and support. I am grateful to Sergio de Nardis and Roberto Basile from Institute of Studies and Economic Analyses (ISAE) for having allowed me to attend the compulsory activities scheduled by the Ph.D. Scientific Board and to Antonio Caruso from MTS Italy from providing me most of the data I have used in Chapter 2 of this thesis.
Financial support from ISAE, Cassa Depositi e Prestiti S.p.A., Department of Economic and Institutions of the University of Rome “Tor Vergata” and MTS Italy is also gratefully acknowledged.
The Informational Content of Trades
Abstract
Using twenty-seven months of daily transaction prices data for 107 European Treasury bonds, this paper presents unambiguous evidence that trading government securities on the EuroMTS platform contributes to disclose information about their (unobservable) efficient price. We find that trades conveying information in terms of price discovery occur on the centralized European marketplace when the level of market liquidity is sufficiently high, even controlling for institutional features. Implications of the empirical findings in the light of the debate about the possible restructuring of the regulatory framework for the financial segment of the market for Treasury securities in Europe are also discussed.
Keywords: Price discovery, liquidity, MTS system. JEL Classification: G10, C21, C32.
1 — Introduction
Over the past few years, the study of European government bond markets has received increasing attention by the financial and economic literature. The growing availability of high-quality transaction data, thanks to the development of inter-dealer electronic trading platforms and greater willingness by some market participants to share their proprietary information with the academic community, has stimulated a number of empirical works aimed at shedding light on the way such a financial segment functions. Previous works have analyzed the dynamic relationship between trading activity and price movements (Cheung et al., 2005) or between yield dynamics and order flows (Menkveld et al., 2004), on the determination of the benchmark status among government securities of similar maturity (Dunne et al., 2007), on the analysis of yield differentials between sovereign bonds in the Euro area (Beber et al., 2008). With respect to this growing literature, the objective of this paper is to investigate the process of price discovery, that is the timely incorporation into market prices of heterogeneous private information or heterogeneous interpretation of public information through trading, in the most relevant electronic platform for euro-denominated government bonds: the MTS (Mercato Telematico dei Titoli di Stato) system.
One of the most striking features of the MTS platform concerns the parallel listing of benchmark government securities (i.e. is on-the-run bonds with an outstanding value of at least 5 billion euro that satisfy listing requirements such as number of dealers acting as market makers) on a domestic and on a European (EuroMTS) platform. Despite their similar architecture, the domestic MTS and the EuroMTS markets reflect different scopes of functioning, with the former aiming at satisfying issuer’ liquidity needs within a regulated and efficient setting and the latter serving as a pure inter-dealer market. According to a more skeptical view, instead, most observers call attention to the possble redundancy of the centralized European trading venue (“the redundancy hypothesis” in Cheung et al., 2005) as all bonds being traded on that market are a fraction of the bucket of securities traded on the respective MTS platforms. On the grounds of this dispute and in an effort to sharpen our
understanding of the process of price formation in the MTS system, this paper focuses in sequence on i) assessing whether domestic MTS and the EuroMTS markets price benchamark Treasury securities equally; ii) quantifying the percentage of price discovery taking place in the centralized European platform; and iii) establishing the causative determinants of the informational content of trades on the EuroMTS market.
Here is an overview of our empical investigation. Using an original and extensive dataset of daily transaction prices for 107 government bonds over a 27-month horizon (from January 2004 to March 2006), we employ the methodology proposed by Harris et al. (1995) and Hasbrouck (1995) to document that about 20 percent of price discovery occurs in the European trading platform. Tobit estimation results show that trades conveying information in terms of price discovery occur on the EuroMTS market when trading activity is high and when price volatility is low. Trade cost differentials, instead, seem to have a scarce role in explaining market players’ preferences in choosing the EuroMTS trading venue rather to the domestic MTS platforms to trade government fixed income instruments. The strong relationship between measures of the contribution of the EuroMTS marketplace and observable market characteristics to price discovery remains unaffected even when institutional features related to the market making activity of primary dealers as well as controls for the maturities of bonds and the interplay between primary and secondary market for Treasury securites are included as additional covariates. These conclusions are robust across a number of alternative empirical specifications.
The paper is structured as follows. In Section 2, we describe the key institutional features of the MTS system along with the set of the research questions tackled throughout the rest of the paper. The empirical framework is discussed in Section 3. Data and estimation results are presented in Section 4 and Section 5. Conclusions and discussions of the results in the light of the debate on the possible restructuring of the European secondary market for Treasury securities follow. Appendices containing the list of bonds involved in the empirical investigation and the construction of the covariates in the cross-sectional analysis conclude.
2 — Institutional features of the MTS system
2.1 — A duplicated market setting for benchmark securities
Trading on the secondary Treasury market can occur via four channels: inter-dealer (B2B) platforms and dealer-to-customer (B2C) electronic trading platforms, either multi-dealer or single-dealer, OTC inter-dealer via voice brokers and OTC dealer-to-customer trading. B2B platforms serve essentially for the trading of Treasury bonds and generally operate via cross-matching methods. In the European case, MTS, Icap/BrokerTec Eurex Bonds and eSpeed are the most prevalent B2B platforms. As pointed out by Pagano and von Thadden (2004), the ability to bring together issuers, with long-term financing needs, and dealers, willing to place liquid funds in interest-bearing securities, and to induce them to a mutual commitment (the “liquidity pact”) constitutes the key to the widespread success of the MTS system. Galati and Tsatsaronis (2003) estimate that the MTS system accounts for 40 percent of government bond transactions in Europe and, according to the computations in Persaud (2006), for around 72 percent volume of electronic trading of European cash government bonds.
All government marketable securities issued by euro area Member States are listed on their respective domestic MTS platforms. Only benchmark securities, or on-the-run bonds with an outstanding value of at least 5 billion euro that satisfy a number of listing requirements, are admitted, instead, to trading on the wholesale European market
(EuroMTS).1
For benchmark securities, thus, dealers are allowed to post their quotes on both market simultaneously (parallel quoting).
In the MTS system, market makers’ quotes are aggregated in a single order book to match best anonymous bids and offers automatically, subject to non-discretionary priority rules. Trades are anonymous and the identity of the counterpart is only revealed after an order is executed for clearing and settlement purposes, so as to avoid free-riding generated by the existence of less sophisticated traders and allowing for liquidity providers to reduce their
1 Designed by the Italian MTS Group, the London-based EuroMTS was set up in 1999 as a trading venue for
exposure when trading (Albanesi and Rindi, 2000).2 As far the type of market participants, we can categorize them either as market makers (primary dealers) or as market takers (dealers). Primary dealers have to obey a number of obligations, which include: i) stringent capital requirements and trading protocols, ii) obligation to continuously post firm two-way prices for a selected subset of securities; iii) price-posting for at least five hours per day and for a certain minimum quantity; iv) possibility to be subject to maximum spread obligations. In return, they are the market participants entitled to participate in supplementary auctions and may gain other privileges. By contrast, dealers cannot enter quotes into the system and are obliged to trade bonds on the basis of bid/ask quotes placed by the primary dealers. In the primary market, a subset of primary dealers is committed to subscribe to specified shares of auctions, thus establishing a possible interplay between practices on the primary market and trading strategies in the secondary market.
2.2 — Empirical issues
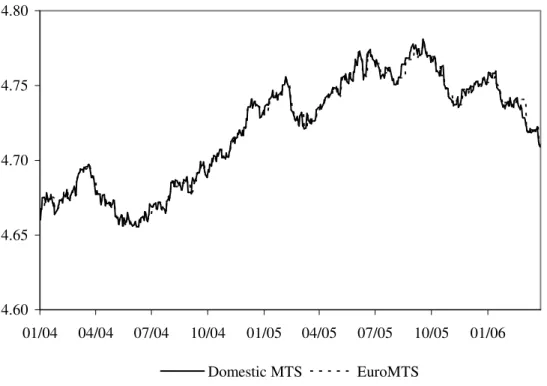
As a background to the discussion, we present in Figure 1 (the logarithm of) daily transaction prices of a typical benchmark security (code: IT0003242747) traded on the MTS system, over the period January 2004 - March 2006.
[Figure 1 about here]
Since transaction prices of the same bond recorded in multiple markets are not independent of one another, their discrepancies are expected to be temporary in nature. Figure 1 shows indeed a close overlapping of the two log-price series, albeit some deviations occur. As the same security is traded in two different market places, the process of price formation driven by incorporating heterogeneous private or heterogeneous interpretation of public information into market values is split among trading venues. Since benchmark government bond trading takes places for the most part in the domestic MTS markets, the
2 The full anonymity has been recently reached by means the introduction of the central counterparty (CCP)
system,which aims at eliminating any risk faced by participants in trading with other dealers. For a detailed discussion of the MTS system, see Scalia and Vacca (1999).
informational content of prices recorded in the EuroMTS platform may be doubtful. In the MTS system, indeed, the centralized European trading venues seems to be a prototype of “satellite market” (in the sense of Hasbrouck, 1995), competing with a number of large domestic markets. Thus, the first issue (price discovery) we address can be stated as: What is the contribution of trading in a centralized European market to price discovery for
benchmark government securities?
Finally, the speed at which information arrivals are processed by market participants in a certain trading venue may be influenced by market-specific characteristics (Eun and Sabherwal, 2003; Chakravarty et al., 2004, among others) as well as by institutional arrangements (Huang, 2002). The last part of our empirical anlysis is devoted to ascertain the causative determinants of the degree of privce discovery taking place in the EuroMTS platform. By distingiushing between proxies for liquidity conditions (trading activity, volatility and transaction costs measures) and institutional features, we seek to establish which class of factors have an influence in the process of price formation in the centralized European platform. Thus, the second reserch question (drivers of price discovery) is the following: What are the cross-sectional determinants of the contribution of the satellite European marketplace to price discovery?
3 — The empirical framework
3.1 — Dynamics of benchmark government securities in the MTS system
Consider a government benchmark security traded on the EuroMTS (E) and the domestic MTS (D) platforms. The (log-) price in market j=E D, at time t, ptj, can be represented as the sum of a permanent component, φt, and a market-specific transient part, j
t
υ :
j j
t t t
p = φ + υ (1)
Given its forward-looking nature, only new information arrivals (due to macroeconomic releases and policy announcements and statements) should cause revisions to what is built into the current price of the bond (Andersson et al., 2006). The law of motion of the
permanent term is 1 0 1 t t t t i i φ φ − =
φ = φ + µ = φ +
∑
µ , where the φ0 term captures initial conditionsand µtφ is an uncorrelated white noise process such that E(µtφ)=0, ( )2 2 t
E µφ = σφ,
( t s) 0
E µ µφ φ = for s≠t. Under this set of assumptions, φt resembles a random walk. The transitory disturbance υtj, instead, is a covariance stationary process, following an ARMA
scheme 1 ( ) j j j j j t i t i t i L ∞ − =
υ =
∑
δ ξ = δ ξ , where the elements of the polynomial in the lag operator L,( )
j L
δ , are market-specific parameters and j
t
ξ ’s are independently distributed with mean zero and constant variance.3 Thus, the difference between a generic pair of bond prices recorded in the two trading venues is:
( ) ( )
E D E E D D
t t t t t
p −p = δ L ξ − δ L ξ = ε (2)
where the disturbance εt is a linear combination of stationary processes and thus stationary itself. Thus, E
t
p and D
t
p are expected to be driven by a common factor, the
∑
µiφ term, which represents the efficient price related to news cumulating over time, while the εt term should capture market-specific transient noises, affecting the speed at which market participants in a specific platform process information flows.43.2 — The econometric approach
The empirical implication of equation (2) can be suitably captured by specifying, for each
3 Given only the observed transaction prices, the decomposition in equation (1) is unidentified. The literature on
permanent and transitory decompositions offers several ways to split the price vector in permanent and transient components, depending on the conditions imposed on the relationships between φt and
i t
υ and on the stochastic properties of these two components. In this work, we focus on the approaches proposed by Harris et al. (1995) and Hasbrouck (1995).
4 This is a standard practice used in the analysis of stock market prices (see, among others, Hasbrouck, 1995;
Harris et al. 1995). As pointed out by Albanesi and Rindi (2000), in the case of bond prices, such a representation is correct as far as the series used do not include the whole life of the asset.
pair (ptE, D t
p ), a dynamic system and testing whether the two log-price series, albeit individually non-stationary, are linked to one another by a stationary long-run equilibrium. Adopting the same notation as introduced above, the following Vector Error Correction (VEC) model (Johansen, 1995) constitutes the basis of our investigation:
1 1 1 1 E E E k E t j t t t j D D D D j t j t t t p p p u A p p p u − − − = − − ∆ ∆ = Π ⋅ + ⋅ + ∆ ∆
∑
,(
)
2 2 E E D t t E D D E u u⋅ ′ = Σ = σ ρσ σ ρσ σ σ (3)where ∆ is the first difference operator, A’s are matrices of autoregressive coefficients up to the order k−1,
u
’s are the residuals with variance-covariance matrix Σ, where ρ is the correlation coefficient and σ’s are standard deviations. If condition (2) holds, we expect rank equal to 1 for matrix Π, i.e. the log-two price series sharing a common stochastic factor. In this case, the long-run matrix can be factored as:[
1 1]
E D α Π = ⋅ − α (4) with α <E 0 and α <D 0.The common factor models proposed by Harris et al. (1995) and Hasbrouck (1995) are elegant ways to capture where price discovery occurs for securities traded in multiple markets.5
Harris et al. (1995) attribute superior price discovery to the market that adjusts the least to price movements in the other market by decomposing the common factor itself:
D E D E α γ = α − α , E D E D α γ = α − α (5)
so that, the contribution of the EuroMTS (domestic MTS) marketplace to price discovery,
5 While these approaches have been applied to stock (Huang, 2002), credit derivatives (Blanco et al., 2005) and
foreign exchange (Tse et al., 2006) markets, there is scant empirical evidence for the market of government fixed income securities. Noteworthy exceptions are the works by Upper and Werner (2002), Brandt et al. (2007) and
Chung et al. (2007), where the dynamic interactions between spot and future prices are examined. In this work, instead, we focus on two cash markets.
E
γ (γD), is defined to be a function of both α’s. Based on the Cholesky factorisation of the matrix Σ, Hasbrouck’s model assumes, instead, that the degree of price discovery occurring in a trading venue should be (positively) related its contribution to the variance of the innovations to the common factor (market’s information share). Since price innovations are generally correlated across markets, the matrix Σ is likely to be non-diagonal. In such an occurrence, Hasbrouck’s approach can only provide upper and lower bounds on the information shares of each trading venue. For the EuroMTS market, these bounds are:
2 2 2 2 2 ( ) ( ) (1 ) ub E E D D E E E D D D D
S
= γ σ + ργ σ γ σ + ργ σ + γ σ − ρ , 2 2 2 2 2 2 2 (1 ) (1 ) ( ) lb E E E E E E E D DS
= γ σ − ρ γ σ − ρ + ργ σ + γ σrespectively. However, Baillie et al. (2002) argue that the average of these bounds:
1 ( ) 2 ub lb E SE SE ζ = + (6)
provides a sensible estimate of the markets’ roles in the mechanism of determination of the efficient price. Both γE and ζE can range in the interval [0,1], where high values of the two statistics indicate sizable contribution of the EuroMTS market to price discovery.6
4 — Data and preliminary analyses
4.1 — Data description
Data are taken from MTS Time series database. Daily observations cover the period from January 2, 2004 to March 31, 2006. For each trading day, we have a time stamp, the nominal value of trading volume, the average size of trades, the last transaction price recorded before the 17.30 Central European Time close, and the average best bid/ask spread throughout the trading day.7
Furthermore, we use information on the issuer country, the issuing and
6 See Ballie et al. (2002), among others, for a detailed discussion and a formal derivation of the two price
discovery measures.
7 Previous studies on price discovery have used data of varying frequency, ranging from daily (Blanco et al.,
2005) to few seconds (Hasbrouck, 1995). Green and Joujon (2000) argue that daily resettlement creates a strong argument for using daily closing prices, since they determine the cash flows of traders.
maturity dates, the hours in a trading day that dealers must have an active quote, the maximum spread that is quoted and the minimum quantity that a dealer can bid or offer.
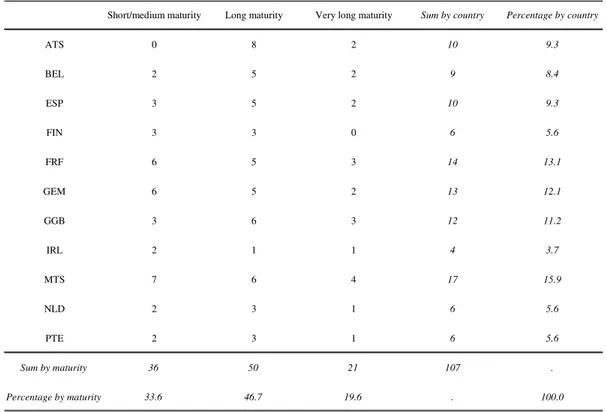
In the empirical analysis, we consider government bonds issued by euro area Member States (except for Luxembourg). For each country, we select all benchmark government bonds traded in January 2004 maturing after the end of our estimation horizon; a total of 107 securities. Table 1 summarises the selected bonds, classified by issuer and maturity. Their codes are reported in Appendix A.
[Table 1 about here]
4.2 — Unit root and cointegration tests
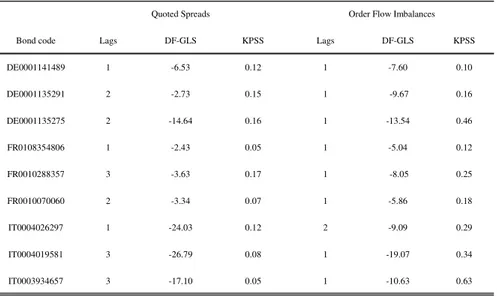
Standard cointegration methods require equally spaced data without missing values. Following Upper and Werner (2002), in the presence of missing observations we use the last available transaction price (“fill-in” method). The estimation horizon ranges from 557 to 585 observations, with an average value of 580 daily datapoints. As a preliminary exercise, we check for the presence of a unit root in each of 214 individual transaction price series expressed in logarithms. ADF tests (Dickey and Fuller, 1979) are performed on the series, both in levels and first differences. In each case, we are unable to reject the null hypothesis of a unit root at conventional levels of significance. On the other hand, differencing the series appears to induce stationarity. The KPSS stationarity tests (Kwiatkowski et al., 1992) corroborate these results (not reported to save space).
Given the evidence of I(1)-ness for all individual series, testing for cointegration between each pair ( E
t
p , D
t
p ) is the logical next step. This translates into the estimation of 107 VEC models, as the one in equation (3), testing whether the restriction (4) is not rejected by the data. The order of autoregression k of the biavriate models (3), formulated in their isomorphic Vector AutoRegression (VAR) representation, is chosen on the basis of the AIC in order to ensure richer dynamics. Overall, the order of autoregression is quite limited: k =1, k =2, k =3 and k =4 is chosen for 62, 25, 15 and 5 entities of reference, respectively.
The trace test (Johansen, 1995) suggests choosing rank 1 for the Π matrix in 104 models, giving support to our a priori theoretical assumptions.8
The symmetry and proportionality assumption implied by condition (2) is tested by means a χ2-distributed LR test with one degree of freedom. In 88 entities of reference, the over-identifying restriction is not rejected by the data (at least) at the 10 percent level of significance, while in 6 cases (at least) at the 5 percent level. For the remaining 10 models the evidence is less conclusive, even though the cointegration test developed by Horvath and Watson (1995) supports the existence of a [1 −1]′ cointegration vector.9
All in all, our evidence leads to conclude that the architecture of the MTS system allows to eliminate persistent discrepancies between the prices of the same bond traded on the domestic MTS and the European platforms.
4.3 — Speed of covergence towards the long-run equilibrium
The dynamic properties of the 104 bivariate dynamic systems (3) with a reduced rank for the matrix Π reveal that the feedback coefficients associated to the E
t
p
∆ equation are
statistically significant at the 1 percent level in all models; by contrast, only one-half of the estimated αD
coefficients turn out to be statistically significant (at the 1 percent level in 24 entities of reference, at the 5 percent in 15, at the 10 percent in the 12 remaining cases). Furthermore, both αE
and αD
are correctly signed, implying direct convergence towards the long-run relationship in all but six models (where the estimated αD’s turn out to be negative).
8 In three entities of reference (FI0001005514, GR0110014165, IT0003522254), the rank of the long-run matrix
turns out to be two. Even though this finding is at odds with the conclusions from the unit root/stationarity tests (which suffer from well-know problems of lack of power), it confirms that condition (2) holds in these three cases too.
9 The test statistics of the null of no cointegration against the known alternative of rank one with β =′ [1 −1] is
computed as 2(lnLLVECM−lnLLVAR), where LL denotes the value of the likelihood function under the
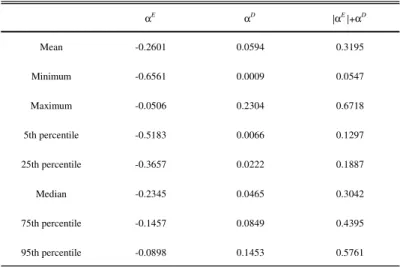
Discarding the entities of reference with wrongly signed αD’s, departures from the equilibrium condition are corrected for the most part in the European platform, with the average value for |αE| equal to 0.26 as compared to 0.06 for αD
(Table 2).10 This conclusion
is confirmed by testing the null 0:| |
E D
H α = α : the LR test statistics turns out to be greater
than 3.84 (the 95 percent critical value for a χ2
distribution with one degree of freedom) for a majority of bonds (82 out of 98 entities of references).11
[Table 2 about here]
5 — Price discovery in the EuroMTS platform and its determinants
5.1 — Estimated price discovery measures
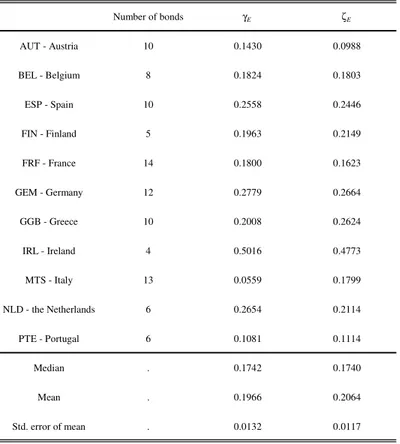
Price discovery measures (5) and (6) are a more direct way to assess whether trading Treasury fixed income instruments on the centralized European platform convey information to determine their (unobservable) efficient price. Estimated values of γE for individual entities of reference range from 0.2 percent (IT0003357982) to 55.9 percent (IE0031256328), while the ζE measure takes values from 2.7 percent (AT0000383864) to 55.5 percent (IE0031256328). Table 3 reports the results aggregated by issuing countries.
The median of the two measures is the same (17.4 percent), with an average value slightly higher for ζE (20.6 percent) than the one for γE (19.7 percent). Based on the
10 Our estimates indicate half-life deviations from the equilibrium condition, ln 0.5 / ln[1 (| E| D)]
n= − α +α ,
lasting around two days, on average. As a result, the ratio between the sample length in terms of data points and the half-life is around 300. This adds confidence to our results, especially in the light of the Monte Carlo study by Hakkio and Rush (1991), who show that in cointegration analysis, the ratio of the length of the data set to the half-life is more relevant than the length of the data set alone.
11 A similar picture is obtained by comparing the 2 adj
R for the two dynamic equations of the system (3) under condition (4). We find that, on average, the explained variation of ∆ptEis around 13.9 percent, while the one
for D t p
standard error of the mean values, these averages are significantly different from zero at the 1 percent level. The evidence here reported suggests that trades taking place on the EuroMTS market have a sizable informational content, going up against the “redundancy hypothesis”, in a way consistent with the conclusions in Cheung et al. (2005).12
Furthermore, a standard
t
-test for the equivalence of the mean (γE minus ζE) produces a test statistics equal to -0.56 with a p-value of 0.58, thus confirming that the estimated EuroMTS market’s share is equivalent irrespective of which of the two price discovery measures is taken into account. Finally, the correlation coefficient between γE and ζE turns out to be very high (0.81) and statistically significant at the 1 percent level, implying that the two price discovery measures lead to non-conflicting conclusions.13[Table 3 about here]
5.2 — Determinants of price discovery: liquidity conditions and institutional features
In keeping with previous works (Eun and Sabherwal, 2003; Chakravarty et al., 2004), price discovery measures are likely to be systematically related to proxies for market liquidity
12 Notice that the “fill-in” method does not affect the estimates of the long-run relationship equilibrium, but may
influence the short-term information flow, since non-trading may produce a lower information share for the less frequent trading market even if the trades that take place do contain information (Lehmann, 2002). Since trades on the EuroMTS are fewer than those occurring on the domestic trading venue for every pair of bonds involved in the analysis, the problem is less severe than it could appear. Thus, our statistically significant estimates of γE and ζE can be interpreted as lower bounds.
13 As a robustness check, we follow Blanco et al. (2005) and replace wrongly signed D
α ’s by zero. Summary statistics for γE and ζE computed for the larger sample (104 models) are quite similar to those reported in
Table 4. The average values of γE and ζE (0.1853 and 0.2031, respectively) are statistically not different
according to a standard t-test (p-value 0.31), with the same standard deviations of the mean with respect to the values in Table 4. Furthermore, by comparing the mean value of γE (ζE) for the sub-sample of 98 bonds
to the one for the larger sample of 104 securities, the t-test for the equivalence of the mean suggests not rejecting the null with a p-value of 0.54 (0.84).
conditions. It is generally understood that a well-functioning market should be characterised by i) high trading volumes, ii) low price volatility and iii) tiny bid/ask spreads. Appendix B illustrates how we extract relative measures (EuroMTS minus domestic MTS) of trading activity (
ntra
), price volatility (rsig) and transaction costs measures (quoted bid/ask spreads associated with transactions, qspr, and effective spreads, espr, respectively) from (equally-weighted) daily averages over the sample span of reference as well as the additional covariates described below.Since institutional arrangements may confound the linkage between observable market characteristics and price discovery (Huang, 2002) we extend our set of regressors so as to include controls for a number of institutional features. Costly continuous quoting obligations faced by market makers suggest including continuous quoting hours, hour, the maximum
spread that can be quoted, mspr, and the minimum quantity that dealers have to bid or to
offer, mqty. We expect a negative (positive) relation between hour (mspr) and the degree of contribution to price discovery; a positive effect of mqty on the price discovery measures (5) and (6) may be consistent, instead, with the “large trader’s blessing” hypothesis (Scalia and Vacca, 1999), according to which anonymous trade favours large traders and, thus, the occurrence of larger transactions in size.
A number of studies (Pagano and Von Thadden, 2004, among others) emphasize that the degree of financial integration in Europe appears to be inversely related to the level of risk-taking market participants are ready to assume. Following Dunne et al. (2007), we control for maturity effects by distinguishing short/medium term bonds (with maturity less than 6.5 years) from bonds with longer maturity (more than 6.6 years) through a dummy variable, smty. Finally, since auctioning government securities may involve risks for the issuer (market squeezes, price manipulations, speculative behaviours, bidders’ collusion), we employ a syntetic indicator, prot, developed by Bagella et al. (2006), which measures the effectiveness of the framework of rules introduced by euro area governments to protect
themselves from those risks.14 A positive effect of prot on E
γ or ζE indicates that higher government’s levels of protection against auctioning risks may persuade against concentrating trading activity on the domestic market.
5.3 — Cross-sectional analysis: Tobit estimates
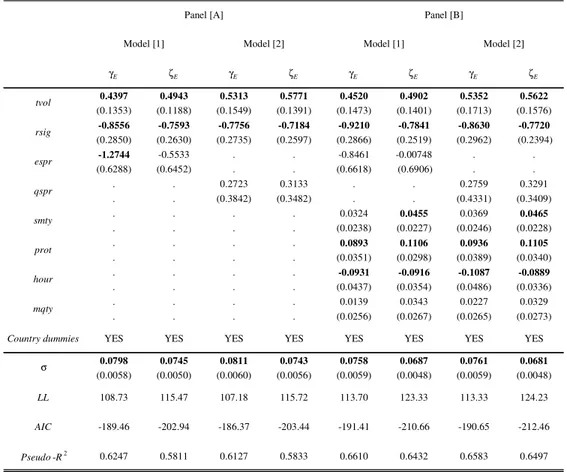
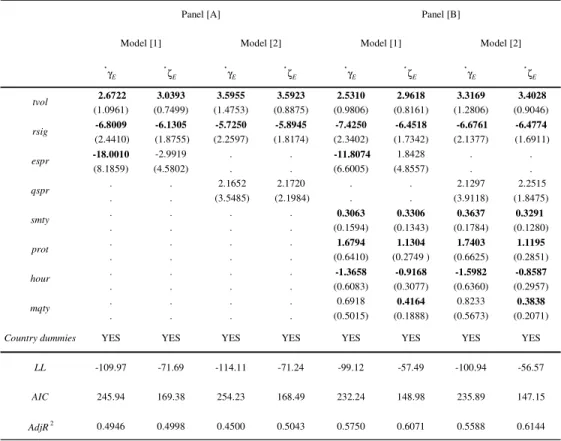
We use a Tobit estimator as our dependent variables, γE and ζE, are restricted to lie between 0 and 1 by construction. Table 4 provides the maximum likelihood estimation results for benchmark specifications (Panel [A]), which include only observable market characteristics in the set of regressors, and for specifications augmented by controls for institutional features (Panel [B]), separately for γE and ζE. All specifications include an intercept term so as to capture possible non-observable country-specific effects. Model [1] differs from Model [2] with respect to the bid/ask spread used as explanatory variable. Statistically significant coefficients at the 95 percent level confidence interval, calculated using the bootstrap method with 500 replications, are reported in bold. Following the recommendations in Veall and Zimmermann (1994), we use the
McKelvey-Zavoina-Pseudo-2
R as a measure of the goodness of fit for our regressions. [Table 4 about here]
Estimation results from Panel [A] are impressive: roughly 60 percent of the cross-sectional variation in
γ
E andζ
E is explained by observable market characteristics alone.1514 Bagella et al. (2006) indicate a group of five countries (Belgium, France, Germany, Ireland and the
Netherlands) with a high protection against auctioning risks, with Finland and Greece showing a slightly lower degree of protection; the remaining countries (Austria, Italy, Portugal and Spain) exhibit, instead, a quite weak framework of rules.
15 Notice that the absence of censoring problems in our sample allows for an almost direct interpretation of the
estimated coefficients as marginal effects. This is confirmed by a comparison of the coefficients of observable market characteristics from the Tobit model in Table 4 and the marginal effects (calculated at the sample mean of the regressors) for the unconditional expected value of the dependent variable. Details on these regressions are available on request.
In particular, Tobit regressions show that trades conveying information occur on the EuroMTS platform when the level of trading activity is sufficiently high and the level of price volatility is sufficiently low.16 By contrast, the relative spread term is not statistically significant in three out of four specifications, suggesting that trading costs differentials across marketplaces cannot be accounted as a major factor for choosing a platform rather the other, as previously found by Cheung et al. (2005). Comparing the above-discussed results to the estimates in Panel [B] several considerations emerge.17 First, goodness of fit statistics show that the augmented specifications are able to capture a slightly larger part of the overall cross-sectional variation relative to the one of their counterparts collected in Panel [A].
Second, estimated coefficients of proxies for market liquidity conditions are very close to
those obtained in the benchmark specifications. Third, the sign of the statistically significant coefficients of the additional regressors are broadly consitent with our economic priors.
Fourth, institutional variables are jointly significant at the 5 percent level according to a
simple χ2-distributed likelihood ratio test.18
All in all, our findings point out that liquidity conditions seem to have a major role in explaining cross-sectional variability of EuroMTS market’s share to price discovery, while institutional features are of second order importance. In the following Section, we discuss the
16 The use of relative number of transactions (defined as the ratio between the nominal amount of trades and their
average size) in place of tvol in the specifications collected in Table 4 gives similar results.
17 Given the lack of significance of mspr in all regressions, estimation results in Table 4 refer to specifications,
which do not include that covariate. The magnitude and the statistical significance of coefficients for observable market characteristics remain unaffected by the inclusion of mspr. Furthermore, assessing the statistical significance of the estimated parameters by using standard errors calculated with the Huber-White sandwich estimator of variance in place of those obtained from bootstrap techniques leads to similar conclusions.
18 We take into account possible asymmetries by adding interaction terms between indicators of market
functioning and smty or prot, alternatively. In none of these regressions we are able to detect statistically significant asymmetric effects.
sensitiveness of our findings to modifications and extensions of the baseline empirical design.
5.4 — Robustness and extensions
As a check of robustness we use linear regression models for logit transformations of the price discovery measures, * ln[ /(1 )] E E E γ = γ − γ and * ln[ /(1 )] E E E
ζ = ζ − ζ , respectively. The OLS
estimation results are presented in Table 5.
[Table 5 about here]
Notice that the strong positive (negative) link between price discovery measures and trading activity (price volatility) is confirmed, giving support to our previous conclusions. The two main differences with respect to the Tobit estimates in Table 4 refer to the institutional variables: first, the maturity effect is statistically significant in all regressions;
second, mqty turns out to be statistically significant in the specifications where *
E
ζ is the dependent variable. This finding may suggest the existence of possible informational asymmetries between uninformed dealers and traders who behave like informed investors (Fleming and Remolona, 1999) with their trades based on superior inventory and order flow information (Huang et al., 2002).19
Finally, we re-examine the interplay between primary and secondary government bond. Favero et al. (2000) point out that financial integration in Europe may increase investors’ interest on the characteristics of bond issues rather than on the nationality of issuers, leading to euro area governments to compete each other for the same pool of funding. The need for a highly liquid secondary Treasury bond market is expected to be of crucial importance mostly for large issuers and/or debtors. Accordingly, we identify as large issuers those countries (namely, France, Italy and Germany) with more than 100 billion euro of issuance (in 2005)
by means the dummy liss, while we indicate Belgium, France, Italy and Germany as large
19 Since the nature of private information in government bond markets differs markedly from the notion widely
used when analyzing equity markets, a closer investigation of such an issue for the European case is an area which would clearly repay further research.
debtors through the variable debt. We replicate the regressions in Table 4, with i) liss and debt as an additional covariate, alternatively; ii) lissor debt in place of prot. Overall, the evidence from set of regressions (not reported) indicates no differenced patterns in price discovery revelation on the EuroMTS market between large and small issuers or between large and small debtors. While the above discussed relationship between statistics about the informational content of trades on the EuroMTS platform and proxies for market liquidity conditions is robust with respect to the inclusion of these institutional controls, primary market developments are likely to affect EuroMTS market’s share to price discovry mainly through regulatory practices in auctioning government securities, with country dummies capturing non-modelled institutional factors (such as national gross issuances and the amount of outstanding public debt).
6 — Conclusions and further discussions
This paper is a contribution to the growing empirical literature on the European Treasury bond markets. To our knowledge, this is the first work to directly measure the relative contribution of trading in a domestic (MTS) versus a centralized European (EuroMTS) marketplace to price discovery for benchamark government securities. To that purpose, we employ an original and extensive dataset as compared to that of the existing literature. Our sample is of independent interest because its construction involved tracking daily observations for 107 pairs of bonds over a 27-month horizon (from January 2004 to March 2006).
We reach two main findings. First, the architecture of the MTS system is able to eliminate persistent price discrepancies for the same bond traded on the two markets. The determination of the efficient price appears to take place on both platforms, with about 20 percent of price discovery occurring in the EuroMTS platform. Second, a number alternative specifications reveal a systematic linkage between cross-sectional variability of the relative contribution of EuroMTS to price discovery on one hand and trading activity and price volatility on the other. Trade cost differentials, instead, seem to have a scant role in
explaining market players’ preferences in trading government fixed income instruments on the European platform rather the domestic MTS market. The inclusion of additional covariates in the set of regressors so as to control for institutional features does not wipe out the strong relationship between EuroMTS market’s share to price discovery and market liquidity conditions. These conclusions are robust across a number of modifications and extensions of the baseline empirical design.
Aside from their scientific merit, our findings have relevant implications for regulators attempting to identify conditions likely to promote further integration in the European financial system. In accordance with the principles of the Directive 2004/39/EC, disciplining the functioning of Markets in Financial Instruments in Europe (MiFID), favouring transparency is an essential mean to achieve an adequate price formation process. However, the relationship between transparency and price discovery is less than obviuos. On the one hand, the exposure of quotes forces market makers to be competitive, making it easier to find the best prices, especially for market takers, who are likely to be less sophisticated than larger market participants. On the other hand, order visibility may reduce the readiness of dealers willing to keep large transactions confidential to participate in the market. This may erode liquidity and impact the efficiency of price formation. Our results suggest that a proliferation of alternative trading platforms may be harmful in fostering integration of the European government bond market if the potential gains from competition across trading venues do not counterweight costs due to increased fragmentation in market liquidity.
A fuller understanding of the liquidity properties of the MTS system is an empirical issue that calls for further investigation. Possible improvements of the research agenda may include a closer scrutiny on whether and how information asimmetries among market participants affect the price formation mechanism in the European market of Treasury securities. A second venue for further advances may take into account a richer specification of the relationship between price discovery measures and their determinants across securities
and over time. In this respect, the analysis of the dynamics of market liquidity and trading activity indicators could be fruitful to increase market participants’ confidence on trading
Appendix A. List of selected government bonds
The government bond markets covered in our dataset are those of Austria, Belgium, Spain, Finland, France, Germany, Greece, Ireland, Italy, the Netherlands and Portugal. For each country, we select all benchmark government securities traded in January 2004 with maturity date subsequent the end of our estimation horizon (March 2006). 107 bonds satisfy such a requirement and their codes are reported below:
AT0000383518, AT0000383864, AT0000384227, AT0000384821, AT0000384938,
AT0000384953, AT0000385067, AT0000385356, AT0000385745, AT0000385992;
BE0000286923, BE0000291972, BE0000296054, BE0000297060, BE0000298076,
BE0000300096, BE0000301102, BE0000302118, BE0000303124; DE0001135176,
DE0001135192, DE0001135200, DE0001135218, DE0001135226, DE0001135234,
DE0001135242, DE0001141380, DE0001141398, DE0001141406, DE0001141414,
DE0001141422, DE0001141430; ES0000012239, ES0000012387, ES0000012411, ES0000012445, ES0000012452, ES0000012783, ES0000012791, ES0000012825, ES0000012866, ES0000012882; FI0001004822; FI0001005167; FI0001005332, FI0001005407, FI0001005514, FI0001005522;
FR0000187361, FR0000187635, FR0000187874, FR0000188328, FR0000188690,
FR0000188989, FR0000189151, FR0010011130, FR0103230423, FR0103840098,
FR0104446556, FR0105427795, FR0105760112, FR0106589437; GR0110014165,
GR0114012371, GR0114015408, GR0124006405, GR0124011454, GR0124015497,
GR0124018525, GR0124021552, GR0124024580, GR0128002590, GR0133001140,
GR0133002155; IE0006857530, IE0031256211, IE0031256328, IE0032584868; IT0001448619, IT0003080402, IT0003171946, IT0003190912, IT0003242747, IT0003256820, IT0003271019, IT0003357982, IT0003413892, IT0003472336, IT0003477111, IT0003493258, IT0003522254, IT0003532097, IT0003535157, IT0003611156, IT0003618383; NL0000102101, NL0000102317,
NL0000102606, NL0000102671, NL0000102689, NL0000102697; PTOTECOE0011,
PTOTEGOE0009, PTOTEJOE0006, PTOTEKOE0003, PTOTEWOE0009,
Appendix B. Construction of variables
Observable market characteristics. Let xj be the (equally-weighted) daily average of a
variable x over the sample span of reference, where j=E D, indexes the EuroMTS (E) or the domestic MTS (D) platform, respectively. Following Eun and Sabherwal (2003) we compute the following log-transformations: tvol=ln[1 (+ volE/volD)]
, where vol is the nominal amount of trades in million euro; rsig =ln[1 (+ sigE/sigD)]
, where sig is the standard deviation of the first differenced logarithms of transaction prices (∆pj
);
ln[1 ( E D)]
qspr= + qsp −qsp , where qsp is the quoted bid/ask spread associated with the
transaction; espr=ln[1 (+ espE−espD)], where esp is the difference between transaction prices and the mid-point of the prevailing bid/ask quote.
Institutional variables. smty is a dummy taking value 1, if bonds have a maturity (in
terms of the difference between the maturity date and the issue date) less than 6.5 years, and 0, otherwise; prot is a dummy taking value 1, if countries have a high overall auction risks covering degree (Belgium, France, Germany, Ireland and the Netherlands, Finland and
Greece), and 0, otherwise; hour is a dummy taking value 1, if the number of quoting hours
for a bond on EuroMTS is higher than on the domestic MTS, and 0, otherwise; mspr is a dummy taking value 1, if the maximum bid/ask spread for a bond on EuroMTS is lower than the one on the domestic MTS, and 0, otherwise; mqty is a dummy taking value 1, if the minimum quantity for a bond on EuroMTS is higher than the one on the domestic MTS and 0, otherwise.
Other controls. liss (debt) is a dummy taking value 1, if bonds are from large issuers
(borrowers) - that is Italy, Germany or France (or Belgium) - and 0, otherwise; country dummies take value 1, when the bond is issued by the Treasury of that country, and 0, otherwise).
References
Albanesi S. and B. Rindi (2000), The Quality of the Italian Treasury Market, Asymmetric Information and Transaction Costs, Annales d’Economie et de Statistique, 60, p. 1-19. Andersson M., L.J. Hansen and S. Sebestyén (2006), Which News Moves the Euro Area
Bond Market?, ECB Working Paper, 631.
Bagella M., A. Coppola, R. Pacini and G. Piga (2006), Euro Debt Primary Market Annual Report, University of Rome “Tor Vergata” and UBM.
Baillie R.T., G.G. Booth, Y. Tse and T. Zabotina (2002), Price Discovery and Common Factor Models, Journal of Financial Markets, 5, p. 309-321.
Beber A., M.W. Brandt and K.A. Kavajecz (2008), Flight-to-Quality or Flight-to-Liquidity? Evidence from the Euro-Area Bond Market, Review of Financial Studies, forthcoming. Blanco R., S. Brennan and I. Marsh (2005), An Empirical Analysis of the Dynamic Relation
between Investment-Grade Bonds and Credit Default Swaps, Journal of Finance, 60, p. 2255-2281.
Brandt M.W., K.A. Kavajecz and S.E. Underwood (2007), Price Discovery in the Treasury Futures Market, Journal of Futures Markets, 27, p. 1021-1051.
Chakravarty S., H. Gulen and S. Mayhew (2004), Informed Trading in Stock and Option Markets, Journal of Finance, 59, p. 1235-1258.
Cheung C., F. de Jong and B. Rindi (2005), Trading European Sovereign Bonds: The Microstructure of the MTS Trading Platforms, ECB Working Paper, 432.
Chung C., B. Campbell and S. Hendry (2007), Price Discovery in Canadian Government Bond Futures and Spot Markets, Bank of Canada Working Paper, 4.
Dickey D.A. and W.A. Fuller (1979), Distribution of the Estimators for Autoregressive Time Series with a Unit Root, Journal of the American Statistical Association, 74, p. 427-431. Dunne P.G., M.J. Moore and R. Portes (2007), Benchmark Status in Fixed-Income Asset
Markets, Journal of Business Finance and Accounting, 34, p. 1615-1634.
U.S.-Listed Canadian Stocks, Journal of Finance, 58, p. 549-576.
Favero C., A. Missale and G. Piga (2000), EMU and Public Debt Management: One Money, One Debt?, CEPR Policy Paper, 3.
Fleming M. and E. Remolona (1999), Price Formation and Liquidity in the U.S. Treasury Market: The Response to Public Information, Journal of Finance, 54, 1901-1915. Galati G. and K. Tsatsaronis (2003), The Impact of the Euro on Europe’s Financial Markets,
Financial Markets, Institutions and Instruments, 12, pp. 165-221.
Green C.J. and E. Joujon (2000), Unified Tests of Causality and Cost of Carry: The Pricing of the French Stock Index Futures Contract, International Journal of Finance and Economics, 5, p. 121—140.
Hakkio C.S. and R. Rush (1991), Cointegration: How Short Is the Long Run?, Journal of International Money and Finance, 10, p. 571-581.
Harris F., T. McInish, G. Shoesmith and R. Wood (1995), Cointegration, Error Correction, and Price Discovery on Informationally Linked Security Markets, Journal of Financial and Quantitative Analysis, 30, p. 563-579.
Hasbrouck J. (1995), One Security, Many Markets: Determining the Contributions to Price Discovery, Journal of Finance, 50, p. 1175-1199.
Horvath M.T.K. and M.W. Watson (1995), Testing for Cointegration when Some of the Cointegrating Vectors Are Prespecified, Econometric Theory, 11, p. 984-1014.
Huang R.D. (2002), The Quality of ECN and Nasdaq Market Maker Quotes, Journal of Finance, 57, p. 1285-1319.
Huang R.D., J. Cai, and X. Wang (2002), Information-based Trading in the Treasury Note Interdealer Broker Market, Journal of Financial Intermediation, 11, p. 269-296.
Johansen S. (1995), Likelihood-Based Inference in Cointegrated Vector Autoregressive Models, Oxford University Press.
Kwiatkowski D., P.C.B. Phillips, P. Schmidt and Y. Shin (1992), Testing the Null Hypothesis of Stationary against the Alternative of a Unit Root, Journal of Econometrics, 54, p. 159-178.
Lee T. and Y. Tse (1996), Cointegration Tests with Conditional Heteroskedasticity, Journal of Econometrics, 73, p. 401-410.
Lehmann B.N. (2002), Some Desiderata for the Measurement of Price Discovery across Markets, Journal of Financial Markets, 5, p. 259-276.
Menkveld A.J., Y.C. Cheung and F. de Jong (2004), Euro Area Sovereign Yield Dynamics: The Role of Order Imbalance, ECB Working Paper, 385.
Pagano M. and E.L. Von Thadden (2004), The European Bond Markets under EMU, Oxford Review of Economic Policy, 20, p. 531-554.
Persaud A.D. (2006), Improving Efficiency in the European Government Bond Market, Discussion Paper ICAP plc.
Scalia A. and V. Vacca (1999), Does Market Transparency Matter? A Case Study, BIS Papers, 2, p. 113-144 (with comments).
Tse Y., J. Xiang and J.K.W. Fung (2006), Price Discovery in the Foreign Exchange Futures Market, Journal of Futures Markets, 26, p. 1131-1143.
Upper C. and T. Werner (2002), How Resilient Are Financial Markets to Stress? Bund Futures and Bonds during the 1998 Turbulence, BIS Papers, 12, p.110-123.
Veall M.R. and K.F. Zimmermann (1994), Goodness of Fit Measures in the Tobit Model, Oxford Bulletin of Economics and Statistics, 56, p. 485-499.
Short/medium maturity Long maturity Very long maturity Sum by country Percentage by country ATS 0 8 2 10 9.3 BEL 2 5 2 9 8.4 ESP 3 5 2 10 9.3 FIN 3 3 0 6 5.6 FRF 6 5 3 14 13.1 GEM 6 5 2 13 12.1 GGB 3 6 3 12 11.2 IRL 2 1 1 4 3.7 MTS 7 6 4 17 15.9 NLD 2 3 1 6 5.6 PTE 2 3 1 6 5.6 Sum by maturity 36 50 21 107 . Percentage by maturity 33.6 46.7 19.6 . 100.0
Tables and Figures
Table 1 ———— Selected benchmark government bonds by maturity and issuer
Note. The first and the second row (column) in italics present the sum and the percentage by maturity (issuer), respectively.
αE αD |αE|+αD Mean -0.2601 0.0594 0.3195 Minimum -0.6561 0.0009 0.0547 Maximum -0.0506 0.2304 0.6718 5th percentile -0.5183 0.0066 0.1297 25th percentile -0.3657 0.0222 0.1887 Median -0.2345 0.0465 0.3042 75th percentile -0.1457 0.0849 0.4395 95th percentile -0.0898 0.1453 0.5761
Table 2 ———— Estimated values of the feedback coefficients
Table 3 ———— Estimated price discovery measures for the EuroMTS platform
Number of bonds γE ζE AUT - Austria 10 0.1430 0.0988 BEL - Belgium 8 0.1824 0.1803 ESP - Spain 10 0.2558 0.2446 FIN - Finland 5 0.1963 0.2149 FRF - France 14 0.1800 0.1623 GEM - Germany 12 0.2779 0.2664 GGB - Greece 10 0.2008 0.2624 IRL - Ireland 4 0.5016 0.4773 MTS - Italy 13 0.0559 0.1799 NLD - the Netherlands 6 0.2654 0.2114 PTE - Portugal 6 0.1081 0.1114 Median . 0.1742 0.1740 Mean . 0.1966 0.2064 Std. error of mean . 0.0132 0.0117Note. Values in the second and third numerical column are equally weighted averages across bonds issued by the same country. Computations based on 98 bivariate VEC models.
Table 4 ———— Determinants of price discovery on the EuroMTS platform: Tobit models
γE ζE γE ζE γE ζE γE ζE 0.4397 0.4943 0.5313 0.5771 0.4520 0.4902 0.5352 0.5622 (0.1353) (0.1188) (0.1549) (0.1391) (0.1473) (0.1401) (0.1713) (0.1576) -0.8556 -0.7593 -0.7756 -0.7184 -0.9210 -0.7841 -0.8630 -0.7720 (0.2850) (0.2630) (0.2735) (0.2597) (0.2866) (0.2519) (0.2962) (0.2394) -1.2744 -0.5533 . . -0.8461 -0.00748 . . (0.6288) (0.6452) . . (0.6618) (0.6906) . . . . 0.2723 0.3133 . . 0.2759 0.3291 . . (0.3842) (0.3482) . . (0.4331) (0.3409) . . . . 0.0324 0.0455 0.0369 0.0465 . . . . (0.0238) (0.0227) (0.0246) (0.0228) . . . . 0.0893 0.1106 0.0936 0.1105 . . . . (0.0351) (0.0298) (0.0389) (0.0340) . . . . -0.0931 -0.0916 -0.1087 -0.0889 . . . . (0.0437) (0.0354) (0.0486) (0.0336) . . . . 0.0139 0.0343 0.0227 0.0329 . . . . (0.0256) (0.0267) (0.0265) (0.0273)Country dummies YES YES YES YES YES YES YES YES
0.0798 0.0745 0.0811 0.0743 0.0758 0.0687 0.0761 0.0681 (0.0058) (0.0050) (0.0060) (0.0056) (0.0059) (0.0048) (0.0059) (0.0048) LL 108.73 115.47 107.18 115.72 113.70 123.33 113.33 124.23 AIC -189.46 -202.94 -186.37 -203.44 -191.41 -210.66 -190.65 -212.46 Pseudo-R2 0.6247 0.5811 0.6127 0.5833 0.6610 0.6432 0.6583 0.6497 qspr σ tvol rsig espr smty prot hour mqty
Panel [A] Panel [B]
Model [1] Model [2] Model [1] Model [2]
Note. The intercept term, albeit included among the regressors, is omitted for ease of exposition. Statistically significant coefficients according to the 95 percent level confidence interval, calculated using the bootstrap method with 500 replications, are in bold. The number of observations is 98. Definitions of the regressors are provided in Appendix B.
Table 5 ———— Determinants of price discovery on the EuroMTS platform: OLS estimates
* γE * ζE * γE * ζE * γE * ζE * γE * ζE 2.6722 3.0393 3.5955 3.5923 2.5310 2.9618 3.3169 3.4028 (1.0961) (0.7499) (1.4753) (0.8875) (0.9806) (0.8161) (1.2806) (0.9046) -6.8009 -6.1305 -5.7250 -5.8945 -7.4250 -6.4518 -6.6761 -6.4774 (2.4410) (1.8755) (2.2597) (1.8174) (2.3402) (1.7342) (2.1377) (1.6911) -18.0010 -2.9919 . . -11.8074 1.8428 . . (8.1859) (4.5802) . . (6.6005) (4.8557) . . . . 2.1652 2.1720 . . 2.1297 2.2515 . . (3.5485) (2.1984) . . (3.9118) (1.8475) . . . . 0.3063 0.3306 0.3637 0.3291 . . . . (0.1594) (0.1343) (0.1784) (0.1280) . . . . 1.6794 1.1304 1.7403 1.1195 . . . . (0.6410) (0.2749 ) (0.6625) (0.2851) . . . . -1.3658 -0.9168 -1.5982 -0.8587 . . . . (0.6083) (0.3077) (0.6360) (0.2957) . . . . 0.6918 0.4164 0.8233 0.3838 . . . . (0.5015) (0.1888) (0.5673) (0.2071)Country dummies YES YES YES YES YES YES YES YES
LL -109.97 -71.69 -114.11 -71.24 -99.12 -57.49 -100.94 -56.57
AIC 245.94 169.38 254.23 168.49 232.24 148.98 235.89 147.15
AdjR2 0.4946 0.4998 0.4500 0.5043 0.5750 0.6071 0.5588 0.6144
Panel [A] Panel [B]
Model [1] Model [2] Model [1] Model [2]
mqty qspr tvol espr smty prot rsig hour
4.60 4.65 4.70 4.75 4.80 01/04 04/04 07/04 10/04 01/05 04/05 07/05 10/05 01/06 Domestic MTS EuroMTS
Figure 1 ———— Daily transaction prices on the MTS system
Note. Dashed (continuous) line indicates the logarithm of daily transaction prices recorded in the EuroMTS (domestic MTS) platform for a 15-year bond (code: IT0003242747), over the period January 2004 - March 2006.
Drivers of Liquidity and Trading
Activity Dynamics in the European
Treasury Bond Markets
Abstract
Knowledge about time-series variations in Treasury bond market liquidity and trading activity is limited. Using high-frequency transaction data for the three largest European markets (France, Germany and Italy) over the period July 2006 - June 2007, this work explores how liquidity and trading activity evolve over time; to what extent their dynamics interact; whether their dynamics exhibit some common patterns across bonds. Controlling for seasonal factors, we find that these co-movements are non-linear and driven by inventory concerns, stock market volatility, macroeconomic releases and monetary authorities’ liquidity management operations. Liquidity properties of this financial segment under financial distress are also discussed.
Keywords: Liquidity, trading activity, Treasury bond market, Europe, non-linearities, commonality.