School of Industrial and Information Engineering
Master of Science in Management Engineering
AB InBev SA/NV: A financial case study
about the largest brewery in the world
Supervisor: Prof. Giancarlo Giudici
Master Thesis of:
João Paulo Gutierrez Malandrino
N
o848973
2
“I always say, to have a big dream requires the same effort as
having a small dream. Dream big!”
3
Contents
1. Case Study ... 6
1.1. Introduction ... 6
1.1.1. History and Growth ... 6
1.1.2. Investors and the CEO ... 9
1.1.3. Figures and Notion of Size ... 11
1.1.4. Culture and Building a Better World ... 13
1.1.5. Corporate Governance ... 14
1.1.6. Revenues and Geographic Segmentation ... 15
1.1.7. Shareholding and Voting Rights ... 18
1.1.8. Listings on Stock Exchanges ... 20
1.1.9. Bonds ... 20
1.1.10. Income Statement and Balance Sheet ... 20
1.2. Open Issues ... 23 2. Teaching Note ... 24 2.1. Synopsis ... 24 2.2. Objectives ... 24 2.3. Target Audience ... 24 2.4. Discussion ... 25
2.4.1. In which geographical segments would make more sense to focus investments? ………. 25
2.4.2. Which is the best way for the company to expand its business? Should AB InBev SA/NV choose organic or inorganic growth? If organic, how? If inorganic, which would be interesting companies to acquire? ... 30
2.4.3. Which would be the best financing strategies for the investments? ... 46
2.4.4. Would a listing in another Stock Exchange make sense? If yes, in which one? . 54 3. Conclusions ... 59
4. Appendices ... 61
4
List of Tables
Table 1 - Revenue Breakdown by Region ... 17
Table 2 - Quantities of Each Type of Share ... 18
Table 3 - Holding Percentage of Each Type of Shareholder ... 18
Table 4 - Relevant Information from Reports from 2012 to 2016 ... 21
Table 5 - Important Indicators from 2012 to 2016 ... 22
Table 6 - Distribution of 2015 Beer Volume per Region ... 25
Table 7 – Beer Volumes of the Top 25 Consuming Countries in 2015 ... 26
Table 8 - Beer Market, AB InBev SA/NV Performance and Potential Increases per Segment .. 26
Table 9 - Relevant Local Brands in Western and Center Europe ... 31
Table 10 - Participation and Market Share Ranking of African Breweries ... 32
Table 11 - Top 15 African Countries by Population ... 33
Table 12 - Top 15 Asian Countries by Population... 34
Table 13 - Qualitative Aspects of Target Companies ... 39
Table 14 - Key Facts about Asahi, Kirin and AB InBev ... 41
Table 15 - Relevant Information from Asahi, Kirin and AB InBev Reports ... 41
Table 16 - Important Indicators about Asahi, Kirin and AB InBev ... 41
Table 17 - Pros and Cons about Asahi Group and Kirin Holdings ... 43
Table 18 - Equity and Enterprise Values of Asahi, Kirin and AB InBev ... 44
Table 19 - Retained Earnings and Dividend Information from 2012 to 2016 ... 48
Table 20 - Net Financial Debt/EBITDA from 2012 to 2016 ... 50
Table 21 - Relevant Information about Stock Exchanges where AB InBev is Listed ... 54
Table 22 – Top 20 Stock Exchanges in the World in Terms of Market Cap ... 55
5
List of Exhibits
Exhibit 1 – Timeline ... 8
Exhibit 2 - M&A History ... 8
Exhibit 3 - Scenario of the Beer Global Market ... 9
Exhibit 4 - Market Capitalization from 2004 to 2016 ... 12
Exhibit 5 - Key Facts ... 13
Exhibit 6 - Revenues and EBITDA from 2012 to 2016 ... 15
Exhibit 7 – Geographical Segments ... 16
Exhibit 8 - Geographic Footprint of the Combination with SABMiller ... 17
Exhibit 9 - Shareholder Structure ... 19
Exhibit 10 - Total Volume and AB InBev SA/NV Share per Segment ... 27
List of Appendices
Appendix 1 - Major Holders of Ordinary and Restricted Shares ... 61Appendix 2 - Outstanding Bonds as at 16,May,2017 ... 62
Appendix 3 - Consolidated Income Statement ... 63
Appendix 4 - Consolidated Statement of Financial Position ... 64
Appendix 5 - Weighted Average Number of Shares and EPS Calculation ... 65
Appendix 6 - Reconciliation and Net Finance Cost ... 66
Appendix 7 - Regional Breakdown of the Four Largest Breweries ... 67
6
1. Case Study
1.1. Introduction
1.1.1. History and Growth
Anheuser-Busch InBev SA/NV is the largest brewery in the world. The Brazilian-Belgium group has offices and operations worldwide and owns approximately 500 brands, reaching over 150 countries with its products. The history of the firm is full of M&A deals and can be described trough the establishment of four major breweries: AmBev, Interbrew, Anheuser-Busch and SABMiller.
Even though the global headquarter currently is in Leuven, Belgium, the history of this conglomerate starts in Brazil, in 1885. In this year, Antarctica was founded in São Paulo and 3 years later it’s most relevant national competitor, Brahma, was established in Rio de Janeiro. Both companies have acquired many other smaller breweries in South and Central Americas and after more than 100 years competing for the leadership in the Brazilian market, in 1999, they merged after the sale of some plants and brands as imposed by the Brazilian market authority. At that moment, the fifth largest brewery in volume of the world was born and named AmBev.
Many years before the beginning of AmBev, the history of Interbrew started. The
company was created in 1988, through the merger of two Belgium breweries: Artois, which is
the producer of Stella Artois (registered in 1366) and Piedboeuf (established in 1812),
producer of Jupiler. Interbrew by itself also has a successful expansion background, including the acquisition of the German Beck’s and the Canadian Labatt, which was the owner of breweries, sport teams and even a communication network in Canada.
In Belgium, 2004, AmBev and Interbrew merged creating InBev. Before the deal, the beer market, in volume, was led by Anheuser-Busch, followed by SABMiller, Interbrew, Heineken and AmBev. The merger of the fifth and the third largest breweries created a new global market leader: InBev, a Belgium company controlled by Brazilians.
It is important to clarify that, in Brazil, AmBev has continued to exist as a subsidiary of AB InBev SA/NV, even after the merger with Interbrew in Belgium. In fact, AmBev S/A is the most valuable company on the São Paulo Stock Exchange (BMF&FBOVESPA: ABEV3) as at 2017,
January 2, with a market capitalization of roughly US$80 billion1. The company is also listed
on the New York Stock Exchange (NYSE: ABEV) via American Depositary Receipts (ADRs). AB
InBev SA/NV is a controlling shareholder of AmBev S/A with approximately 62%2 ownership.
The two entities are independent and each one has its own management. They have signed agreements referring to production and commercialization of beers.
1 São Paulo Stock Exchange (http://www2.bmfbovespa.com.br/capitalizacao-bursatil/BuscarBursatilGeral.aspx?idioma=en-us) 2 AB InBev SA/NV Full 2016 Annual Report
7 Meanwhile, in the United States, the Anheuser-Busch was growing. The American
brewery has its roots in Missouri since 1852, and is the owner of well-known brands such as
Budweiser, Bud Light and Michelob. AB had 12 plants in the USA and 173 overseas.
Nonetheless, the leading position did not stop InBev owners from expanding and
controlling the beer market even more. In 2008, InBev and Anheuser-Busch merged, creating Anheuser-Busch InBev (AB InBev). The company, at that moment, had around 200 brands and reinforced InBev’s previous status of world’s largest beer producer. AB InBev became one of the largest Fast Market Consumer Good companies, together with Nestlé, P&G, Unilever, PepsiCo and others.
In 2012 AB InBev made another deal acquiring the Mexican group Modelo, owner of the famous brand Corona. After 4 years of operations and consolidation, AB InBev decided to make another big move: the target now was its largest competitor, the UK-based SABMiller.
SABMiller was created 1999 through the merger of South African Breweries (founded in 1895) and the US-based Miller (founded in 1855), was the owner of key brands like Miller and Foster and more importantly, had a good penetration in markets where AB InBev did not.
By the end of 2015, AB InBev made a bid for its rival. SABMiller accepted the offer of
more than US$100 billion4 but the deal still required the approval of regulatory agencies,
especially the US Department of Justice. Due to its size, SABMiller had to spin off a part of its
holdings, which resulted in the sale of many brands (including Miller) to different brewery
groups.
In 2016, October, the third-largest M&A deal in history5 was completed and
Anheuser-Busch InBev SA/NV was created as the absolute global leader in the beer market, with a
combined annual revenue of US$55.56 billion (about 30% of the global market7) and
approximately 500 brands.
3 Wikipedia (https://en.wikipedia.org/wiki/Anheuser-Busch_InBev)
4 Wall Street Journal (https://www.wsj.com/articles/sabmiller-ab-inbev-shareholders-approve-100-billion-plus-merger-1475059015) 5 Financial Times (https://www.ft.com/content/925d4c1e-84f7-11e6-a29c-6e7d9515ad15)
6 AB InBev SA/NV Analyst Call Presentation
(http://www.ab-inbev.com/content/dam/universaltemplate/ab-inbev/investors/releases/30August2016/Presentation%20Analyst%20Call%2030%20August%202016.pdf)
8 The timeline and the M&A history of the company are on exhibits 1 and 2:
Exhibit 1 – Timeline
Exhibit 2 - M&A History8
9 Currently, AB InBev SA/NV’s main competitors are The Heineken Company, Carlsberg Group, MolsonCoors and other breweries in Asia. The competitors and the brands they possess are on the subsequent exhibit:
Exhibit 3 - Scenario of the Beer Global Market9
1.1.2. Investors and the CEO
The history of Jorge Paulo Lemann is strictly related to the growth of the largest brewery in the globe. Lemann was born in Rio de Janeiro in a family of Swiss immigrants. During his youth, he used to play tennis at professional level. He has won the Brazilian national championship five times and has even played Davis Cup and Wimbledon tournaments.
A 22 years-old Lemann received a bachelor’s degree in economics from Harvard
University, where he graduated in only three years. He did not like Harvard and missed Rio de Janeiro’s beaches, so he created a system that allowed him to graduate faster. Before signing up for a subject, he used to gather as many information as possible interviewing professors and students and even seeking for previous exams. The final exams varied little from year to year, which made easier for him to always be approved.
10 According to Lemann, going to Harvard was worthwhile for two main reasons. Firstly because it motivated him to be creative in reaching his goals, and secondly because he developed the crucial skill of choosing excellent partners. The career of a natural winner and a goal-driven entrepreneur has started to be drawn.
After working as a trainee in Credit Suisse in Switzerland and going back to Brazil, Lemann, Carlos Alberto Sicupira and Marcel Herrmann Telles founded the investment bank Garantia, in 1971. The firm was ahead of its time and it is still known for being one of the most innovative and prestigious investment banks in Brazilian history, described by Forbes as the “Brazilian version of Goldman Sachs”.
Among other nationally relevant deals such as Lojas Americanas (a large retailer), Garantia acquired Brahma in 1989. This was the first moment when Jorge Paulo Lemann invested in a brewery. The seed of one the largest corporate groups in the world has been planted.
Due to a series of personal and economic reasons, Garantia was sold to Credit Suisse First Boston in 1998. Of course, Lemann and his partners would not stop investing and expanding their businesses. Through the first Brazilian private equity fund, GP Investments, Lemann and his partners orchestrated the merger of the two largest national breweries, creating AmBev in 1999.
Under a complex ownership structure involving the Brazilian private owners (Lemann, Sicupira and Telles), Belgium families, funds and holdings, AmBev merged with Interbrew and then with Anheuser-Busch. More recently, in 2016, AB InBev acquired SABMiller, creating AB InBev SA/NV.
In 2004, Lemann, Sicupira and Telles founded 3G Capital: a Brazilian private equity fund
with headquarters in Brazil and USA, through which investments in breweries were made. 3G Capital has become even more famous after partnering up with Warren Buffet’s Berkshire Hathaway for some acquisitions. Lemann and Buffet are friends and together they have invested in world famous companies unrelated to the beer market such as Burger King, Tim Hortons and Kraft Foods.
Under the management of the two funds, in 2015, Kraft merged with Heinz, creating The Kraft Heinz Company, a new giant in the Fast Market Consumer Good. Following the
expansion spirit of the beer tycoons, Kraft Heinz placed a takeover bid in 2017, February, for
Unilever. The Dutch-British company’s shareholders refused the US$143 billion10 offer. This
would have been one of the largest corporate deals in history.
Besides the three Brazilian investors who founded Garantia, another key character of the group’s development is Carlos de Alves Brito, who joined Brahma back in 1989. After holding several positions in AmBev, Brito became its CEO. Afterwards, he became North America Zone President of InBev, CEO of AB InBev and is currently the CEO of AB InBev SA/NV. He is known for cost efficiency strategies like zero-based budgeting, high performance
requirements, strong corporate culture implementation, massive layoffs and for supporting
11 aggressive bonuses for top managers. One example of compensation plan is the 2020 Dream Incentive Plan, which was designed to pay out a bonus pool of around US$350 million to 65
senior managers if annual revenue reaches US$100billion between 2020 and 202211.
Even though Lemann is often seen as an overly ambitious businessperson, he supports many social and entrepreneurial initiatives in Brazil. Among others, he is the founder of Fundação Lemann and co-founder of Fundação Estudar and Instituto Tênis: the first two are foundations focused on education and the third, on sports. The other Brazilian shareholders of the conglomerate also support social projects in the country.
According to Forbes 2017, Jorge Paulo Lemann is the twenty-second richest person the world and first in Brazil, with a net worth of US$29.2billion12. Telles is the third and Sicupira is
the forth in the national ranking. The sources of wealth of the three are mainly participations in AB InBev SA/NV, 3G Capital and Lojas Americanas.
1.1.3. Figures and Notion of Size
The group Anheuser-Busch InBev SA/NV is big. But how big?
The annual revenue reached more than US$45 billion in 2016, and after the acquisition of SABMiller the expected top line for 2017 is around US$55.5 billion, which represents an increase of more than 20%. Nestlé, the consumer goods market revenue leader, had a US$91
billion13 income in 2016, of which US$42 billion14 came from all kinds of its beverages. The
Heineken Company, second largest brewery in the world, had US$23 billion15.
According to 2016’s full year financial report, the brewery’s market capitalization is US$214 billion. Based on the raking developed by PwC of the most valuable companies, using
data as at 2016, March 31, AB InBev used to occupy the twenty-second position16. However,
it is important to remind that the group tends to increase its value and improve its position due the acquisition of SABMiller. In fact, in the moment of the writing of this section, on 2017, May 11, AB InBev SA/NV is valued at US$229 billion and occupies the sixteenth position17.
11 CityA.M.
(http://www.cityam.com/238045/ab-inbev-brews-350m-bonus-for-top-bosses-if-the-company-hits-ambitious-2020-revenue-targets)
12 Forbes (https://www.forbes.com/billionaires/list/#version:static)
13 Nestlé Full 2016 Annual Report
(http://www.nestle.com/asset-library/documents/library/documents/financial_statements/2016-financial-statements-en.pdf)
14 Nestlé Full 2016 Annual Reports considering revenues from powdered and liquid beverages, water, milk products and ice cream 15 Heineken Full 2016 Annual Report
(http://www.theheinekencompany.com/-/media/Websites/TheHEINEKENCompany/Downloads/PDF/Annual-Report-2016/Heineken-NV-2016-Annual-Report.ashx)
16 PwC (https://www.pwc.com/gx/en/audit-services/publications/assets/global-top-100-companies-2016.pdf) 17 Dog of the Snow (http://dogsofthedow.com/largest-companies-by-market-cap.htm)
12 The chart below considers the market capitalization since 2004, when InBev was created,
according to annual reports disclosed by the group18:
Exhibit 4 - Market Capitalization from 2004 to 2016
It is clear that the acquisitions of the conglomerate have a direct impact on the market capitalization. The largest percentage increases are from 2008 to 2009 and from 2012 to 2013, respectively 127.5% and 63.8%. In 2008, the merger with Anheuser-Busch occurred and in 2012, the Modelo group was acquired. Overall, from 2004 to 2016, the market cap increased more than 10 times and the CAGR (compound annual growth rate) was 21.6%.
AB InBev SA/NV reaches more than ¾ of all the countries in the world and has operations
in more than ¼ of them. The number of plants is around 15519, with approximately 26% in
Asia, 25% in Latin America and 16% in North America. The Brazilian-Belgium group counts on more than 200,000 collaborators, which is equivalent to the population of a medium-large Italian city such as Brescia or Parma.
The volume of beer produced in 2016 disclosed was more than 43.4 billion liters. The
Heineken Company produced 22.8 billion liters, Carlsberg Group produced 11.620 and
MolsonCoors 6.621. By itself, AB InBev SA/NV could fill almost 14,000 long course Olympic
swimming pools22 with beer. Additionally, AB InBev SA/NV produced other 6.6 billion liters of
non-beer volume, including for instance Guaraná Antartica, a worldwide famous Brazilian soft drink.
The brewery possesses over 50023 brands, including sub-brands, local brands,
multi-country brands and global brands. For means of comparison, Unilever, that produces food,
beverages, home care and personal care items, owns around 40024 brands. According to
BrandZ25, out of the ten most valuable beer brands in the world, seven are in possession of
18 AB InBev SA/NV Reports (http://www.ab-inbev.com/investors/reports-and-filings.html)
19 Statista (https://www.statista.com/statistics/269117/number-of-beverage-plants-of-anheuser-busch-inbev-by-region/) 20 Carlsberg Full 2016 Annual Report (https://carlsberggroup.com/media/10013/01_uk_08022016_fy2016-results.pdf) 21 MolsonCoors 2016 Quarterly Reports (http://ir.molsoncoors.com/financials/financial-summary/default.aspx) 22 Olympic long course swimming pool’s dimensions: 50m x 25m x 2.5m
23 Wikipedia (https://en.wikipedia.org/wiki/Anheuser-Busch_InBev)
24 The Guardian (https://www.theguardian.com/business/1999/sep/22/unilever) 25 BrandZ (http://wppbaz.com/admin/uploads/files/BZ_Global_2016_Report.pdf)
13 AB InBev SA/NV. The worldwide most valuable leader, Budweiser, is one of the three global brands the company owns, together with Stella Artois and Corona.
Exhibit 5 - Key Facts
1.1.4. Culture and Building a Better World
The company follows 10 guiding principles that describe the group’s dream, people and culture. The dream, which is to become the Best Beer Company Bringing People Together for
a Better World, energizes everyone to work in the same result-oriented direction. The
recruitment and the career development are thought to retain employees, who are motivated to never be completely satisfied and always consider cost efficiency. The consumer is the boss and collaborators, who are firm’s main asset, must have an “owner thinking”: results, leadership, quality and hard work should always be kept in mind.
Besides the aggressiveness in relation to financial results, AB InBev SA/NV has a strong social and environmental bias and thus conducts projects in many fields, especially in
developing countries. Below there are some examples from Building a Better World Program: Investments in small retailers
Enhancement in growers’ productivity and livelihood Boost of communities through use of local ingredients
Enhancement of access to clean water and watershed restoration Use of renewable energies and recycled materials
Increase in awareness about harmful drinking Improvement of road safety
14
1.1.5. Corporate Governance
AB InBev SA/NV’s adheres the principles and provisions of the Belgian Corporate
Governance Code, once it is incorporated under Belgium law and listed on Euronext Brussels. The Corporate Governance ensures responsible management and proper control of the company, through framework of best practices, way of thinking and modus operandi.
As the brewery has the listing of ADSs (American Depositary Shares) representing ordinary shares on the New York Stock Exchange (NYSE), the NYSE Corporate Governance Rules for Foreign Private Issuers are applicable to the company. Moreover, the firm has registered with the SEC (Securities and Exchange Commission) and as a result, it is subject to Sarbanes-Oxley Act of 2002 and the SEC rules about corporate governance.
Since the company has operations spread all over the globe, it faces a broad range of business practices and cultures. As a result, it is key that the code of conduct is clear, strict and consistent. AB InBev SA/NV’s Code of Business Conduct provides information about the principles, compliance, human rights and ethical conduct to be followed by the employees. Besides the code, the brewery developed an Anti-Corruption Policy to aware the
collaborators about corruption when dealing not only with commercial partners, but also with public officials.
As mentioned before, AB InBev SA/NV’s CEO is the Brazilian Carlos de Alves Brito, who first joined the company in 1989, when it was still Brahma. To perform his duties of daily management, Brito is assisted by the Executive Board of Management (EBM). The EBM is composed by the 21 members listed below:
Chief Executive Officer (the chairman of the EBM) Chief Financial and Technology Officer
Chief Marketing Officer Chief Supply Officer Chief People Officer
Chief Legal and Corporate Affairs Officer Chief Procurement Officer
Chief Sales Officer Chief Integration Officer
Chief Supply Integration Officer Chief Disruptive Growth
Chief Strategist & External Affairs Officer Asia-Pacific South Zone President Asia-Pacific North Zone President Middle Americas Zone President Europe Zone President
North America Zone President Latin America North Zone President
15 Latin America South Zone President
Latin America COPEC Zone President Africa Zone President
The Board of Directors is composed of three independent directors, three members appointed by the restricted shareholders and nine members appointed by the Stichting Anheuser-Busch InBev, a foundation that represents interests of the Brazilian and Belgium founding families. The influence of the three founders of the investment bank Garantia is still very clear: Marcel Herrmann Telles, Carlos Alberto Sicupira and Paulo Alberto Lemann (Jorge Paulo’s son) are three of the nine members appointed by the foundation. Four committees assist the Board of Directors: Audit, Finance, Nomination and Remuneration committees.
The group issues the Corporate Governance Charter, whose aim is to provide transparent disclosure of the company’s corporate governance in detail. The information of this section
was removed from it26. The document also presents rules and agreements related to:
shareholders, capital, shares, voting rights, meetings, dividends, communication, the board, committees, executive management and code of conduct.
1.1.6. Revenues and Geographic Segmentation
On the following chart, there are the revenues accompanied by its CAGR and the EBITDA (earnings before interest, tax, depreciation and amortization) accompanied by the EBITDA margin of past 5 years. All the information was extracted from firm’s official annual reports.
Exhibit 6 - Revenues and EBITDA from 2012 to 2016
26 AB InBev SA/NV Corporate Governance Charter
(http://www.ab-inbev.com/content/dam/universaltemplate/ab- inbev/investors/corporate-gov-pdf-archive/cg/corporategovernancelanding/Governance%20Charter%20AB%20InBev%2018.10.2016%20-%20FINAL.pdf) 0 5 10 15 20 25 30 35 40 45 50 Billions US$
Revenues and EBITDA in Previous 5 Years
revenue EBITDA 2012 2013 2014 2015 2016 CAGR of revenues=3.44% 39.0% 54.2% 39.2% 39.1% 35.9%
16 As a whole, revenue has been growing in past years, except from 2014 to 2015, when it fell almost US$3.5 billion. The growth from 2012 to 2016 was 14.5% and the CAGR equal to 3.4%. Annual average revenue in this period was US$43.8 billion.
EBITDA and EBITDA margin has been falling slightly in the past 3 years. In 2013, however, they were much higher and the margin reached almost 55%. The abrupt increase on both values from 2012 to 2013 catches attention: EBITDA raised more than 50% and EBITDA margin almost 40%. From 2012 to 2016, average EBITDA was US$18.2 billion and EBITDA average margin was 41.5%.
AB InBev SA/NV is currently geographically segmented in North America, Latin America West, Latin America North, Latin America South, EMEA (Europe, Middle East and Africa) and Asia Pacific. The countries currently belonging to each segment are shown in exhibit 7.
It is relevant to highlight that the regions and their composition change based on the M&A deals that happen during the fiscal year. For instance, after the acquisition of SABMiller, Australia, Vietnam and India were added to Asia Pacific segment; and Middle East and Africa began to be reported together with Europe as EMEA.
Exhibit 7 – Geographical Segments27
27 AB InBev SA/NV 2017 First Quarter Presentation
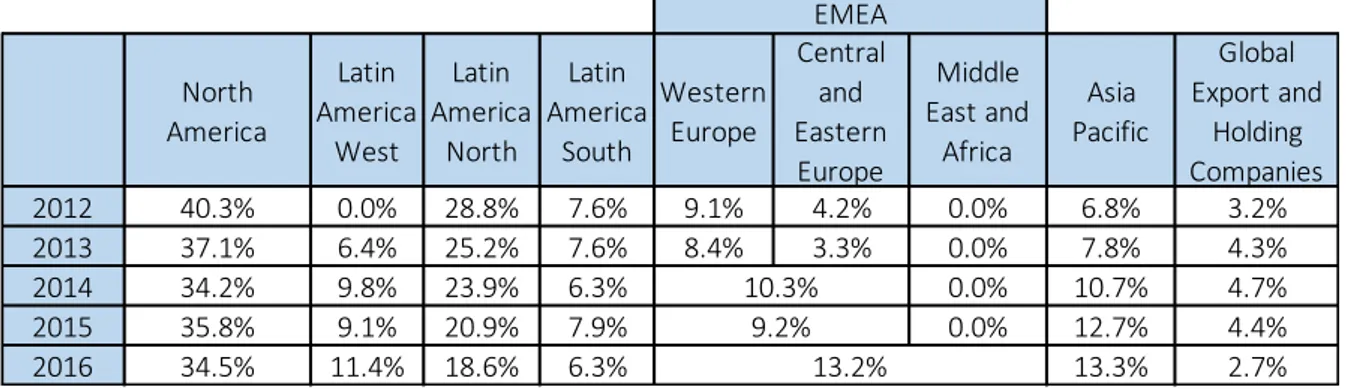
17 The table below shows the complete revenue breakdown, based on information disclosed by the brewery, in percentage:
Table 1 - Revenue Breakdown by Region
Analyzing the data, one can notice that North America’s participation in total revenues has been falling. The same happens to Latin America North, where the main consuming country is Brazil. Together, the participation of those two regions has fallen more than 23% in the past 5 years. The European market has also demonstrated a slight decrease in
participation, possibly due to the fierce competition, once The Heineken Company and Carlsberg Group own strong brands in the area.
On the other hand, the growth on Asia Pacific Market is remarkable: the increase in participation from 2012 to 2016 is almost 100% and the CAGR is 18.5%. Latin America West has also seen a major raise in percentage of total revenues, mainly due to the acquisitions of Grupo Modelo and SABMiller, owners of brands in this region. SABMiller acquisition was also key for Africa, from where AB InBev did not have revenue flowing. As a matter of fact, the complete geographic footprint of the group in relation to the combination with the UK-based brewery is represented in the following map:
Exhibit 8 - Geographic Footprint of the Combination with SABMiller28
28 AB InBev SA/NV Analyst Call Presentation
(http://www.ab-inbev.com/content/dam/universaltemplate/ab-inbev/investors/releases/30August2016/Presentation%20Analyst%20Call%2030%20August%202016.pdf) North America Latin America West Latin America North Latin America South Western Europe Central and Eastern Europe Middle East and Africa Asia Pacific Global Export and Holding Companies 2012 40.3% 0.0% 28.8% 7.6% 9.1% 4.2% 0.0% 6.8% 3.2% 2013 37.1% 6.4% 25.2% 7.6% 8.4% 3.3% 0.0% 7.8% 4.3% 2014 34.2% 9.8% 23.9% 6.3% 0.0% 10.7% 4.7% 2015 35.8% 9.1% 20.9% 7.9% 0.0% 12.7% 4.4% 2016 34.5% 11.4% 18.6% 6.3% 13.3% 2.7% 10.3% 9.2% 13.2% EMEA
18 The Global Export and Holding Companies include the company’s global headquarters, the export businesses that have not been allocated to the regions, and the interim supply agreement with Constellation Brands, a beer import company.
1.1.7. Shareholding and Voting Rights
The following information is also based on data from the Corporate Governance Charter as at 2016, October 11.
There are mainly two types of shares: ordinary and restricted. The restricted shares are unlisted and are subject to rules laid out by the issuing company and agreed upon by the owner of the shares. There are also treasury shares (included in the ordinary shares), which are held by AB InBev SA/NV and some of its subsidiaries. All the stocks of the company have the same rights (each share entitles its owner to one vote).
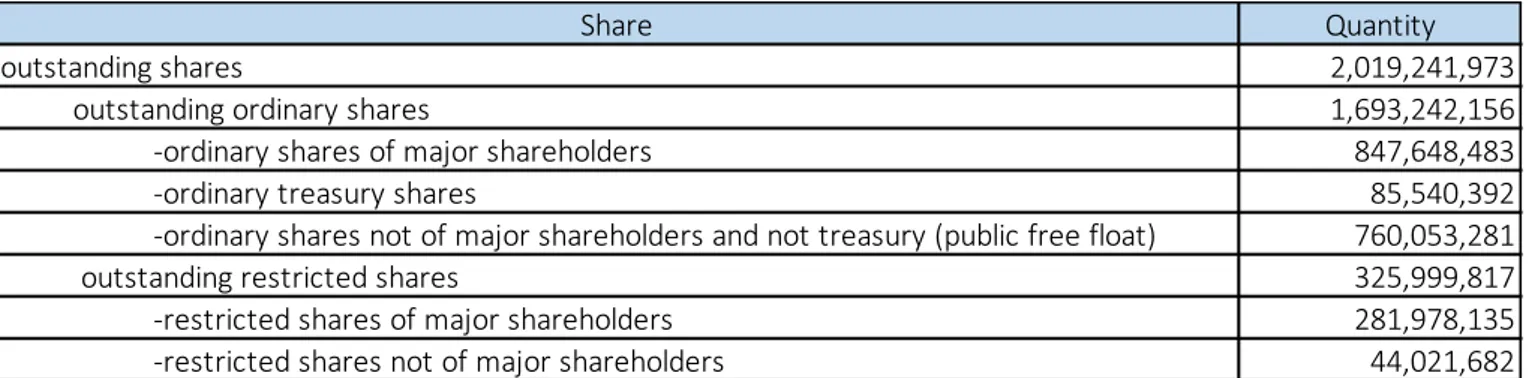
The following table represents the number of each type of share:
Table 2 - Quantities of Each Type of Share
The holding percentages (percentage of voting rights) are calculated excluding treasury shares, which means the base for the calculation is the number of outstanding shares net of the number of ordinary treasury shares: 1,933,701,581.
Table 3 - Holding Percentage of Each Type of Shareholder
As seen in the table, less than half of the company’s equity value is traded on Stock Exchanges. The free float is composed of 760,053,281 ordinary shares or 39.31%. This
represents approximately US$84 billion, based on the US$213.99 billion market cap reported in 2016.
Share Quantity
outstanding shares 2,019,241,973
outstanding ordinary shares 1,693,242,156 -ordinary shares of major shareholders 847,648,483 -ordinary treasury shares 85,540,392 -ordinary shares not of major shareholders and not treasury (public free float) 760,053,281 outstanding restricted shares 325,999,817 -restricted shares of major shareholders 281,978,135 -restricted shares not of major shareholders 44,021,682
Holding Percentage Percentage
ordinary shares (excluding the treasury shares) 83.14%
-major shareholders of ordinary shares 43.84%
-public free float 39.31%
restricted shares 16.86%
-major shareholders of restricted shares 14.58%
19 The AB InBev SA/NV has a complex shareholding structure including ownership by many entities under laws of different countries. Once again, it is strong the presence of Marcel Herrmann Telles (MH Telles), Carlos Alberto Sicupira (CA Sicupira) and Jorge Paulo Lemann (JP Lemann) as owners of great majority of BRC Luxembourg, which possesses 50% of Stichting Anheuser-Busch InBev (Stichting AK Netherlands). Besides, BRC Luxembourg owns directly another 1.94% of the brewery.
Stichting Anheuser-Busch InBev possesses 34.29% of the group, and it is by far the major shareholder. Therefore, based on market cap disclosed on 2016’s full financial report, the
three Brazilian founders are owners of almost US$35 billion29 of company’s equity, only
through BRC Luxembourg. Telles, for instance, is the only owner of MHT Benefiting Holding, which has 0.19% of the brewery (around US$407 million). The list of major shareholders is on appendix 1 and below, there is the company’s full ownership structure:
Exhibit 9 - Shareholder Structure
20
1.1.8. Listings on Stock Exchanges
AB InBev SA/NV is traded on the Brussels Stock Exchange (Euronext: ABI), with secondary listings on the Mexican Stock Exchange (BMV: ANB) and on the Johannesburg Stock Exchange (JSE: ANH).
Moreover, the group has American Depositary Shares (ADSs) on the New York Stock Exchange (NYSE: BUD). They are represented by American Depositary Receipts (ADRs) and each ADR is equivalent to one share.
The company’s ordinary shares are included in 56 indexes all over the world, including Euronext, DJ (Dow Jones), FTSE (Financial Times Stock Exchange), MSCI (Morgan Stanley Capital International), S&P (Standard & Poor’s) and TRIB (Temple Records Index Bureau) indexes.
1.1.9. Bonds
The conglomerate has 70 bonds outstanding as at 2017, May 16. The offers vary in terms of size, currency, type of coupon, value of coupon, maturity and market of trade. The
company has offers from US$726 thousand up to US$11 billion and periods of duration from 3 years up to 40 years. Among the 70 outstanding bonds, only five have floating coupons.
Appendix 2 shows the list of outstanding bonds.
1.1.10.
Income Statement and Balance Sheet
According to 2016’s full report, AB InBev SA/NV disclosed the subsequent key facts: Revenue: US$45.517 billion
EBITDA: US$16.360 billion
Normalized EBITDA: U$S16.753 billion
Profit attributable to equity holders: US$1.241billion
Normalized profit attributable to equity holders: US$4.853 billion
Weighted average number of ordinary and restricted shares: 1.717 billion Normalized earnings per share (EPS): US$2.83
Earnings per share (EPS): US$0.72
Dividends per share: U$S3.85 (US$1.71 interim dividend + US$2.14 dividend) Payout ratio: 136%
Net financial debt: US$107.953 billion Non-current assets: US$215.320 billion Current assets: US$43.061 billion
21 Non-current liabilities: US$136.841 billion
Current liabilities: US$40.116 billion Equity: US$81.425 billion
The normalized values are the ones adjusted for non-recurring items, defined by the company as “those that in management’s judgment need to be disclosed by virtue of their size or incidence”.
It is interesting to highlight that goodwill corresponds to 63.4% of non-current assets and 52.8% of total assets. Another point that catches attention is that US$10.086 billion of equity are non-controlling interests related to AB InBev SA/NV’s 62% ownership of AmBev S/A, the Brazilian subsidiary mentioned previously.
A curiosity is that the par value of shares is only €0.6134, which multiplied by the number
of outstanding shares (2.019 billion), results in an issued capital of €1.239 billion (or US$1.736 billion)
The Consolidated Income Statement is on appendix 3 and the Consolidated Balance Sheet or Consolidated Statement of Financial Position in on appendix 4. In addition, the detailed calculation of weighted average number of ordinary and restricted shares and earnings per share is described on appendix 5.
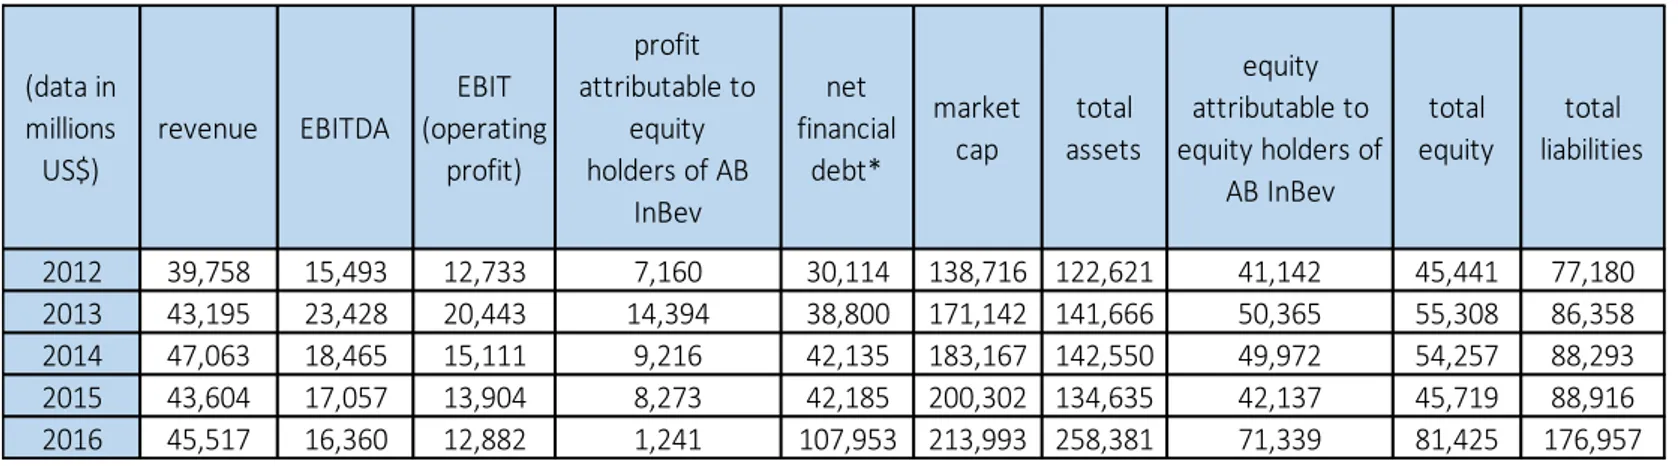
Besides the key facts of 2016, on the following table, there are relevant information provided in the previous full year reports, from 2012 to 2016:
Table 4 - Relevant Information from Reports from 2012 to 2016
* net financial debt defined as non-current and current interest-bearing loans and borrowings and bank overdrafts minus debt securities and cash and cash equivalents
(data in millions US$) revenue EBITDA EBIT (operating profit) profit attributable to equity holders of AB InBev net financial debt* market cap total assets equity attributable to equity holders of AB InBev total equity total liabilities 2012 39,758 15,493 12,733 7,160 30,114 138,716 122,621 41,142 45,441 77,180 2013 43,195 23,428 20,443 14,394 38,800 171,142 141,666 50,365 55,308 86,358 2014 47,063 18,465 15,111 9,216 42,135 183,167 142,550 49,972 54,257 88,293 2015 43,604 17,057 13,904 8,273 42,185 200,302 134,635 42,137 45,719 88,916 2016 45,517 16,360 12,882 1,241 107,953 213,993 258,381 71,339 81,425 176,957
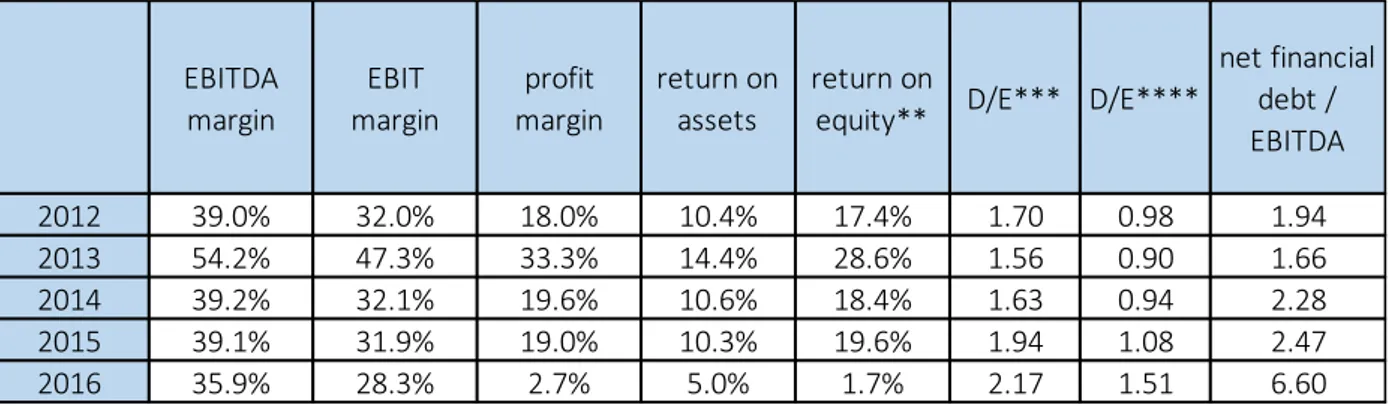
22 According to the information provided, it is possible to calculate some important indicators:
Table 5 - Important Indicators from 2012 to 2016
**return on equity defined as profit attributable to equity holders divided by equity attributable to them ***leverage ratio defined as total liabilities divided by total equity
****leverage ratio defined as non-current interest bearing loans and borrowings + current interest bearing loans and borrowings + bank overdrafts, divided by total equity
Analyzing the data provided, it is reasonable to affirm that from 2012 to 2015 revenues, EBITDA, EBIT and profit were relatively stable, except from 2013, when the company had a great performance in terms of profitability due to new business in Mexico, after acquiring Grupo Modelo, in 2012. In 2016, year of the combination with SABMiller, revenue, EBITDA and EBIT were similar to previous years, but profit attributable to equity holders was much lower due to high non-recurring finance costs related to the deal. The appendix 6 shows the composition of the net finance cost as well as the reconciliation between normalized EBITDA and profit attributable to equity holders.
It is interesting to point out that in this 5-year period, total assets had a CAGR higher than 20% and the market capitalization, higher than 10%, which indicates a fast growth of the company. However, net financial debt and total liabilities have also increased year after year, in an even faster pace. In 2016, all those figures faced an abrupt increase because of the combination with the UK-based brewery: total assets and total liabilities almost doubled, while net financial debt increased by 156%.
The margins and indicators calculated follow a tendency: EBITDA margin of 39%, EBIT margin of 32%, profit margin of 19%, return on assets of 10% and return on equity of 18%, with exceptions in 2013, when they were much larger and in 2016, when they were lower.
The first two leverage indicators are approximately stable from 2012 to 2014 and in the last two years they have raised considerably. In 2016, for the first time, total liabilities became more than double of total equity. A third leverage indicator used by the company is net financial debt/EBITDA, which has been increasing since 2013. Once again, it is clear the impact of the combination with SABMiller, making the indicator reach 6.60 in 2016.
EBITDA margin EBIT margin profit margin return on assets return on
equity** D/E*** D/E****
net financial debt / EBITDA 2012 39.0% 32.0% 18.0% 10.4% 17.4% 1.70 0.98 1.94 2013 54.2% 47.3% 33.3% 14.4% 28.6% 1.56 0.90 1.66 2014 39.2% 32.1% 19.6% 10.6% 18.4% 1.63 0.94 2.28 2015 39.1% 31.9% 19.0% 10.3% 19.6% 1.94 1.08 2.47 2016 35.9% 28.3% 2.7% 5.0% 1.7% 2.17 1.51 6.60
23
1.2. Open Issues
As mentioned before, in 2015, AB InBev SA/NV developed an incentive plan for its managers with the intention of motivating them to reach US$100 billion revenue between
2020 and 2022. The plan is called 2020 Dream Incentive Plan30. According to it, the company
will award a maximum of 6,000,000 stock options to eligible employees and each option will give the right to purchase one ordinary share of the company in Belgium (Euronext: ABI).
The eligible employees are 65 senior managers, excluding members from the Executive
Board of Management (EBM), to help them work towards the internal stretch target and
future growth. Each employee has received an offer letter from the group indicating the number of call options offered and their exercise price.
The Terms and Conditions of the agreement state that the options can only be exercised if the performance test is met. The performance test in this case is net revenue reported equals, at least, to US$100 billion.
Based on the information provided in the introduction and the description of the 2020 Dream Incentive Plan, some questions can be raised:
1. In which geographic segments would make more sense to focus investments?
2. Which is the best way for the company to expand its business? Should AB InBev SA/NV choose organic or inorganic growth? If organic, how? If inorganic, which would be interesting companies to acquire?
3. Which would be the best financing strategies for the investments?
4. Would a listing in another Stock Exchange make sense? If yes, in which one?
In order to address the issues presented, it is relevant to mention that AB InBev SA/NV considers its optimal capital structure as a net financial debt/EBITDA ratio of approximately 2x. The brewery also disclosed its capital allocation objectives in the first quarter 2017 results presentation, and they are, in order of priority:
1. Organic growth: investing in the organic growth our business.
2. Deleveraging: deleveraging to around the 2x level remains our commitment.
3. Selective M&A: non-organic, external growth is a core competency and we will continue to consider suitable opportunities when and if they arise, subject to our strict financial discipline and deleveraging commitment.
4. Return of cash to shareholders: our goal is for dividends to be a growing flow over time in line with the non-cyclical nature of our business. Given the importance of deleveraging, dividend growth is expected to be modest.
24
2. Teaching Note
2.1. Synopsis
The case study focuses on the application of theory related to financial and strategic aspects of AB InBev SA/NV, the leading brewery in the world. The following topics will be approached:
Expansion (geographical markets analysis).
Growth strategies (organic and inorganic growth). Financing options (internal, debt and equity financing). Cross-listing.
Methodologies learned during the Master of Science program of Management Engineering of Politecnico di Milano will be used to solve the proposed questions.
2.2. Objectives
The objectives of this case study are:
Understanding financial concepts of a listed company.
Using information provided by documents officially disclosed and other sources. Applying learned theories and methodologies
Discussing the open issues proposed. Developing recommendations to the firm. Concluding based on the analysis developed.
2.3. Target Audience
Practice is not only interesting, but it also helps students to comprehend deeply what was taught in class. Therefore, the target audience of this case study are students of Master of Science in Management Engineering, especially the ones following the finance stream, and eventually doctorate students who wish to review some topics or practice.
25
2.4. Discussion
2.4.1. In which geographical segments would make more sense to focus
investments?
As seen previously, the largest portion of the company’s revenue comes from North America, followed by Latin America North, Asia Pacific, EMEA, Latin America West and Latin America North. In order to choose one or more geographical segments to focus, it is
interesting to understand the beer market in each one of them.
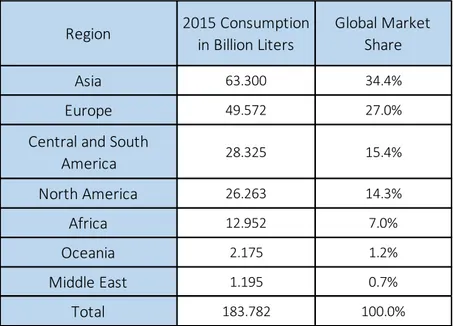
The following table shows the distribution of volume of beer around the globe in 2015, together with the global market share in decreasing order, according to Kirin Holding Company:
Table 6 - Distribution of 2015 Beer Volume per Region31
As the table informs, the global total volume was 183.78 billion liters. According to the data disclosed in the 2015 full reports, AB InBev SA/NV has produced 22.49% of it and The Heineken Company, the second largest, has produced around 11%.
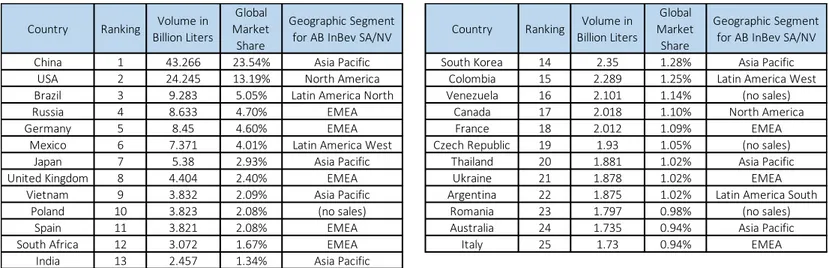
The table below, with data from the same source, shows 2015 volumes of the top 25 beer consuming countries in the world, together with the percentage of global market share. The last column indicates the geographic segment of the country according to AB InBev SA/NV’s division.
31 Kirin University Beer Consumption 2015 Report (http://www.kirinholdings.co.jp/english/news/2016/1221_01.html)
Region 2015 Consumption in Billion Liters Global Market Share Asia 63.300 34.4% Europe 49.572 27.0%
Central and South
America 28.325 15.4% North America 26.263 14.3% Africa 12.952 7.0% Oceania 2.175 1.2% Middle East 1.195 0.7% Total 183.782 100.0%
26 Table 7 – Beer Volumes of the Top 25 Consuming Countries in 2015
Some points from the tables catch attention: firstly, the top 25 countries consumed 82.51% of the total consumed in 2015; and secondly, the largest brewery in the world has no sales in 4 of them: Poland, Venezuela, Romania and Czech Republic. The last one is the
country with highest volume per-capita in the world, for the 23rd consecutive year. Poland is
currently the 6th.
The next set of data indicates the total beer volume in each of AB InBev SA/NV segments and how the group is performing in each one of them. Information from tables 6 and 7 as well as the group’s full 2016 annual report were used. The rows on the right side show the maximum increase that would be possible if the Brazilian-Belgium brewery, in an ideal scenario, could capture all the existing demand from its competitors, based on the revenue the company had every 100 liters in each segment in 2016.
Table 8 - Beer Market, AB InBev SA/NV Performance and Potential Increases per Segment
*total volume based on table 6 and distributing Central and South America according to the countries in each segment and data from https://en.wikipedia.org/wiki/List_of_countries_by_beer_consumption_per_capita#noteb
**market share calculated using volumes produced by the company in 2016 considering only beer (the discount of not-beer beverages was done using the proportion of the whole company to all the segments)
***potential maximum increase considers that the overall consumption of beer is stable for the future years, as Kirin Holding Company Reports indicates
****2016 revenue every 100 liters was calculated considering all the beverages
Country Ranking Volume in Billion Liters
Global Market Share
Geographic Segment
for AB InBev SA/NV Country Ranking
Volume in Billion Liters Global Market Share Geographic Segment for AB InBev SA/NV China 1 43.266 23.54% Asia Pacific South Korea 14 2.35 1.28% Asia Pacific
USA 2 24.245 13.19% North America Colombia 15 2.289 1.25% Latin America West Brazil 3 9.283 5.05% Latin America North Venezuela 16 2.101 1.14% (no sales) Russia 4 8.633 4.70% EMEA Canada 17 2.018 1.10% North America Germany 5 8.45 4.60% EMEA France 18 2.012 1.09% EMEA
Mexico 6 7.371 4.01% Latin America West Czech Republic 19 1.93 1.05% (no sales) Japan 7 5.38 2.93% Asia Pacific Thailand 20 1.881 1.02% Asia Pacific United Kingdom 8 4.404 2.40% EMEA Ukraine 21 1.878 1.02% EMEA
Vietnam 9 3.832 2.09% Asia Pacific Argentina 22 1.875 1.02% Latin America South Poland 10 3.823 2.08% (no sales) Romania 23 1.797 0.98% (no sales)
Spain 11 3.821 2.08% EMEA Australia 24 1.735 0.94% Asia Pacific South Africa 12 3.072 1.67% EMEA Italy 25 1.73 0.94% EMEA
India 13 2.457 1.34% Asia Pacific
Total Volume per Segment* (2015) (billion liters) Ab InBev SA/NV Market Share per Segment** Potential Maximum Increase in Volume per Segment*** (billion liters) AB InBev SA/NV Revenue every 100 liters**** (US$) Potential Maximum Increase in Revenue per Segment (US$ billion) North America 26.26 38.60% 16.12 134.30 21.65 Latin America North 13.46 76.03% 3.23 71.70 2.31
Asia Pacific 65.48 12.22% 57.47 65.82 37.83 EMEA 63.72 10.26% 57.18 79.76 45.61 Latin America West 11.33 48.69% 5.81 81.55 4.74 Latin America South 3.53 79.03% 0.74 88.62 0.66 TOTAL 183.78 - 140.56 - 112.81
27 The following chart illustrates the current situation:
Exhibit 10 - Total Volume and AB InBev SA/NV Share per Segment
Analyzing both table 8 (specially the row on the right) and exhibit 10, it is reasonable to affirm that the brewery’s challenge is complicated. If it is assumed that the beer market as a whole is not growing, the maximum potential increase in revenue the company may have is US$112.81 billion. This means that, based on the combined expected revenue for 2017, US$55.5 billion, the company still has to capture US$44.5 billion from its competitors, increasing by 80% its income. Considering the most feasible case, in which the company reaches the goal by 2022, it would mean a CAGR of 12.50%.
The three Latin American segments do not present good perspectives, once in the best case scenario the group would be able to raise it’s revenue only by US$7.71 billion.
Considering also the market shares on those segments one can assess that it would be really difficult to increase participation in Latin America South (currently 79.03%) and Latin America North (currently 76.03%), once the market share the group possess is already high and trying to increase it further could generate a series of reactions from market authorities. Other point that would make improvement in these segments hard is the fact that competing breweries, who control the rest of the market, probably have loyal customers and its owners may not want to sell their businesses. Thinking about Latin America West, where the market share is 48.69%, the possibilities are better: the segment has two top 25 consuming countries (Mexico and Colombia) where AB InBev already operates. Furthermore, the brewery has no
sales in Venezuela, the 16th largest beer consumer, probably due to the country’s risk caused
by general crisis of past years. However, even if AB InBev could capture the whole demand of the region, the increase in sales would be US$4.74 billion.
0.00 10.00 20.00 30.00 40.00 50.00 60.00 70.00
North America Latin America North
Asia Pacific EMEA Latin America
West
Latin America South
Total Volume and AB InBev Share per Segment
Total AB InBev SA/NV
Billion Liters
38.60% 76.03% 12.22% 10.26% 48.69%
28 Concluding, it would not make sense to focus on any of the three Latin American
segments for now. Maybe, in longer-term, especially if Venezuela recovers, the company could try to raise its participation in Latin America West.
Going in deep in the North America segment, where AB InBev SA/NV has a market share of 38.60%, it is possible to estimate that in the USA, the Brazilian-Belgium conglomerate has a
market share of around 42%, (followed by MolsonCoors with approximately 25%32) and in
Canada, a market share close to 31% (followed closely by MolsonCoors with approximately
27%33). Once again, even though the market size is large (with almost US$22 billion to
capture), the difficulty to beat competitors and market regulations might be a huge challenge for AB InBev SA/NV. Remembering the issues the company faced in the SABMiller acquisition by the end of 2016 having to sell Miller to MolsonCoors, it is clear that depending on the market regulators the perspectives for an acquisition and a large improvement are not good. The only option in North America would therefore be organic growth: competing with the other breweries could generate some new income. However, even raising market share by 10%, which for sure would be a tremendous challenge, the extra revenue would be only US$3.52 billion.
For those reasons, it seems that investing in growth in the North America segment is not an attractive idea. As a whole, the American continent does not show good perspectives, except for Latin America West, in the longer-run.
Both EMEA and Asia Pacific are segments where the presence of AB InBev SA/NV is not strong, in fact, they are by far the lowest market shares the company has, with respectively 10.26% and 12.22%. Another appealing fact is that, also by far, those are the two largest markets, actually, they represent together more the 70% of the world’s demand. The
participation of the Brazilian-Belgium brewery is more recent in Asia, Oceania and Africa and not as consolidated as it is in Latin America, North America and Europe, from where the first three breweries that merged come from: AmBev from Brazil, Anheuser-Busch from USA and Interbrew from Belgium. This means that problems with authorities regarding the free competition would be theoretically less severe if the company opts for inorganic growth. On the other hand, cultural, post-merger, corporate governance and legal mismatches are more likely to arise due to large amount of differences between those markets and the ones where the brewery is more used to sell its products.
In terms of the operational challenge, it is believed that AB InBev SA/NV is capable of being economically competitive even in markets where it does not have tradition, as it has proven many times throughout its expansionary background. For that reasons, it looks like both organic and inorganic growth are viable in EMEA and Asia Pacific.
Asia Pacific has seven representatives in the top 25 consuming countries, consuming 35.63% of the global volume, while EMEA has eight and consumes 34.67%. Furthermore, China is the global leader (with almost the double of the volume consumed by USA) and
32 Statista (https://www.statista.com/statistics/188723/top-domestic-beer-brands-in-the-united-states/) 33 Statista (https://www.statista.com/statistics/339828/market-share-of-the-canadian-brewing-industry/)
29 among the 25 countries in the ranking, there are three where AB InBev SA/NV does not operate that could be added to the EMEA segment: Poland, Czech Republic and Romania.
It is true that the competition in both segments is tough, The Heineken Company and Carlsberg Group have strong presence in Europe but the combination with SABMiller can be a game-changer in the EMEA region in favor of the world leader, especially due to Africa. The Asia Pacific market also has large companies, and the major players are: Asahi Group, Beijing Yanjing Brewery, Carlsberg Group, United Breweries Group, SABMiller (already a part of AB InBev SA/NV group), Tsingtao Group, China Resource Snow Breweries and Kirin Holdings.
Even though the world consumption as a whole is expected to be stable, the perspectives for Asia Pacific are attractive: the market size is expected to growth with a CAGR of 7.3%
between 2014 and 2020, reaching US$202 billion34 annually by the end of the period. For this
reason, the major players in the global brewing industry have their sights firmly set on the area. They are motivated by the easiness of gaining market share when the market is growing, once there is no need to capture a customer that already has an established relationship with another brand.
It is important to highlight that even a small percentage increase in large markets like EMEA and Asia Pacific can represent a large amount in terms of revenue. For instance, capturing 20% of the Potential Maximum Increase in both markets would create almost US$17 billion in sales.
Other information from table 8 that seems promising is the fact that Asia Pacific and
EMEA are the last and the 4th in terms of revenue generated every 100 liters of beer sold.
Following the premiumnization35 trend that happens worldwide, it might be profitable to
make marketing efforts with the aim of raising prices. Another initiative could be a change in brand mix, increasing sales of more expensive beers.
Finally, it is possible to conclude that AB InBev SA/NV should focus its investments in Asia Pacific and EMEA for a series of reasons: these are the two largest markets and where the company has lowest market share; both organic and inorganic growth are possible; the group has proven to be able to deal with new different landscapes; SABMiller combination can be a game-changer in these segments; Asia Pacific market is growing in a fast pace; small
percentage volume increase means large increase in income; it seems feasible to raise prices.
34 The Drinks Business (https://www.thedrinksbusiness.com/2015/07/291142/)
35 Forbes
30
2.4.2. Which is the best way for the company to expand its business? Should
AB InBev SA/NV choose organic or inorganic growth? If organic, how? If
inorganic, which would be interesting companies to acquire?
According to the analysis developed in the previous section, it was possible to conclude that EMEA and Asia Pacific are the most appealing market segments to focus investments, but which is the best way to expand in each one?
The EMEA segment is composed by Europe, Middle East and Africa.
The European beer market is very competitive and AB InBev SA/NV has a good presence in Western and Central Europe, Russia and Ukraine, but not in the Eastern or Nordic
countries. Actually, in order to fulfill antitrust requirements, AB InBev SA/NV sold SABMiller’s brands that are well recognized in the east (such as Pilsner Urquell, Kozel and Tyskie) and even some important brands in the west (such as Peroni and Grolsch) to the Japanese Asahi Group. The Belgium-Brazilian group has no presence in crucial countries in the east market such as Czech Republic, Poland, Hungary, Slovakia, Croatia and Romania. However, the
presence is satisfactory in Russia and Ukraine and as show on table 7, they are the 4th and
21st largest markets in the world.
According to appendix 7, it is clear that Carlsberg Group and The Heineken Company focus much more effort on the east and in the Nordics, making it difficult for the world leader to penetrate without an acquisition. However, as has already happened, market authorities do not seem to let AB InBev SA/NV inorganically expand its business in this area. The same restrictions in terms of takeovers apply to the west, once the brewery had to sell brands in the region to close the SABMiller deal. Hence, in the European market as a whole, it looks that the best option is organic growth in Western and Central Europe, Russia and Ukraine. Fortunately, expanding existing sales is the priority of the group according to the capital allocation objectives disclosed.
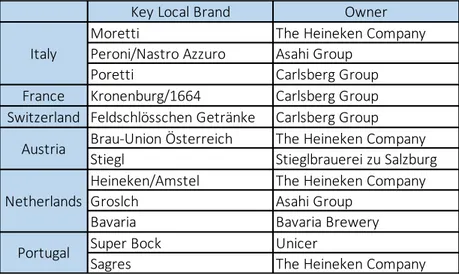
AB InBev SA/NV does not own national brands in many countries in the west and center of the continent, which means that in those countries the revenues flows from the sales of brands imported from countries in the European Union. Belgium, Germany, UK and Spain are the places where the conglomerate owns well-recognized brands, and in the other hand, Italy, France, Switzerland, Austria, Netherlands and Portugal are countries with no important national brands, as seen on the table below, with the relevant brands in terms of volume:
31 Table 9 - Relevant Local Brands in Western and Center Europe
The imported beer in those countries are always more expensive, making competition with local brans a challenge. Once EU has generally no taxes between member states,
lowering profit margins in order to compete in price with national brands may be feasible and interesting, especially because the imported beers from Germany and Belgium (countries with tremendous tradition and quality in beer production and where AB InBev SA/NV owns a series of worldwide known brands) are usually already seen as premium. As the goal was developed in terms of revenue and not necessarily profit, reducing the margin for some years should make sense to boost organic growth and create more brand recognition. Of course, on the longer-term, after volume expansion and brand building, the company could raise margins again.
In Russia, AB InBev SA/NV has a market share of around 17%36, in the second position
after Carlsberg (39%) and right ahead of Heineken (15%). The Belgium-based group has its revenues flowing from national brands and from imported global brands such as Stella Artois
and Budweiser. The Ukrainian market is led by AB InBev SA/NV, with 35%37 volume market
share. The company own three brands including the market leader, Chernigivske. The most relevant competitor is the Carlsberg Group, with 29%.
With the intention of growing revenues, the company could focus on the more expensive imported brands in Russia, once the difficult economic environment and pressure from smaller local breweries create a scenario in which is not rational to compete in price.
Moreover, the beer market is expected to decline with a CAGR of -2%38 until 2020 due to
economic recession. In situations like this, usually the volume of high-end beer is the one that varies the least, once high-income citizens are the less impacted ones.
In Ukraine, there will be the halt of the importation of Russian beer, meaningful in terms of volume, because of the introduction of a trade embargo. This means that local brands will have a chance to fill this demand. AB InBev SA/NV, as the market leader, is in the best
36 Global Agricultural Information Network
(https://gain.fas.usda.gov/Recent%20GAIN%20Publications/Russian%20Beer%20Market%20Update_Moscow%20ATO_Russian%20Federati on_2-19-2016.pdf)
37 Euromonitor (http://www.euromonitor.com/beer-in-ukraine/report) 38 Euromonitor (http://www.euromonitor.com/beer-in-russia/report)
Key Local Brand Owner
Moretti The Heineken Company
Peroni/Nastro Azzuro Asahi Group
Poretti Carlsberg Group
France Kronenburg/1664 Carlsberg Group
Switzerland Feldschlösschen Getränke Carlsberg Group Brau-Union Österreich The Heineken Company
Stiegl Stieglbrauerei zu Salzburg
Heineken/Amstel The Heineken Company
Groslch Asahi Group
Bavaria Bavaria Brewery
Super Bock Unicer
Sagres The Heineken Company
Italy
Austria
Netherlands
32 position to seize this opportunity: focusing strategy in marketing efforts and low prices could improve sales and raise market share.
The representation in Middle East is given by Anadolu Efes, a Turkish associate company responsible for production and commercialization of Efes Pilsen, the market leader in the
country with 63%39 market share. The company is 24% owned by AB InBev SA/NV.
Nevertheless, an expansion in the Middle East seems unlikely due to market restrictions and the Islamism, predominant ideology in the area that considers alcohol consumption unlawful. Additionally, the minority stake the Belgium-based firm owns in Anadolu Efes does not grant a commanding position, which means the decision-making is mostly done by other
shareholders.
As mentioned before, the acquisition of the SABMiller group has created great opportunities for the world leader to penetrate the African market. Currently, AB InBev SA/NV has participations in breweries in nine countries in Africa: Botswana, Ghana,
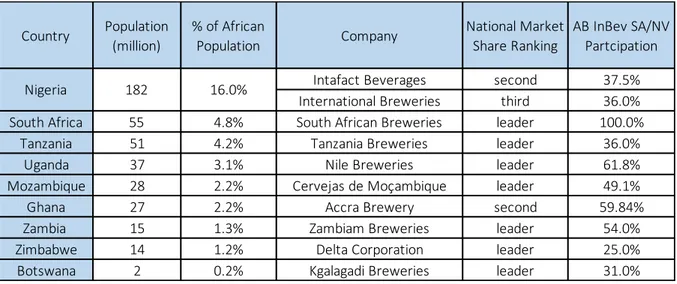
Mozambique, Nigeria, South Africa, Tanzania, Uganda, Zambia and Zimbabwe. The national market share position and the participation of Brazilian-Belgium group are shown on the table below:
Table 10 - Participation and Market Share Ranking of African Breweries
Africa is the most promising of the emerging markets, once it is projected that by 2025,
one-fifth of the world’s population will be living in the continent40. Furthermore, over half of
the expected growth worldwide between 2017 and 2050 is likely to occur in Africa. Nigeria, for instance, is expected to become the world’s third largest population by 2050 according to
the United Nations41. Considering also the highest urbanization and GDP growth rates, the
scenario of this region seems quite attractive.
An interesting African trend is the related to the craft beer market: as the middle class grows, the microbrew market is also predicted to flourish. Craft beer is expected by
39 Euromonitor (http://www.euromonitor.com/beer-in-turkey/report) 40 Borgen Maganize (http://www.borgenmagazine.com/african-beer-market/)
41 CNN (http://edition.cnn.com/2017/06/25/africa/africa-population-growth-un/index.html) Country Population (million) % of African Population Company National Market Share Ranking AB InBev SA/NV Partcipation
Intafact Beverages second 37.5%
International Breweries third 36.0%
South Africa 55 4.8% South African Breweries leader 100.0%
Tanzania 51 4.2% Tanzania Breweries leader 36.0%
Uganda 37 3.1% Nile Breweries leader 61.8%
Mozambique 28 2.2% Cervejas de Moçambique leader 49.1%
Ghana 27 2.2% Accra Brewery second 59.84%
Zambia 15 1.3% Zambiam Breweries leader 54.0%
Zimbabwe 14 1.2% Delta Corporation leader 25.0%
Botswana 2 0.2% Kgalagadi Breweries leader 31.0%
33 specialists to appear in large urban centers, particularly the ones with intense business and tourism activities42.
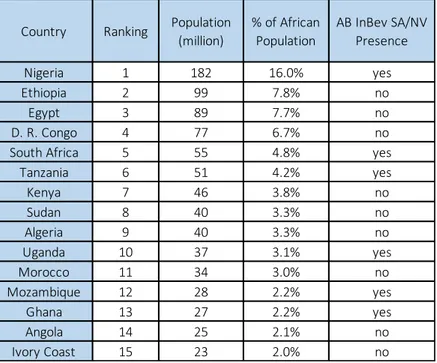
The list of the top 15 African countries by population is also a relevant data in order to appraise what are the most interesting moves for the world leader in the African continent:
Table 11 - Top 15 African Countries by Population43
Based on the information provided, is possible to draw some suggestions regarding the African market.
On the countries where AB InBev SA/NV is already present, organic growth focusing on marketing efforts to expand consumer base or to create new products is recommended, particularly in Nigeria, South Africa, Tanzania, Uganda, Mozambique and Ghana, due to the high population (and consequently higher potential of growth in terms of volume) and the solid presence of the group. It is important to stress that one of the two countries where the Belgium-based company does not own participation of the market share leader is Nigeria, the largest market. The Heineken Company owns more than one third of the absolute leader,
Nigerian Breweries, with about 65% of volume share44. Therefore, the perspectives in Nigeria
are not the best.
Out of the top 15 most populated African countries, AB InBev is present only in 6, which means there is a lot of room to growth in the continent. Once the company’s first priority in the capital allocation objectives is the organic growth, it makes more sense to avoid large acquisitions at the moment. Egypt, Sudan, Algeria and Morocco are countries where the Islamism is the dominant religion, being practiced by more than 90% of the population in each country. As mentioned previously, alcohol consumption is considered unlawful by this
42 Beverage Daily (http://www.beveragedaily.com/Markets/Africa-The-fastest-growing-beer-market) 43 Wikipedia (https://en.wikipedia.org/wiki/List_of_African_countries_by_population)
44 Euromonitor (http://www.euromonitor.com/beer-in-nigeria/report) Country Ranking Population
(million) % of African Population AB InBev SA/NV Presence Nigeria 1 182 16.0% yes Ethiopia 2 99 7.8% no Egypt 3 89 7.7% no D. R. Congo 4 77 6.7% no
South Africa 5 55 4.8% yes
Tanzania 6 51 4.2% yes Kenya 7 46 3.8% no Sudan 8 40 3.3% no Algeria 9 40 3.3% no Uganda 10 37 3.1% yes Morocco 11 34 3.0% no Mozambique 12 28 2.2% yes Ghana 13 27 2.2% yes Angola 14 25 2.1% no Ivory Coast 15 23 2.0% no
34 ideology, which means that AB InBev SA/NV should not focus on such countries, which
summed up, represent roughly 19% of African population.
Ethiopia, Democratic Republic of Congo, Kenya and Angola represent more than 20% of the population and do not have Islamism as main religion. Once the potential market is meaningful, putting effort in trying to expand the brands present in other African countries sounds attractive. All these four markets are relatively close to Uganda, Tanzania, Zambia, Zimbabwe, Mozambique, South Africa and Botswana, countries where the brewery already possesses a good presence. The same expansion logic applies to the Ivory Coast, but with brands being imported from other countries: Ghana and Nigeria. As organic growth in Nigeria is unlikely due to Heineken clear dominance, maybe an expansion to other country can bring positive results in terms of sales.
A final suggestion to Africa would be to analyze small craft breweries and acquire them if it they are a suitable opportunity, in order to seize the tendency of this kind of product. This applies particularly to countries with large business centers such as South Africa, Kenya and Nigeria.
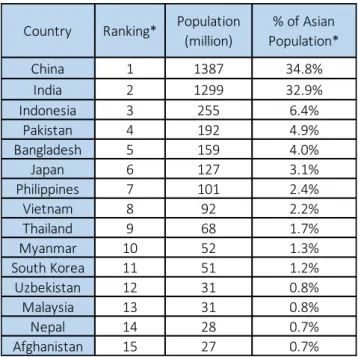
Regarding the Asia Pacific segment, it is key to restate that this market is expected to growth with a CAGR of 7.3% between 2014 and 2020 and that, out of the six segments used by AB InBev SA/NV, it is already the largest. Other key fact is that the segment has the lowest revenue/liter ratio.
On the table below, there are the top 15 Asian countries by population:
Table 12 - Top 15 Asian Countries by Population45
*Ranking and % of Asian Population without considering Russia and Middle East countries
45 Wikipedia (https://en.wikipedia.org/wiki/List_of_Asian_countries_by_population) Country Ranking* Population (million) % of Asian Population* China 1 1387 34.8% India 2 1299 32.9% Indonesia 3 255 6.4% Pakistan 4 192 4.9% Bangladesh 5 159 4.0% Japan 6 127 3.1% Philippines 7 101 2.4% Vietnam 8 92 2.2% Thailand 9 68 1.7% Myanmar 10 52 1.3% South Korea 11 51 1.2% Uzbekistan 12 31 0.8% Malaysia 13 31 0.8% Nepal 14 28 0.7% Afghanistan 15 27 0.7%