Università degli Studi di Ferrara
DOTTORATO DI RICERCA IN
"Farmacologia E Oncologia Molecolare"
CICLO XXVI
COORDINATORE Prof. Antonio Cuneo
Studies on Type- 1 Insulin Like Growth Factor and on Reduced Folate in Cancer
Settore Scientifico Disciplinare Bio/14
Dottorando Tutore
Dott. Ali Edris Prof. Michele Rubini
_______________________________ __________________________
(firma) (firma)
iii
Part 1:
Phosphorylation of IGF1R as predictive biomarker for response to therapy in colorectal cancer.
Abstract( English)
Insulin-like growth factor-1 receptor (IGF-1R) plays a critical role in regulating cancer cell proliferation, survival and metastasis in the transformed cell. Additionally, chemo-resistance acquisition, a cumbersome problem in advanced colorectal cancer (ACRC) patients. The mechanism of resistance acquisition is found to be attributed to a p-IGF-1R membrane-to-nuclear internalization that cannot be overcome with existing IGF-1R inhibitors. In the present study, intriguingly 48% of cases were positive for p-IGF-1R. p-IGF-1R positive cases had different patterns of staining: peri- nuclear detected in 76%, 11% with nuclear localization and only 13% membrane-apical staining. Furthermore, Tumours with positive p-IGF-1R expression, had higher MMP7 co-expression (59%) compared with negative cases 13%. These findings not only indicate that, IGF-1R could be used as biomarker, but also could allow selection of ACRC patients who can benefit from anti-IGF-1R treatment.
Riassunto
L’Insulin-like factor-1 di crecità recettore (IGF-1R) gioca un ruolo critico nella regolazione della proliferazione delle cellule tumorali, la sopravvivenza e metastasi nella cellula trasformata. Inoltre, l'acquisizione di chemio-resistenza, un problema ingombrante nel carcinoma colorettale avanzato (ACRC) pazienti di cancaro. Il meccanismo di acquisizione resistenza è risultato essere attribuito ad una interiorizzazione membrana-a-nucleare p-1R che non possa essere superato con inibitori IGF-1R esistenti. Nel presente studio, intrigante 48% dei casi erano positivi per IGF-IGF-1R. I casi positivi p-IGF-1R avevano diversi modelli di colorazione: peri-nucleare rilevata nel 76%, 11% con la localizzazione nucleare e solo il 13% membrana apicale colorati. Inoltre, Tumori con l'espressione positiva p-IGF-1R, ha avuto maggiore MMP7 co-espressione (59%) rispetto ai casi negativi 13%. Questi risultati indicano non solo che, IGF-1R potrebbe essere utilizzato come biomarker, ma potrebbe anche consentire la selezione dei pazienti ACRC che possono trarre beneficio dal trattamento anti-IGF-1R.
iv
Abstract
Anti-folate drugs are widely used in cancer therapies, and folate deficiency is considered to contribute to tumor genesis, but still few is known on the actual role of folates in cell survival and proliferation.
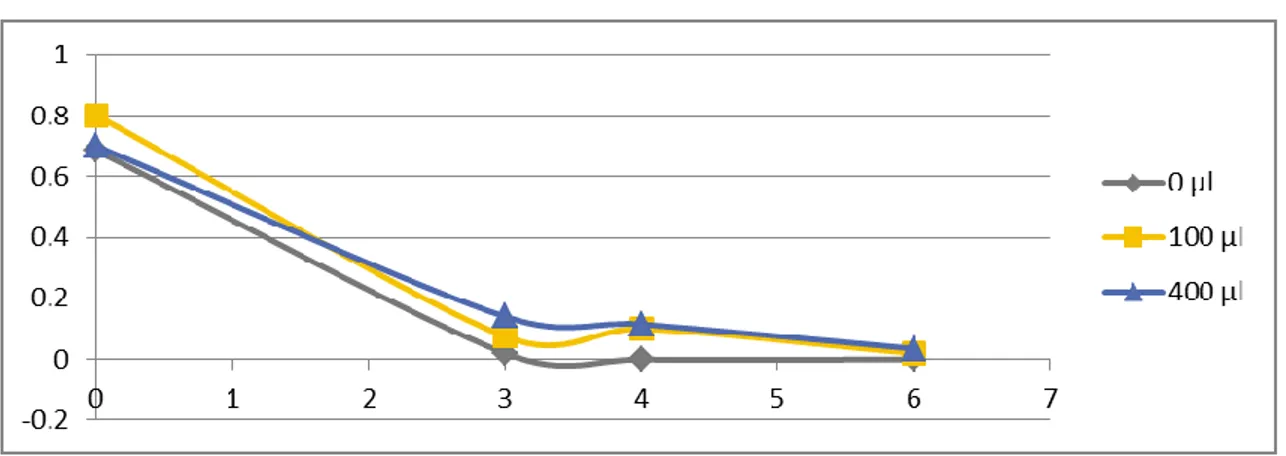
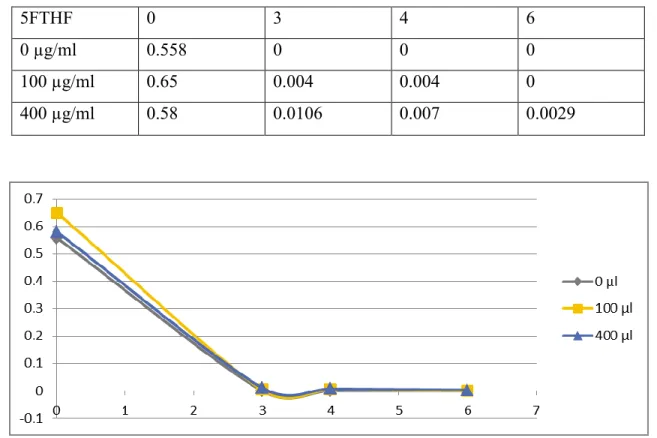
We used a human pro-myelocytic cell line (HL-60) as a model to assess the effect of folinic acid (5FTHF) on survival and proliferation in stringent conditions (deprivation of growth factors or exposure to UV light).
5FTHF has shown to increase transient proliferation in serum-free medium, and delay apoptosis in a dose-dependent fashion. Conversely, 5FTHF has resulted in reducing cell proliferation of cells cultured in medium added with growth factors. A similar phenomenon has been observed in PHA-activated lymphocytes, suggesting a possible effect of 5FTHF in increasing autocrine-driven proliferation. 5FTHF turned out to have no effect on apoptosis induced by growth factors deprivation or by exposure to UV-B or UV-C.
These results suggest a role of 5FTHF in modulating cell proliferation, and this could have an impact in therapies that include administration at high doses.
v
Riassunto
I farmaci “anti – folat” sono ampiamente usati nelle terapie del cancro e la carenza di “folate” è considerata contribuire alla genesi tumorale , ma ancora pochi sanno il ruolo effettivo di “folate” nella sopravvivenza e la proliferazione cellulare .
Abbiamo utilizzato una linea cellulare pro - mieloide umano ( HL - 60) come modello per valutare l'effetto di acido folico ( 5FTHF ) sulla sopravvivenza e la proliferazione in condizioni severe ( deprivazione di fattori di crescita o di esposizione a luce UV ) .
5FTHF ha dimostrato di aumentare la proliferazione transitoria in terreno privo di siero e ritardare l'apoptosi in modo dose -dipendente . Viceversa , 5FTHF ha portato a ridurre la proliferazione cellulare di cellule coltivate in terreno aggiunti con fattori di crescita . Un fenomeno simile è stato osservato nei linfociti PHA - attivati , suggerendo un possibile effetto di 5FTHF ascendente proliferazione autocrino - driven. 5FTHF no ha effetto sulla apoptosi indotta da fattori di crescita deprivazione o da esposizione a UV - B o UV - C .
Questi risultati suggeriscono un ruolo di 5FTHF nel modulare la proliferazione cellulare e questo potrebbe avere un impatto nelle terapie che comprendono la somministrazione a dosi elevate .
vi
List of figure:
Figure 1.1 shows the structure of IGF- 1 7
Figure 1.2 shows the Sumoylation mechanism by E1-E2 and E1-E2-E3 enzymes 8 Figure 3.1 shows the sequence of antibody production 12 Figure-4.1 colorectal cancer cell line (LoVO and HT-29), chronically treated with oxaliplatin
had developed drug resistance
14
Figure 4.2. Activation of IGF-1R/PI3K-AKT pathway, in cells chronically treated with oxaliplatin, is due to increase of MMP7 and IGFBP degradation
17
Figure 4.3 The IGF-1R inhibitor AMG479 combined with sorafenib prevents IRS-1-AKT signaling but not apoptosis in HT-OXAR3 OXL cells lines
18
Figure 4.4 IGF-1R, p-IGF-1R (p-1316) and caveolin-1 are located differently in HT-29 and HTOXAR3 cell lines
20
Figure 4.5: HT-29 and HTOXAR3 cell lines were treated with the IGF-1R monoclonal antibody (AMG479) and an IGF-1R tyrosine kinase inhibitor (AEW541)
22
Figure 1.1 chemical structure of folic acid 30
Figure 3.1 shows UVC induced apoptosis (cell proliferation) using haemocytometer 45 Figure 3.2 shows UVC induced apoptosis (cell survival) using haemocytometer 46 Figure 3.3 shows UVC untreated cells and folinic acid doses( cell proliferation) 48 Figure 3.4 UVC untreated cells survival using trypan blue dye exclusion 49 Figure 3.5 shows UVC treated cells with 0.5 minute cell proliferation 50 Figure 3.6 Cells treated with UVC for 0.5 minute (cell survival) using trypan blue exclusion 51
Figure 3.7 shows Cells treated with UVC for 10 minutes( cell proliferation) 52
Figure 3.8 illustrates UVC untreated cell (cell proliferation) using haemocytometer 53 Figure 3.9 shows % UVC untreated cell (cell survival) using trypan blue exclusion 54 Figure 3.10 demonstrates Cells treated with 0.1 minute UVC cell proliferation using
haemocytometer
54 Figure 3.11 shows Cells treated with 0.1 minute UVC (cell survival) using trypan blue
exclusion
55 Figure 3.12 UVC treated cells for 0.5 minutes cell count using haemocytometer 56 Figure 3.13 UVC treated cells for 0.5 minutes cell viability using trypan blue dye exclusion 56 Figure 3.14 Effects of post-treatment of folinic acid and UVC on cell proliferation 57 Figure 3.15 Effects of post-treatment of folinic acid and UVC on cell survival 58 Figure 3.16 Effect of pre-treatment of folinic acid and UVC on cell proliferation 59
vii
Figure 3.17 Effects of pre-treatment of folinic acid and UVC on cell viability 59 Figure 3.18 Effects of folinic acid on proliferation of untreated cells 61 Figure 3.19 Effects of folinic acid on cell survival of untreated cells 61 Figure 3.20 Effect of UVB and folinic acid on cell proliferation with 1 minute UVB exposure 62 Figure 3.21 Effects of UVB and folinic acid on cell survival with 1 minute UVB exposure 63 Figure 3.22 Effects of UVB and folinic acid on cell proliferation with 10 minute UVB
exposure
63 Figure 3.23 Effects of UVB and folinic acid on cell survival with 10 minutes UVB exposure 64 Figure 3.24 cell proliferation using haemocytometer 65 Figure 3.25 Cell survival using trypan blue exclusion 66 Figure 3.26 cell proliferation using haemocytometer 67 Figure 3.27 Cell survival using trypan blue exclusion: 68 Figure 3.28 UVB dose exposure HL-60 supplemented with 5FTHF (cell count) using
haemocytometer
70 Figure 3.29 UVB dose exposure HL-60 supplemented with 5FTHF (cell survival) using Trypan blue dye exclusion
71 Figure 3.30 shows 5FTHF doses on UVB treated HL-60 cell (cell proliferation) by
Haemocytometer:
81 Figure 3.31 shows 5FTHF doses on UVB treated HL-60 cell (cell survival) by (% of Trypan
blue dye exclusion):
82 Figure 3.32 shows 5FTHF doses on UVB-treated HL-60 cells(cell proliferation) using
haemocytometer
93 Figure 3.33 shows 5FTHF doses on UVB-treated HL-60 cells(cell proliferation) 94 Figure 3.34 5FTHF doses -1 -12 doses kinetics (cell proliferation) 104 Figure 3.35 5FTHF doses -1 -12 doses kinetics (cell survival) 105
Figure 3.36 shows SFM 5FTHF 10x5 vs 50 9-15-days(cell proliferation) 123 Figure 3.37 shows Table shows s SFM 5FTHF 10x5 vs 50 9-15-days (cell
survival)
124 Figure 3.38 shows cells proliferation in absence of serum 126 Figure 3.39 shows cell survival in absence of serum 127 Figure 3.40 shows Cell proliferation in presence of 1% serum 128 Figure 3.41 shows cell survival in presence of 1% serum 129 Figure 3.42 shows Table shows - SFM- 5FTHF maximal effective dose ( cell
proliferation)
130 Figure 3.43 shows SFM- 5FTHF maximal effective dose (cell survival) using
trypan blue exclusion
131 Figure 3.45 shows table shows effect of 5FTHF supplemental on HL-60 (cell 132
viii
proliferation)
Figure 3.46 shows table shows effect of 5FTHF supplemental on HL-60 (cell proliferation)
133 Figure 3.47 illustrate Effect of 5FTHF supplemental on HL-60 (cell survival)
using trypan blue exclusion:
133 Figure 3.48 illustrate Effect of 5FTHF supplemental on HL-60 (cell survival)
using trypan blue exclusion
134 Figure 3.49 describes Effect of 5FTHF supplemental on cell proliferation
using MCF-7 cell
135 Figure 3.50 shows c-Myc inhibition and rescue with 5FTHF( cell
proliferation) using haemocytometer
136 Figure 3.51 shows Table shows c-myc inhibition and rescue with 5FTHF Cell
survival) using trypan blue dye exclusion:
137 Figure 3.52 describes the mitotic activity 141 Figure 3.53 shows mitotic activity of cells that has been released from the
block after 3 hours
142 Figure 3.54 shows mitotic activity of cells that has been released from the
block after 5 hours
143
List of tables:
Table 1.1 one- carbon substitution of tetrahydrofolates 31 Table 3.1 shows UVC induced apoptosis (cell proliferation) using haemocytometer
45 Table 3.2 shows UVC induced apoptosis (cell survival) using haemocytometer:
46 Table 3.3 shows UVC untreated cells and folinic acid doses( cell proliferation)
47 Table 3.4 UVC untreated cells survival using trypan blue dye exclusion: 48 Table 3.5 shows UVC treated cells with 0.5 minute cell proliferation 49 Table 3.6 demonstrates Cells treated with UVC for 0.5 minute (cell survival) using trypan blue exclusion:
50 Table 3.7 illustrates Cells treated with UVC for 10 minutes( cell 51
ix
proliferation):
Table 3.8 shows UVC untreated cell (cell proliferation) using haemocytometer:
53 Table 3.9 shows UVC untreated cell (cell survival) using trypan blue dye exclusion
53 Table 3.10 demonstrates Cells treated with 0.1 minute UVC cell proliferation using haemocytometer
54 Table 3.11 shows Cells treated with 0.1 minute UVC (cell survival) using trypan blue exclusion:
55 Table 3.12 UVC treated cells for 0.5 minutes cell count using haemocytometer:
55 Table 3.13 UVC treated cells for 0.5 minutes cell viability using trypan blue dye exclusion
56 Table 3.14 Effects of post treatment of folinic acid and UVC on cell proliferation
57 Table 3.15 Effects of post-treatment of folinic acid and UVC on cell survival 58 Table 3.16 Effect of pre-treatment of folinic acid and UVC on cell proliferation
58 Table 3.17 Effects of pretreatment of folinic acid and UVC on cell viability 59 Table 3.18 Effects of folinic acid on proliferation of untreated cells 60 Table 3.19 Effects of folinic acid on cell survival of untreated cells 61 Table 3.20 Effect of UVB and folinic acid on cell proliferation with 1 minute UVB exposure
62 Table 3.21 Effects of UVB and folinic acid on cell survival with 1 minute UVB exposure
62 Table 3.22 Effects of UVB and folinic acid on cell proliferation with 10 minute UVB exposure
63 Table 3.23 Effects of UVB and folinic acid on cell survival with 10 minutes UVB exposure
64 Table 3.24 cell proliferation using haemocytometer: 65 Table 3.25 Cell survival using trypan blue exclusion 65 Table 3.26 cell proliferation using haemocytometer 67
x
Table 3.27 Cell survival using trypan blue exclusion: 68 Table 3.28 UVB dose exposure HL-60 supplemented with 5FTHF (cell count) using haemocytometer
70 Table 3.29 UVB dose exposure HL-60 supplemented with 5FTHF (cell survival) using Trypan blue dye exclusion
71 Table 3.30 shows 5FTHF doses on UVB treated HL-60 cell (cell proliferation) by Haemocytometer:
80 Table 3.31 shows 5FTHF doses on UVB treated HL-60 cell (cell survival) by (% of Trypan blue dye exclusion):
81 Table 3.32 shows 5FTHF doses on UVB-treated HL-60 cells(cell proliferation) using haemocytometer
92 Table 3.33 shows 5FTHF doses on UVB-treated HL-60 cells(cell proliferation)
93 Table 3.34 5FTHF doses -1 -12 doses kinetics (cell proliferation) 104 Table 3.35 5FTHF doses -1 -12 doses kinetics (cell survival) 104 Table 3.36 shows SFM 5FTHF 10x5 vs 50 9-15 days(cell proliferation) 123 Table 3.37 shows s SFM 5FTHF 10x5 vs 50 9-15-days (cell survival) 124 Table 3.38 shows cells proliferation in absence of serum 126 Table 3.39 cell survival in absence of serum 127 Table 3.40 shows cell proliferation in presence of ( 1% serum) 128 Table 3.41 shows cell survival in presence of 1% serum) 128 Table 3.42 shows - SFM- 5FTHF maximal effective dose ( cell proliferation) 130 Table 3.43 shows SFM- 5FTHF - maximal effective dose (% cell survival) using trypan blue exclusion
130 Table 3.44 shows effect of 5FTHF supplemental on HL- 60 (cell proliferation) 132 Figure 3.45 illustrate Effect of 5FTHF supplemental on HL-60 (cell survival) using trypan blue exclusion
133 Table 3.46 shows effects of 5FTHF supplemental on cell proliferation using MCF-7:
134 effects 3.47 of 5FTHF supplemental on cell proliferation using MCF-7 (cell survival)
135 Table 3.48 c-Myc inhibition and rescue with 5FTHF( cell proliferation) using 136
xi
haemocytometer:
Table 3.49 shows c-myc inhibition and rescue with 5FTHF Cell survival) using trypan blue dye exclusion:
137
Dedications
To my beloved parents for their constant and requite love and support To my teacher in science
To my teacher in humanity
To my brothers, friends and colleagues I can’t thank you sufficiently
xii
Acknowledgement
I would like to express my deepest thanks and appreciation to my supervisor prof. Michele Rubini for his valuable, immeasurable advices, massive support and encouragement during the course of my PhD. I am mightily pleased with his indefatigable and tireless hard work, without his diligent task this work would never see the light
I would like to thank Dr. Joan Maurel in Hospital clinic Barcelona (Spain) for collaboration. I would like also to thank prof. Renato Baserga in Thomas Jefferson University Philadelphia (USA) for cooperation.
I am extremely indebted to the all colleagues in Rubini’s lab particularly Paola and Elia for their help and cooperation. Also I am grateful to the all staff in Medical Genetic lab namely Sergio, Alessandra, Rita and Barbara who have assisted and helped me with both their technical expertise time special thanks and appreciation to Dr Vencenzo who taught me several techniques and been helpful with me. I would like to thank Dr Luisa Ferrari in hematology department for helping us during FACS analysis
I am so grateful to my sponsor faculty of medical lab sciences and administration of teaching assistants University of Khartoum for financial support particularly prof. Nasereldin I would like to thank my wonderful friends especially in Cenacolo and Puitinati residence and companions for everything. I can never thank them sufficiently and I love you all.
xiii
TABLE OF CONTENTS
Introduction 1
1.1 General overview: 1
1.1.1 Ligands: 1
1.1.2 Insulin like growth factor binding proteins: 1
1.1.3 IGFBP proteases: 2
1.1.4 Insulin like growth factor receptors IGF R: 2
1.1.4.1 IGF-IR Internalization 3
1.1.4.1.1 clathrin mediated endocytosis 3
1.14.1.2 caveolin - dependent endocytosis 4
1.1.4.2 signaling via IGF-1R 4
1.1.4.3 SUMOylation 5
1.1.5 Oxaliplatin: 9
objective 10
3- Material and Methods: 11
3.1 Antibody production: 11
3.2 Immunization protocol and antibodies: 11
xiv
4.1 Chronic oxaliplatin exposure leads to acquired drug resistance 13 4.2 Activation of IGF-1R/PI3K-AKT pathway in cells chronically treated with OXL is due to increased MMP-7 and IGFBP degradation:
16
4.3 AMG 479 inhibits p-AKT in HT29 and HTOXAR3 cell lines, but induces apoptosis only in HT-29 cell line
16
4.4 IGF-1R, p-IGF-1R and caveolin-1 are located differently in HT-29 and HTOXAR3 cell lines
19
4.5 Phospho-IGF-1R in the nucleus is not inhibited in HTOXAR3 cell line by IGF-1R inhibitors
19
5- Discussion 24
6- Conclusion and Recommendations 27
1- Introduction and Review of literature 29
1.1 Folates: 29
1.1.1 Chemistry and properties: 29
1.1.1 Chemistry and properties: 29
1.1.2 Folinic acid: 31 1.1.3 Folate metabolism 32 1.1.2.1 overview 32 1.2 Cell cycle: 34 1.2.1 The G1→ S transition: 35 1.2.2. S- phase progression 36 1.2.2.1 Phosphorylation of E2F-1 36
1.3 Ultraviolet radiation UV: 37
1.4 c-Myc proteins: 38
1.5 Apoptosis: 39
1.5.1 Overview: 39
1.5.2 Morphology of apoptosis: 39
xv
1.5.3.1 Caspases 41
1.5.3.2 Intrinsic pathway 42
2- Rationale and specific aims: 43
3. Methodology and Results 44
3.1 Cell culture 44
3.2 Irradiation of cells with UVC light: 44
3.3 Trypan Blue dye Exclusion 44
3.2.1 Results: 45
3.4 Effect of Folinic acid on cell proliferation and apoptosis in UV-C treated HL60 cells:
46
3.4.1 Results: 47
3.4.2 Effect of Folinic acid on cell proliferation and apoptosis in UVC treated HL-60 cells
52
3.4.3 Effects of pre and post- treatment and UVC on cell proliferation 56
3.4.3.1 Results 57
3.5 Irradiation of cells with UVB light: 60
3.5.1 Effects of UVB and folinic acid on cell proliferation and apoptosis: 60
3.5.1.1 Result 60
3.5.2 5FTHF doses on UVB-treated HL-60 cells 62
3.5.2.1 Result 62
3.5.3 UVB dose exposure of HL-60 cells treated with 5FTHF ( cell count) 66
3.5.3.1 Results… 66
3.5.4 UVB dose exposure of HL-60 cells treated with 5FTHF ( cell count) 69
3.6 Cell cycle protocol with propidium iodide PI: 69
3.6.1 Flow cytometric analysis 72
xvi
3.5.5.1 Results 79
3.5.5.2 PI of stained cells by FACS 82
3.5.6 5FTHF doses on UVB-treated HL-60 cells 91
3.5.6.1 Result 91
3.5.6.2 Flow cytometric analysis 94
3.5.7 Serum free medium(SFM) - 5FTHF doses – 1-12 days kinetics: 103
3.5.7.1 Results 103
3.5.7.2 Flow cytometry analysis 105
3.5.7.2.44 Elaboration of FACS result 120
3.5.8 SFM 5FTHF 10x5 vs 50 9-15 days 122
3.5.8.1 Result 122
3.5.9 PBMC SFM 5FTHF doses 1-12 days 125
3.5.9.1 Peripheral Blood mononuclear cells PBMCs preparation 125
3.5.9.1.1 PBMCs isolation 125
3.5.9.1.2 Cells culture and 5FTHF doses 125
3.5.9.1.2.1 Results 125
3.5.10 SFM 5FTHF maximal effective dose 129
3.5.10.1 Results 129
3.5.11 Effect of 5FTHF supplemental on cell proliferation using HL-60: 131
3.5.11.1 Results 131
3.5.12 Effect of 5FTHF supplemental on cell proliferation using MCF-7 cell: 134
3.5.12.1 Results 134
3.5.13 c-Myc inhibition and rescue with 5FTHF: 135
3.5.13.1 Result 135
3.3.13.2 Flow cytometric analysis 138
xvii
3.5.13.3.1 Mitotic index of cells treated with c-myc inhibitor and rescue with folinic acid
141
3.5.13.3.1.1 Result: 141
3.5.13.4 synchronization of cells with methotrexate and treatment with c-myc inhibitor
142
3.5.13.4.1 Results: 142
3.5.13.5 Flow cytometric analysis for synchronization of cells with MTX and with 10058
143
3.5.13.5.1 Results: 143
4- Discussion 148
5- Conclusion and recommendations 155
xviii
List of abbreviations
5-CHO-THF 5-formyltetrahydrofolate AICD activation- induced cell death ALS acid labile subunit
ATP Adenosine triphosphate
BHLH-ZIP basic- helix-loop-helix-leucine zipper CAV-1 Caveolin-1
CCP Clathrin coated pits CCV clathrin coated vesicles
CPDs Cyclobutane pyrimidine dimers DACH diaminocyclohexane
xix
DHFR dihydrofolate reductase DNA Deoxyribonucleic acid DSBs Double strands breaks
dTMP deoxythymidylate monophosphate dUMP deoxyuridylate monophosphate ECM extracellular matrix
ERKs extracellular- regulated kinases
FAICAR formylaminoimidazol-4 – carboxamide ribonucleotide FGAR formylglycinamide ribonucleotide
FPGS folyl-poly-γ-glutamate synthetase enzyme GAR glycinamide ribonucleotide
GGH γ- glutamyl hydrolase Gly Glycine
IGF R Insulin like growth factor receptors IGF Insulin like growth factor
IGFBP Insulin like growth factor binding protein IR Insulin receptor
IRS-1 Insulin receptor substrate- 1
K Lysine
LDL low density lipoprotein LV leucovorin
xx
mCRC metastatic colorectal cancer MMPs matrix metalloproteinases mOS Median overall survival MS methionine synthase MTX methotrexate
MVB multi-vesicular body
NADPH Nicotinamide adenine dinucleotide phosphate nIGF-1R nuclear Insulin like growth factor receptors PABA Para-aminobenzoic acid
PARP Poly ADP ribose polymerase PBMCs Peripheral blood mononuclear cells PHA Phytohaemagglutinin
PIP3 phosphatidylinositol 3,4,5- triphosphate PteGlu Pteroylmonoglutamate
Rb retinoblastoma RNA Ribonucleic acid
ROI Reactive oxygen intermediate SHMT serine hydroxymethyltransferase SUMO-1 Small ubiquitin like modifier THF Tetrahydrofolate
TKR Tyrosine kinase receptor Ub ubiquitin
xxi
UDS Unscheduled DNA synthesis UVB Ultraviolet B
1
Introduction
1.1 General overview:
The insulin – like growth factor(IGF) system compose of two cognate ligands namely IGF-1 and IGF-2, three cell surface receptors, six IGF binding proteins and binding protein proteases((Baserga et al., 1997; Pollak et al., 2004). The IGF signaling axis plays a fundamental role in normal growth and differentiation, furthermore, badly involved in directing, mediating several aspects of the malignant phenotype in a different variety of human malignancies(Liu et al., 1993; Khandwala et al., 2000; Moschos and Mantzoros, 2002; Bohula et al., 2003).
1.1.1 Ligands:
The ligands IGF-1 and IGF-2 are powerful growth factors that serve a pivotal function in differentiation and development of the organism, tissue regulation and wound healing as well(Heald et al., 2006). Both IGF-1 and IGF-2 are synthesized by liver, particularly by extrahepatic sites encompassing both cancer cells and stromal fibroblasts(Chen et al., 2009). IGFs are single chain polypeptides, consisting of A-, B-, C- and D subunits having strong affinity binding toward IGF-1R existing in C domain. The weak binding affinities of both IGF-1 and IGF-2 for insulin receptor are attributed to the lack of ThrA8, IleA10, HisB5 and TyrB16 contact points in the A and B domains of IR(Gauguin et al., 2008). IGF-1 as well as IGF-2 share a 62% identity in amino acid sequence, with 40% identity between IGFs and pro-insulin(Fϋrstenberger and Senn, 2002). Interestingly, the comparative concentration of IGF-1 and IGF-2 vary in favor of IGF-2 that being five times greater than IGF-1 levels in human fetuses, as well as 3.5 times greater in adult serum(Bennett et al., 1983). nevertheless, Yakar et al.,(2005), found the expression levels of IGF-2 in human are ranged between 2 to 6 fold greater than those of IGF-1, moreover, IGF-2 is implicated in the progression of diverse type of tumours. However, the expression of IGF-2 per se is not far enough for malignant transformation.
1.1.2 Insulin like growth factor binding proteins:
The bioactivity and bioavailability of IGFs are modulated via a family of specific strong affinity binding proteins IGFBP-1- IGFBP-6(Bach et al., 2005). IGFBPs range in size between 24 – 40 kDa consisting of three structural subunits namely, N and C terminal domains that are identical containing conserved internal disulfide bonds. Intriguingly, both domains are
2
engaged in high affinity IGF binding. Paradoxically, the central linker domain, that ain’t conserved among the IGFBPs, is found to be mostly structurally disorganized doesn’t play a genuine role in IGF binding. Nevertheless, it is a common site of post-translational modification such as glycosylation and phosphorylation(Leon et al., 2013). Nearly 80% of circulation IGF are attached in a ternary complex including IGFBP-3 and abundant acid labile subunit(ALS)( Clemmons, 1998). IGFBPs share same affinities for both 1 and IGF-2, in contrast IGFBPs-5 and 6 link IGF-2 with10 and 100 folder higher affinity than IGF-1. In essence IGFBP are regulated by diverse proteases(reviewed in Andersson, 2009)
1.1.3 IGFBP proteases:
The matrix metalloproteinases(MMPs) are peptide hydrolases, active at neutral pH, metal ion are prerequisite for their catalytic activity. The MMPs have been well recognized as IGBP protease in the serum of pregnant rodents as well as in fibroblast- conditioned medium(Fowlkes et al., 1994; Fowlkes et al., 1994). MMPs degrade IGFBP releasing IGF thus increasing the bioavailability of IGFs (Miyamotoet al., 2004). MMP-7 is a member of this family, zinc- dependent enzyme produced exclusively by tumor cell, and implicated in many types and stages of cancer. Furthermore, this enzyme promotes and enhances metastasis and tumor growth via different variety of mechanisms e.g. Extra cellular matrix ECM degradation, regulation of angiogenesis remodeling and modulation on innate immunity(Chambers and Matrisian, 1997).
1.1.4 Insulin like growth factor receptors IGF R:
The IGF receptor family contains three transmembrane receptor tyrosine kinase (RTK), that mediates IGF bioactivity. In essence IGF-1R gene is positioned on chromosome 15q26 encoding a single polypeptide of 1367 amino acids that is basically expressed in most cells. Not surprisingly, the IGF-1R share around 70% amino acid homology with insulin receptor, as well as their genes show noticeable homology in terms of size and exon organization (Ullrich et al. 1986). IR has two splice variants: IR-B isoform that regulate glucose uptake and mainly expressed in liver, muscle and adipose tissue, compare to IR-A isoform that expressed by fetal tissues and some tumors, moreover, it avidly links to IGF-II promoting proliferation and survival(Sciacca et al. 2002). IGF-2R is a monomeric transmembrane that devoid of auto signaling activity it functions as a negative regulator of IGF activity by sequestration, endocytosis and degradation of 2(Nolan et al. 1990). IGF-1R as well as IR are produced as single- chain pre-pro-receptors, consist of a 30 residue single
3
peptide which is cleaved co- translationally. In transit to the membrane, pro-receptors are glycosylated, folded and dimerised under control of chaperone proteins prior sending to the Golgi apparatus. Where the receptors are processed at a tetrabasic Arg-Lys- Arg- Arg furin protease cleavage site generating a (130- 135 kDa) and B(90- 97 kDa)domains of the mature receptor(Ullrich et al. 1986). These gathered into disulphide link tetramers that contains two extracellular α subunits, containing710 amino acid(aa 1-710), that has in its structure two homologous domains namely L1 and L2 divided by a cysteine rich domain(48%) contains 25 or 27 cysteines in three repeating units and two β subunits containing 627 amino acid residues(aa 711- 1337) distributed among the extracellular domain(196 aa), the transmembrane domain(aa 906- 929), and intracellular region of the β subunit, which per se composed of a juxtamembrane domain , tyrosine kinase(TK) domain and C- terminal domain. The juxtamembrane domain contains NPXY motif, that may be important for receptor endocytosis. The catalytic domain contains the ATP binding motif(GXGXXG) that positioned between 976- 981, while the catalytic lysine located at position 1003, which is crucial for Mg-ATP binding.TK domain contains three intrinsic tyrosines, located at positions 1131, 1135 and 1136 is important for receptor autophosphorylation. The C- terminus regions roughly the last amino acid contains many regulatory elements fundamental for IGF-1R function((Adams et al., 2000; Ward and Garrett, 2004; reviewed in Girnita et al., 2013).
1.1.4.1 IGF-1R Internalization :
Binding of IGF ligand to its respective receptor induced autophosphorylation, and triggering compartmentalization of ligand/receptor complexes, resulting in detachment and degradation of ligand in the intracellular endosome/lysosome system, additionally, inactivation, recycling of receptors and termination of signal transduction(Foti et al., 2004; Romanelli et al., 2007). Notwithstanding, receptor endocytosis may also fundamentally, involved in signaling especially through Ras/MAPK pathway to mitogenic endpoint(Jensen and De Meyts 2009). IGF-1R mediate internalization via two canonical way clathrin and caveolin-1(Cav-1)(Martins et al., 2011).
1.1.4.1.1 Clathrin- mediated endocytosis:
In clathrin- mediated endocytosis, when the ligands bind to its receptor, the receptors move within the plasma membrane, bind to adaptor protein AP2 that, recruits clathrin to coat the invaginating pits at the plasma membrane hence called clathrin coated pits(CCP). Coated pits are pinched off thanks to the large GTPase dynamin to form clathrin
4
coated vesicles(CCV), that travel from the plasma membrane, undergo uncoating, and coalesce to the early endosomal compartment, which act as sorting station. Next the cargo proteins advance towards either the late endosome or the multi-vesicular body(MVB), wherein the ligand is uncoupled from the receptor primarily imputed to low pH environment of MVB, and the receptor is recycled back to the plasma membrane. Alternatively, they can be translocated to the lysosome, wherein they are degraded and destroyed(French et al., 1995; Sehat, 2007; Doherty and McMahon, 2009; Serini et al., 2012). The expeditious elimination of receptors from the cell surface and subsequent delivery to the lysosome is aimed to prevent sustained activation from both the plasma membrane and endocytic vesicles, which may result in cell transformation and tumorigenesis(reviewed in Abella and Park, 2009).
1.1.4.1.2 Caveolin-dependent endocytosis:
Caveolae are subfamily of lipid rafts, that is exist in cell surface invaginations. It is well distinguished by its flask shaped morphology(Simons and Toomre, 2000). Caveolin-1(Cav-1) is the basic protein, that form the caveolae(Salani et al., 2010). Furthermore, Caveolar structure and function in signaling and internalization as well depend primarily on Caveolin-1 and cholesterol.Cav-1 function to bind and assemble cholesterol. The N- and C- termini of the caveolae are protruded into the cytoplasm, indicating that they form hairpin shape in the membrane beside their ability to oligmerize, additionally, Caveolin serve as a coat protein(Mukherjee et al., 2006; de Laurentiis et al., 2007). Moreover, Cav-1 may interplay and modulate the bioactivity of various proteins t through scaffolding domain implicating it as a regulator of signal transduction(Li et al., 1996; Couet et al., 19997; Razani et al., 2002). There is a compelling evidence indicating that, the number of caveolae in cell and the level of Caveolin expression are closely related to the amount of cholesterol. The higher amount of free cholesterol in fibroblast, the higher external concentration of low density lipoprotein(LDL) that, resulted in an upregulation of Caveolin mRNA and increased the number of caveola(Fielding et al., 1997). Maggi et al., (2002), described the IGF-1R colocalization with Cav-1 in the lipid rafts enriched fraction on plasma membrane and IGF-1 triggering phosphorylation at the level of tyrosine 14 which subsequently results in the translocation of Cav-1, indicating that IGF-1 could regulate its intracellular signaling pathways by redistribution of Cav-1 on the cell surface, Interestingly one study showed that, tyrosine 14 is the principle substrate of Src kinase(Lee et al., 2000).
5 1.1.4.2 Signaling via IGF-1R:
The IGF-!R is triggered by IGFs exist in the extracellular milieu, stemmed from paracrine, endocrine or autocrine sources. Activation of IGF-1R results in autophosphorylation on tyrosines 1131, 1135 and 1136 in the kinase subunit ensued by phosphorylation of juxtamembrane tyrosines and carboxy- terminal serines. This is followed by recruitment of specific- docking intermediates e.g. (IRS-1), Shc and 14-3-3 proteins(Baserga et al. 1997; Pollak et al. 2004). Furthermore, in the wake of stimulation with cognate IGFs, the SH2- containing adaptor protein Shc is mobilized to phosphorylated tyrosine residue(Tyr950) in the juxtamembrane region of the IGF-1R, and transduce differentiation signals via the Grb2, Ras, Raf and MAPK pathway(Reiss et al., 2000; Valentinis et al., 2000). IGF-1R protects cancer cells against apoptosis, mainly via the phosphoinositide 3-kinase (PI3K) pathway, as once IRS-1 is phosphorylated by the activated IGF-1R, PI3K is activated by linking to IRS-1 through its regulatory subunit(Baserga et al., 1997). This interaction results in the levels of phosphatidylinositol 3,4,5- triphosphate (PIP3), to increase, and subsequently leads to mobilization and activation of phosphoinositide-dependent kinase- along with AKT/protein kinase B. Activation of AKT causes expression of anti-apoptotic proteins, namely Bcl-2, Bcl-x and NF-kB (Brazil et al. 2004). Additionally, IGF mediates the activation of extracellular- regulated kinases(ERKs), p38 and MAPK through 14-3-3- dependent mitochondrial compartmentalization of RAF(Peruzzi et al. 1999).
IGF-1R over expression is notoriously associated with increased predilection for invasion and metastasis that, mediated by myriad signaling intermediates influencing invasive capacity. Not surprisingly, IGF- instigated phosphorylation of IRS-1 can impact the interaction between E-cadherin and b-catenin, promoting and enhancing β- catenin transcriptional activity and disassociating E-cadherin from the actin cytoskeleton (Playford et al. 2000) The IGF-1R is found to be overexpressed in tumors, such as colon cancer, melanoma, pancreas, prostate and kidney((Hellawell et al., 2002; reviewed in Bohula et al. 2003a).
1.1.4.3 SUMOylation:
Is a post translational modification whereby protein function is regulated. It involves covalent binding of ubiquitin(Ub) and ubiquitin- like(Ubl) modifiers to target proteins, it forms a crucial step in cellular process such as differentiation, apoptosis, cell cycle and stress response(reviewed in Tozluog et al., 2010). SUMO-1(Small ubiquitin like
6
modifier), is a one member of the Ubl superfamily that linked to its target proteins and exist in mammal with different names(reviewed in Tozluog et al., 2010). Sehat et al., (2010), reported accumulation of IGF1R in the nucleus after undergoing SUMOylation. Intriguingly, nuclear IGF-R(nIGF-1R) was demonstrated to attach to putative enhancer site within the genomic DNA increasing the transcription. Interestingly, SUMOylation took place at three evolutionarily conservative lysine residues(K1025, K1100 and K1120) of the β domain of the receptor, accordingly, when these lysines were mutated the IGF-1R nuclear translocation and transcription activation were failed to materialize(Sehat et al., 2010).
The SUMOylation cascade is initiated by activating immature SUMO protein which cleaved by protease enzyme, and resulting in exposing C- terminal diglycine motif that is necessary for optimal adenylation by a heterodimeric SUMO E1 enzyme(also known as Aous1/Uba2), and hence get activated. Next SUMO activated by SUMO activating enzyme SAE-1 or E1, through attacking adenylate via a conserved Cys within E1 enzyme forming an E1- SUMO thioester. Then activated SUMO is subsequently transferred to specific conjugation SUMO F2(also known as Ubc9) enzyme, that consequently establishing E2-SUMO thioester. Two alternative pathways can take place as final step, either E2 can straight away transfer SUMO to lysine residue in targeted substrate, or SUMO ligase E3( also known as RanBP2), may join the complex, increasing the E2 catalytic activity, and transferring SUMO to its targeted substrates(reviewed in Sehat et al., 2010; Tozluogˇ lu et al., 2010; Gareau and Lima, 2010)
7
8
Figure 1.2 shows the Sumoylation mechanism by E1-E2 and E1-E2-E3 enzymes. (A) Produced as an inactive precursor, the SUMO protein is enzymes. (A) Produced as an inactive precursor, the SUMO protein is cleaved, exposing its Gly-Gly motif, and gets activated. (B) Active SUMO is transferred by E1 enzyme Aous1/Uba2 heterodimer to the E2 enzyme Ubc9. (C) Two alternative pathways can follow as the third step. Ubc9 can directly transfer SUMO to specific targets (top). Alternatively RanBP2, an E3 enzyme, can also join the complex, increasing the Ubc9( reproduced from Tozluogˇ lu M et al., 2010).
9
1.1.5 Oxaliplatin:
Oxaliplatin(trans-L-1,2 diaminocyclohexane oxalatoplatinum), is a platinum complex in which diaminocyclohexane(DACH) is the carrier ligand(Pelley, 2001). oxaliplatin is a third generation platinum compound, and is the first efficacious platinum- based compound used to treat colorectal cancer(Meyerhardt and Mayer, 2005). Oxaliplatin exerts its cytotoxic effect via effectual damaging and inhibiting DNA synthesis probably by forming adducts, commonly the intrastrand linkage of two adjacent guanines by N7 that are too difficult to repair(Schmidt and Chaney, 1993; reviewed in Desoize and Madoulet, 2002 ). oxaliplatin has synergistic effects when in a cocktail containing 5-fluorouracil and leucovorin (FOLFOX) for treating advanced colorectal cancer, with response rates >50% and median survival approaching 2 years(Alberts et al., 2005; Cassidy et al., 2004). However, resistance to chemotherapy is the lingering problem that encounter effective treatment of cancer, since sizeable of colorectal cancer patients developed resistance against oxaliplatin. Oxaliplatin- resistant cells are distinguished by low cellular oxaliplatin, accumulation and reduced DNA adducts, additionally, elevation of intracellular glutathione, mediated by gamma-glutamyl transpeptidase and altered in apoptotic pathway namely mitochondrial-mediated apoptosis(Mishima et al., 2002; Gourdier et al., 2002).
10
2- Objective
Relationship between the expression and cellular localization of IGF-1R and resistance to chemotherapy.
11
3- Material and Methods: 3.1 Antibody production:
the peptides were prepared by solid-phase synthesis using Fmoc strategy on a 430A peptide synthesizer (Applied Biosystems, Foster City, CA) and a 9050 Pepsynthesizer Plus (Perseptive Biosystems, Cambridge, MA). A 4-fold excess of Na-Fmoc amino acid, O-benzotriazol-1-yl- N,N,N9,N9-tetramethyluronium hexafluorophosphate, and 1-hydroxybenzotriazole and a 10-fold excess of diisopropylethylamine were used in every coupling reaction step. Elimination of the NH2- terminal Fmoc group was accomplished by
20% piperidine in N,Ndimethylformamide The cleavage of peptides from the resin was carried out with reagent K for 2 h at room temperature with gentle stirring. Crude peptides were precipitated in ice-cold methyl-t- butyl ether, centrifuged, and lyophilized. Crude peptides were then purified by preparative reverse-phase HPLC using a Dynamax-300Å C18 column (25 cm 3 21.4 mm, inner diameter) with a flow rate of 9 ml/min and two solvent systems of 0.1% trifluoroacetic acid/H2O and 0.1% trifluoroacetic acid/acetonitrile. The fractions
containing the appropriate peptide were pooled together and lyophilized. The purity of the final products was assessed by analytical reverse-phase HPLC, capillary electrophoresis, and matrix-assisted laser desorption/ionization time-of-flight mass spectrometry. Pep922 was a 19-amino-acid peptide corresponding to the C-terminus residues 1319–1337 of the human IGF-IR (numbering of Ullrich et al., 1986). Pep1046 was a 28-amino-acid peptide corresponding to residues 1310-1337 of the human IGF-IR, including a phosphotyrosyl residue at position 1316. Its sequence is NH2-FDERQPpYAHMNGGRKNERALPLPQSSTC-COOH (Rubini et
al., 1999).
3.2 Immunization protocol and antibodies:
Peptides were dissolved in 0.1 M sodium phosphate buffer (pH 7.0) and coupled to activated keyhole limped hemocyanin (Pierce) by glutaradehyde. Immunogens were diluted 1:1 with complete (first shot) or incomplete (subsequent shots) Freund’s adjuvant and injected intradermally in rabbits at 4-week intervals. The anti-peptide serum antibody level was
12
monitored by ELISA. To get rid of unwanted anti-C terminus antibodies, anti-pep1046 serum was cleared by reverse immunoaffinity purification using pep922-bound Sepharose. The antibody against pep1046 is hereafter referred to as anti-pY1316(Rubini et al., 1999).
13
4- Results:
A study conducted in collaboration with Codony-Servat and Maurel et al to detect the localization of p-IGF-1R and resistance to oxaliplatin using our antibody(anti-pY1316).
4.1 Chronic oxaliplatin exposure leads to acquired drug resistance
To investigate if chronic OXL treatment could result in acquiring drug resistance, a panel of two colorectal cancer cell lines (LoVo and HT-29) were chronically treated with increasing concentrations of OXL. Sensitivity of the basal LoVo cell line was 10-fold that of LoVOXAR3, 29-fold that of HT-29, and 120-fold that of HTOXAR3 (Fig 4.1). To analyze the OXL-induced apoptosis at 24 hours, Fas expression and caspase 8 cleavage (extrinsic pathway) were induced by OXL in LoVo (0.2 µM) and LoVOXAR3 (20 µM). No changes in these proteins were observed in HT-29 and HTOXAR3. Bcl-2 decreased in LoVo cells with 2 µM of OXL and in LoVOXAR3 with 20 µM of OXL. Bax increased with 0.2 mM of OXL, but 20 mM of OXL was needed to increase Bax in LoVOXAR3. Bax increased in HT-29 (2 µM) but was not induced in HTOXAR3 despite high 50µM doses. Bcl-2 decreased in HT-29 at doses of 2 mM, while 20mM doses were needed for HTOXAR3 cells (Figure 4.1 A). These results show that the oxaliplatin-resistant cell lines exhibit more resistance to apoptosis induced by oxaliplatin than parental cell lines. The extrinsic pathway is only implicated in the LoVo cell model.
To further characterize the properties of LoVo and HT-29, they investigated the effects of chronic OXL exposure in the IGF-1R pathway. they observed an increased expression of caveolin-1 in LoVOXAR3 and HTOXA3R cell lines compared with the parental ones. A specific difference between HT-29 and HTOXAR3 was increased expression and activation of IGF-1R in the latter (Figure 4.1B). LoVo cell lines express very low levels of MMP-7. HT-29 expressed MMP-7 but at a lower level than HTOXAR3. they found high levels of IGFBP-3 in LoVo and lower but still detectable levels in LoVOXAR3 cells. IGFBP-3 was not detected in
14
HT-29 cell lines. IGFBP-2 was also highly expressed in LoVo and was detected, with significantly lower expression, in LoVOXAR3 and HT-29, but not in HTOXAR3 cell line (Figure 4.1C).
Figure 4.1 colorectal cancer cell line (LoVO and HT-29), chronically treated with oxaliplatin had developed drug resistance
15
Figure 4.1 Colorectal cancer cell lines (LoVo and HT-29) chronically treated with oxaliplatin develop drug resistance.
A) Apoptosis induction after oxaliplatin inhibition at different doses (0.2, 2, 20 and 50) of parental and chronically treated cell lines was assessed.
B and C) Levels of IGF-1R, p-IGF-1R, MMP7, IGFBP-2 and caveolin-1 expression were determined by Western-blot in parental and resistant cell lines
16
D1-D4) p-IGF-1R, MMP7 and IGFBP-3 expression was determined in cell lines by ELISA
4.2 Activation of IGF-1R/PI3K-AKT pathway in cells chronically treated with OXL is due to increased MMP-7 and IGFBP degradation:
OXL caused an increase of MMP-7 in LoVOXAR3, HT-29 and HTOXAR3 (Figure 4.2A). In the parental HT-29, a marked decrease of IGFBP-2 expression was seen at 24hours (h)after 20 µM OXL exposure. Expression of IGFBP-2 was not detected in HTOXAR3. p-IRS-1 and p-AKT were inhibited in HT-29 at 20 μM concentration after 5’ of treatment and remained inhibited until 60’. This effect was not observed in the HTOXAR3 cell line (Figure 4.2B). They evaluated changes at 24h of MAPK and p-AKT after exposure to increasing OXL concentration (0.2, 2, 20 and 50 µmol/L). Phospho-AKT and p-MAPK were inhibited in Lovo cell lines after OXL treatment at doses as low as 0.2 µM at 24 hours. This effect was not observed in HT-29 and HTOXAR3 despite the administration of high (50 mM) doses of OXL (Figure 2C). Interestingly, a clear decrease in p-AKT was noted in HT-29 but not in HTOXAR3 at 1 hour after OXL exposure (Figure 4.2D).
4.3 AMG 479 inhibits p-AKT in HT29 and HTOXAR3 cell lines, but induces apoptosis only in HT-29 cell line
When MMP-7 was silenced in HTOXAR3 there was a partial reversion in OXL resistance, but not at the level of HT-29, suggesting that mechanisms in addition to MMP-7 could contribute to OXL resistance acquisition in HTOXAR3 cells (Figure 4.3A).
In vitro proliferation after 72 h exposure to individual drugs or a combination of them was assessed by MTT assay. Oxaliplatin primarily affects the HT-29 cell line. Sorafenib affects both HT-29 and HTOXAR3 cell lines equally, while panitumumab did not affect cell proliferation. AMG479 inhibited cell proliferation notably, and especially in HTOXAR3 cells. The effect of the combination of AMG479 plus sorafenib and oxaliplatin induced a maximum cytotoxicity in both cell lines (Figure 4.3B).
To investigate the effects of their drug in AKT and IRS-1 phosphorylation inhibition, they treated HT-29 and HTOXAR3 cells with AMG479, a monoclonal antibody against IGF-1R and TIMP-1, a MMP inhibitor. they observed that AMG479 and TIMP-1 inhibited p-IRS and p-AKT after IGF-1 stimuli. When they combined AMG479, TIMP-1
17
and sorafenib, they observed that p-IRS-1 and p-AKT inhibition was induced principally by AMG479. When they studied apoptosis they observed that the triplet combination of TIMP-1, AMG479 and sorafenib induced maximum apoptosis (in terms of PARP and caspase 3 cleavage) in the HT29 cell line, but did not show effects in the HTOXAR3 cell line (Figure 4.3C).
Figure 4.2. Activation of IGF-1R/PI3K-AKT pathway, in cells chronically treated with oxaliplatin, is due to increase of MMP7 and IGFBP degradation
(A) LoVo, LoVOXAR3, HT-29 and HTOXAR3 cells were treated with increased doses of OXL. MMP7 levels were analysed by ELISA method and WB after 48h after therapy. (B) HT-29 and HTOXAR3 cells were treated with OXL (20mM) and collected at indicated times. P-IRS-1, p-AKT, IGFBP-2 and IGF1R expression was assessed by western blot. C) Downstream effects on p-MAPK and p-AKT after different doses of OXL treatment (0.2, 2 and 20 mM) in LoVo, LoVOXAR3, HT-29 and HTOXAR3 cell lines.
18
D) HT-29 and HTOXAR3 cells were treated with OXL (20mM) and phospho-AKT inhibition was analyzed at 1 hour after therapy.
Figure 4.3 The IGF-1R inhibitor AMG479 combined with sorafenib prevents IRS-1-AKT signaling but not apoptosis in HT-OXAR3 OXL cells lines
A) MMP7 was silenced and the effect on OXL-resistance was evaluated by MTT.
B) Cytotoxic effects in parental HT-29 cell line and the resistant HT-OXAR3 cell line were analyzed after IGF-1 stimuli with oxaliplatin (5mM), panitumumab, (1mM), sorafenib 2 (mM) , and AMG479 (5mM), and different combinations of these drugs.
19
C) Phosphorylation of IRS-1 and AKT were assessed in parental 29 and resistant HT-OXR3 cells treated with AMG479, TIMP-1 and sorafenib.
D) Effects on apoptosis (PARP and caspase 3) at 48 hours, in parental HT-29 cell line and the resistant HT-OXAR3 cell line were analyzed after sorafenib, TIMP-1 and AMG479.
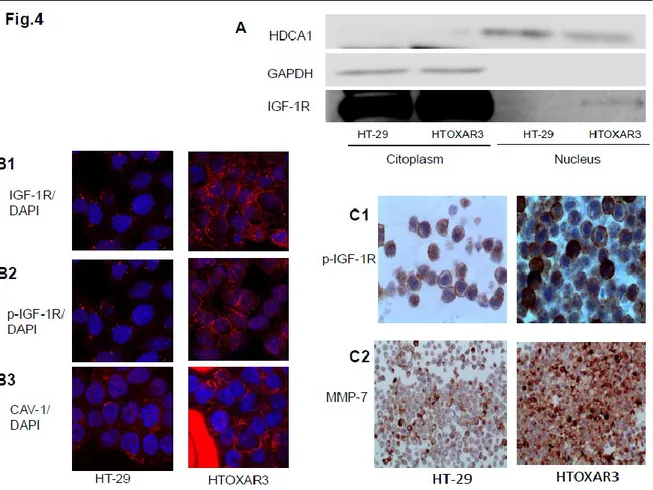
4.4 IGF-1R, p-IGF-1R and caveolin-1 are located differently in HT-29 and HTOXAR3 cell lines
It has been observed that IGF-1R was located in the nucleus in HTOXAR3 cells but this wasn’t detected in HT-29 cell line (Fig 4.4A). By confocal microscopy they observed that IGF-1R membrane expression was more intensive in HTOXAR3. they also studied caveolin-1 as a possible protein implicated in the internalization of IGF-1R. Caveolin-1 is located mainly in the cytoplasm of HT-29 but in a sparse manner. In HTOXAR3 cells, caveolin-1 was abundantly located in the peri-nuclear area. In HTOXAR3 there is a fraction of cells clearly showing p-IGF-1R expression and activation in the nucleus, but this nuclear pattern was not observed in the parental cell line (Figure 4.4B and Fig 4.4
A tissue block of HT-29 and HTOXAR3 cell lines were performed to study cells characteristics with conventional immunohistochemistry. Differences were observed in the percentage of positive cells, being higher in HTOXAR3 (90%) compared to the parental cell line (30%). There were no major differences in the intensity of MMP7 expression between HT-29 and HTOXAR3 cell lines, with both cell lines showing strong cytoplasm expression. It has been observed that HTOXAR3 expressed p-IGF-1R in moderate-to-intense membrane and dot-like peri-nuclear patterns, compared to HT-29 cell lines, which also express p-IGF-1R as membrane and in the form of dot-like peri- nuclear patterns, but with a weak intensity. These immunohistochemical results confirmed the data obtained with confocal microscopy. (Fig 4.4C)
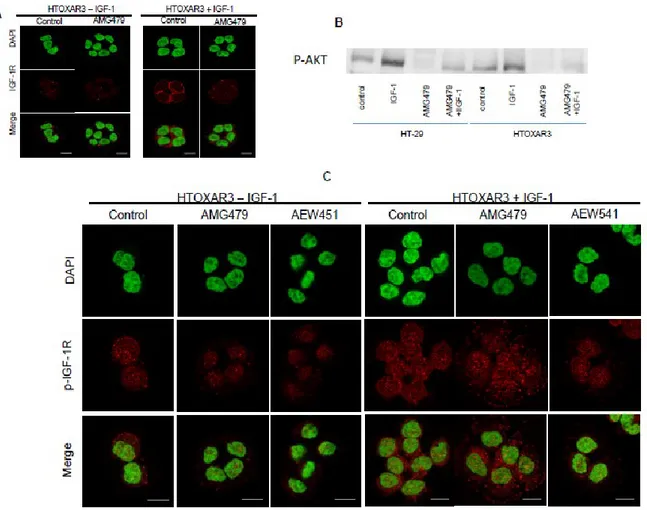
4.5 Phospho-IGF-1R in the nucleus is not inhibited in HTOXAR3 cell line by IGF-1R inhibitors
To further extend our findings, we examined by confocal microscopy the capacity of the tyrosine kinase inhibitor of IGF-1R AMG479 and AEW541 in HT-29 and HTOXAR3 cell lines to avoid nuclear translocation of IGF-1R. In HT-29 and HTOXAR cell lines, IGF-1R was inhibited in the membrane (Figure 5A and Supl. Fig 4.5). P-AKT was inhibited with and
20
without IGF-1 stimuli after AMG479 inhibition (Figure 4.5B). Despite p-IGF-1R membrane inhibition, p-IGF-1R was also located and remained in the nuclear area in the HTOXAR3 cell line (Figure 4.5C).
From November 2010 to December 2011, 113 consecutive mCRC patients were screened in 24 Spanish Hospitals in the ongoing prospective PULSE trial (NCT0128833) for p-IGF-1R (p-1316) MMP7 expression. Patients defined as DP should express MMP-7 (++ or +++ intensity in >66% of tumour cells) and p-IGF-1R (++ or +++ intensity in >66% of tumour cells); 48% of cases were positive for p-IGF-1R. Phospho-IGF-1R positive cases had different patterns of staining: peri-nuclear in 76%, 11% nuclear and only 13% membrane-apical staining. We found that tumours with positive p-IGF-1R expression, independently of the pattern of staining, had higher MMP7 co-expression (59%) compared with negative cases (13%, p<0.0001) (Figure 6).
Figure 4.4 IGF-1R, p-IGF-1R (p-1316) and caveolin-1 are located differently in HT-29 and HTOXAR3 cell lines
21
(B1) Location of IGF-1R was assessed in the resistant HTOXAR3 and the parental HT-29 cell line with confocal microscope
(B2) Location of p-IGF-1R was assessed in the resistant HTOXAR3 and the parental HT-29 cell line with confocal microscope.
(B3) Location of caveolin-1 was assessed in the resistant HTOXAR3 and the parental HT-29 cell line with confocal microscope.
(C1) Location of p-IGF-1R in HT-29 and HTOXAR cell lines with a cell tissue block (C2) Location of MMP7 in HT-29 and HTOXAR cell lines with a cell tissue block
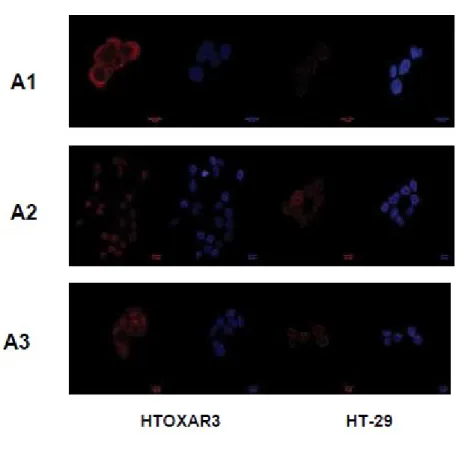
Figure 4.4 IGF-1R, p-IGF-1R (p-1316) and caveolin-1 are located differently in HT-29 and HTOXAR3 cell lines
(A1) Location of caveolin-1 was assessed in the resistant HTOXAR3 and the parental HT-29 cell line with confocal microscope
22
(B2) Location of p-IGF-1R was assessed in the resistant HTOXAR3 and the parental HT-29 cell line with confocal microscope.
(B3) Location of IGF-1R was assessed in the resistant HTOXAR3 and the parental HT-29 cell line with confocal microscope.
Figure 4.5: HT-29 and HTOXAR3 cell lines were treated with the IGF-1R monoclonal antibody (AMG479) and an IGF-1R tyrosine kinase inhibitor (AEW541). Changes in IGF-1R and p-IGF-1R (1316) were assessed with confocal microscopy.
A: IGF-1R expression with and without IGF-1 stimuli in HTOXAR cell lines after AMG479 treatment.
B: p-AKT expression with IGF-1 stimuli with and without IGF-1 stimuli in HT-29 and HTOXAR cell lines after AMG479 treatment.
23
C: p-IGF-1R (1316) expression with and without IGF-1 stimuli in HTOXAR cell line after AMG479 and AEW541 treatments.
Figure 4.5 (supl): HT-29 cell line was treated with the IGF-1R monoclonal antibody (AMG479) and an IGF-1R tyrosine kinase inhibitor (AEW541). Changes of p-IGF-1R (1316) were assessed with confocal microscopy.
24
5- Discussion
Acquisition of drug resistance is the main hindrance to effective treatment. In spite of Discovery of a new therapies in colorectal cancer, nearly all patients become chemo-resistant. The present study focused on whether the status of IGF-1R signaling, known to be involved in colorectal cancer progression and growth, contributes to OXL-resistance. The study presents two major findings that might represent a previously uncharacterized mechanism of IGF-1R-related acquired resistance. First, increase of MMP7 in HTOXAR3 contributes to IGF-1R activation and OXL-resistance. Second, HTOXAR3 cell line showed constitutive activated IGF-1R, in part located in the nuclear area, compared with HT-29 and this location probably contributes to IGF-1R resistance.
In LoVo cell lines, AKT phosphorylation was repressed after low OXL exposure and this effect was durable (>24h). In HT-29, although p-AKT inhibition was observed at 1 hour with high doses of OXL, this effect was not sustained at 24 hours. The levels of MMP7 obtained in HT-29 after 24h OXL-exposure were similar to the basal levels in HTOXAR3 and to those achieved by Miyamoto et al., (2004), in HT-29 when 200 ng/mL MMP7, was added to artificially engage p-IGF-1R (8). In the HT-29 cell line, MMP7 increased at 24 hours after OXL treatment, achieving levels similar to those observed in HTOXAR3. hypothesizing that IGFBP-2 degradation can be due to increased MMP7. These very high levels of MMP7 are
25
then able to activate IRS-1/AKT pathway and preclude the effect of OXL. The study describes that this mechanism of IGF-1R activation by MMP7 is acquired after chronic OXL exposure. Since MMP7 silencing can reverse OXL-resistance in HTOXAR3, at least partially, MMP7 appears to play a crucial role in OXL-acquired resistance. These results are in accordance with published data by Hörndler et al., (2011), showing that this specific pattern (MMP7+/p-IGF-1R+) reflects a subset of patients who are clinically resistant to irinotecan and cetuximab. IGF-1 regulates caveolin-1 and IRS-1 interplay in caveolae (Panetta et al., 2004). The mechanism by which caveolin-1 expression is increased in OXL-resistant cells (LoVOXAR3 and HTOXAR3) remains unexplained. Several reports indicate that in chemo-resistant colorectal cancer cell lines, caveolin-1 expression is increased (Bender et al., 2000), probably as a consequence of detachment (i.e., due to low levels of IGFs) and an ability of tumour cells to survive in the absence of ECM-derived signaling (Ravid et al., 2005). Gallego et al., (2009) has also reported that patients with ACRC treated with chemotherapy show lower levels of IGF-1 and IGFBP-3 at tumour progression, concomitant with increased MMP7.
Two types of IGF-1R induction mechanisms have been recently described. An acute induction (as rapid as 48h) has been described with erlotinib in cell lines addicted to EGFR/AKT pathway (Sharma et al., 2010). Interestingly, the cell subpopulation with EGFR TKI tolerance also exhibits reduced sensitivity to cisplatin. additionally, IGF-1R could be induced with AKT inhibitors in HER-2/AKT dependent cell lines, and also in cell lines lacking HER-2 amplification but AKT-dependent, resulting in FOXO-dependent nuclear translocation and RTK driven signaling (Chandarlapaty et al., 2011). A second mechanism of IGF-1R induction in RAF-MEK dependent cells is mediated by down-regulation of IGFBP and a PI3K-AKT switch after chronic treatment with BRAF inhibitors (Villanueva et al., 2010). A third mechanism that occurs in colorectal cells tolerant to chronic OXL as a consequence of MMP7 increase and suggest 1R/IRS-1/AKT engagement. A similar IGF-1R/IRS-1/AKT induction has been shown by IGFBP down-regulation after chronic erlotinib treatment (Guix et al., 2008). All these data suggest that IGF-1R induction and activation is a mechanism widely used by different types of tumours to acquire multi-drug resistance.
Simultaneous treatment with sorafenib and AMG479 induces maximum cytotoxic effects and AKT inhibition, but there was a modest apoptotic effect in HTOXAR3, suggesting
26
apoptotic-resistant pathways which are at least partially AKT independent. Therefore we assessed whether apoptotic resistance could be due to differences in p-IGF-1R location. observing that despite membrane p-IGF-1R inhibition with AMG479 and AEW541 in HT-29 and HTOXAR3 cell lines, there is a persistence of p-IGF-1R in the nucleus in the latter. speculating that phosphorylated IGF-1R in HTOXAR3, concomitantly with caveolin-1 increment could induce SUMOylation (Deng et al., 2011), allowing the translocation of part of the p-IGF-1R to the nucleus (Sehat et al., 2010). It has been reported recently that IGF-1R could work as a transcriptional enhancer in the nucleus by means of direct interaction with chromatin (Aleksic et al., 2010) and therefore mediate IGF-1R resistance in the nucleus by an AKT-independent pathway (Kulik and Weber, 1998; Remacle-Bonnet et al., 2007).
The data presented provide a strong rationale to explain why anti-IGF-1R compounds have low efficacy in chemo-resistant patients (Reidy et al., 2010; Eng et al., 2011; Watkins et al., 2011). Meaningfully, some colorectal cancer patients show initially p-IGF-1R in the nucleus, suggesting that a subset of colorectal cancer patients could be coherently resistant to anti- IGF-1R compounds and OXL (Cuatrecasas et al., 2011).
Matrilysin (MMP7) is known to activate pIGF-1R through IGFBP-3 degradation, and consequent releasing of IGF-1. In ACRC patients the co-expression of MMP7 and pIGF-1R (double positivity, DP) has been shown to correlate with poor prognosis in KRAS-WT patients treated with anti-EGFR (Cetuximab) in retrospective analyses (Hörndler et al., 2011). We recently performed a prospective clinical trial to validate those findings. Screening 196 mCRC patients treated with anti-EGFR (Panitumumab) in 24 Centers in Spain came out with a response rate of 56% in non-DP and of 67.6% in DP patients (p=0.18) and median PFS (95% CI) was 7.1 months (5.1-9.6) in non-DP and mPFS 9.9 months (8.1-15, p=0.19) in DP patients. Median overall survival (mOS) was 28.1 months (25.6-30) in non-DP patients vs 19.9 months (16.1-27.6, p=0.004). The multivariate (PS, LDH, age and sex) adjusted HR for mortality was 2.81 (1.33-5.96, p=0.0069). The results of this prospective study validates MMP7/pIGF1R as a novel strong prognostic biomarker in ACRC-KRAS-WT patients, treated in first-line with FOLFOX-6 plus anti-EGFR.
Overall, these results suggest that our anti-pIGR1R antibody could be considered a biomarker of response to immunotherapy in patients with ACRC.
27
6- Conclusion and Recommendations
These results have provided a full functional description of MMP7 and IGF-1R roles and interactions on the acquired resistance after chronic OXL exposure. Accordingly, nuclear IGF-1R location may contribute to intrinsic and acquired resistance to both OXL and anti-IGF-IGF-1R therapies. As this specific resistant pattern can be optimally evaluated by immunohistochemistry, with a specific antibody (IGF-1R-p-1316) (Rubini et al., 1999), we believe that our findings may allow potential new strategies to select patients with ACRC who are sensitive to chemotherapy and anti-IGF-1R compounds.
28
Part 2:
29
1- Introduction and Review of literature
1.1 Folates:
1.1.1 Chemistry and properties:
Folate, commonly known as vitamin B9 is a water soluble vitamin, existed naturally in a wide variety of foods such as green vegetables, and encompasses a large family of compounds with same chemical structures and nutritional properties( Gropper et al ., 2005). Folate, mediates the transport of one- carbon moieties crucial for the de novo biosynthesis of purine and thymidylate, and thus is a fundamental factor for DNA synthesis, replication, repair, methylation reaction and deficiency of vitamin which has been shown to play a major role in the causation of various disorders including anemia, atherosclerosis, adverse pregnancy outcomes, and cancer( Kim, 2007). It’s demonstration was dated back to 1931 by Lucy Willis who noticed that, extracts of liver and yeast when administered orally, were found to be effective in treating tropical macrocytic anemia( Willis, 1931; Shane, 1995). Subsequently, the specific nutritional factor in charge of the observed therapeutic benefit was isolated from liver extracts and the chemical structure was established to be N-[4-{[(2-amino-4-hydroxy-6- pteridinyl)methyl]amino}bonzoyl]glutamic acid. Moreover, the name pteroylglutamic acid’ was being proposed by the discovering scientist( Angier et al., 1946). the name folic acid was
30
concurrently proposed for nutritional factor with the similar nutritional properties that, had been isolated from spinach, with the word ‘ folic’ derived appropriately from Latin- folium( leaf)( Mitchel et al., 1941). The chemical structure of folic acid consists of three distinct components: para-aminobenzoic acid (PABA) is attached at one end to a 2-amino-4-hydroxy-pteridine (pteridin) moiety via a methylene group, and at the other end to one L-glutamic acid (glutamate) residue via a peptide bond( Shane, 1995).
Figure 1.1 chemical structure of folic acid ( pteroylmonoglutamate abbreviated as PteGlu). Folic acid consists of three distinct components: the pterine or ( pteridine) ring, which is conjugated to PABA( para- aminobenzoic acid by a methylene bridge which together are called pteroic acid , which is in turn joined to glutamic acid ( glutamate) residue via a peptide bond reproduced from ( Kim, 2007).
Folic acid is simply considered as parent structure of this large extended vitamin family existed as a stable, synthetic analogue that is found not only in supplement, but also added in fortified food. The term folate designate to the naturally occurring type of vitamin that is basically differ from folic acid in the oxidation rate of pteridine ring. Tetrahydrofolate THF is constituted of pteridine core ring system (2- amino- 4- hydroxyl – pteridine) that is linked in one side to p – aminobenzoic acid (also known as pteroic acid) via a methylene bridge from the C – 6 position of pyrazine ring, therefore, forming tetrahydropteroic acid. An additional link joins glutamate to the p- aminobenzoic acid with 1 to 9 residues. The pyrazine ring is completely reduced at the 5, 6, 7 and 8 positions forming the biologically active form, referred to as 5,6, 7,8 – tetrahydrofolate( THF). Dihydrofolate( DHF) is formed through two
31
consecutive reduction of 7 and 8 positions, using two molecules of Nicotinamide adenine dinucleotide phosphate( NADPH). Several other bioactive compound derive from this basic structure( Donnelly, 2001). Additionally, natural occurring forms of folate differ based upon the one carbon units attached at the N- 5 and / or N- 10 positions of THF(table 1.1) (Gropper et al ., 2005). In terms of stability, the reduced forms of folates depend upon the substituent of one- carbon. Nonetheless, reduced folates are categorically less stable compared to folic acid(Shane, 1995).
Table 1.1 one- carbon substitution of tetrahydrofolates
Folate derivative One- carbon substitution
5- FormylTHF -CHO 5, 10- MethenylTHF =CH 5, 10 MethyleneTHF =CH2 5- MethylTHF -CH3 10- FormylTHF -CHO 5- FormininoTHF -CH=NH 1.1.2 Folinic acid:
Folinic acid, 5-formyltetrahydrofolate (5-CHO-THF), also known as leucovorin( LV) is usually responsible of 3- 10% of total intracellular folate in mammalian cells. Nevertheless its metabolic function in cells has not been fully elucidated(Stover and Schirch, 1990). Folinic acid is formed from 5,10-methenyltetrahydrofolate (5,10-CH=THF) by a hydrolytic reaction catalyzed by serine hydroxymethyltransferase( SHMT) and whereby serine interconverted into glycine(Stover and Schirch, 1990; Holmes, and Appling, 2002).Moreover, spontaneous chemical hydrolysis of 5,10-CH=THF might be a minor extra source(Baggott, 2000). 5-CHO-THF is not only considered as the most stable naturally occurring folate, but also the most enigmatic, as it is solely doesn’t serve as a cofactor in one- carbon metabolism. 5-CHO-THF in place is a potent inhibitor of SHMT and many other folates dependent-