ISSN 1898-0309, doi: 10.2478/pjmpe-2019-0026
Scientific Paper
Nuclear reaction applied to fluorine depth profiles in human dental
tissues
Lorenzo
T
ORRISI1,a1Dipartimento di Scienze Matematiche e Informatiche, Scienze Fisiche e Scienze della Terra -MIFT, Università di Messina, V.le F.S.d’Alcontres 31, 98166 S. Agata, Italy
aE-mail address: [email protected]
(received 20 April 2019; revised 21 August 2019; accepted 24 September 2019)
Abstract
The nuclear reaction 19F(p, αγ)16O is presented as a valid method to measure the fluorine content in the first superficial layers of teeth. The analysis is performed in-vitro in extracted teeth, both healthy, fluorotic and decayed. It is performed irradiating the tooth with an energetic proton beam and analyzing the emitted high energy alpha particles. The quantitative analysis is performed comparing results with that of a standard sample at a known concentration. The depth profile of fluorine has a maximum content in the first superficial layers. The average concentrations in healthy enamel are of the order of 2 mg/g; it is of about 10 mg/g in fluorotic teeth, and below 0.1 mg/g in decayed teeth. The concentration in the dentine is about 50% lower than in the enamel and the concentrations decrease going from incisors to premolar and to molar teeth. Many results and a literature comparison are presented and discussed.
Key words: nuclear reaction; fluorine; tooth; fluorine concentration in teeth; dental tissue.
Introduction
Many works of literature report that fluorine has effects on the mineral skeletal tissue development and dental tissues, with particular regard to the period of formation and development of such hard tissues [1,2]. It has a high affinity for calcium and biologically it is mainly involved in the chemical bonding structure of calcium, phosphorus and orthophosphoric PO4
groups. Its exchange with the OH hydroxyl group realizes more stable molecules, enhancing the physical and chemical resistance of the apatite at which, generally, it is bonded as fluorapatite (Ca5(PO4)3F). Fluorapatite compound has a hard
hexagonal crystalline structure, a density of 3.15 g/cm3, a hardness of 5 in the Mohs scale and a refractive index of 1.64 [3].
Fluorine had to be incorporated into dental enamel during development to exert its maximum protective effect. Its provision in the human body comes mainly by food, water, environmental and toothpaste exposure [4-6]. Fluoroprophylaxis may be applied to patients with fluoride deficiency. The ingestion of fluorine during the pre-eruptive development of the teeth has a cariostatic effect, i.e. it reduces the risk of dental caries, due to the uptake of fluoride by enamel crystallites with the formation of fluorapatite, which is less acid-soluble than hydroxyapatite [7].
The dental enamel is particularly sensitive to this trace element and equilibrium is found with a specific concentration of fluorine in healthy enamel and dentine tissues, of the order of 2 mg per gram of matrix [7,8]. Too low or too high fluorine concentrations determine specific pathologies: dental caries and fluorosis, respectively. The correct intake of fluorine in the tissue confers considerable protection against diseases, as the well-known dental caries, and the anaesthetic opaque stains due to endemic fluorosis. Particular fluorine depth profiles in the tooth and gradient along the teeth of the dental arc are described in detail in the literature [9].
The chemistry of biological calcium phosphates and fluorapatite in the human body is very complex. Caries is a disease caused by bacteria that metabolize the sugars present in the oral cavity, producing corrosive acids against the enamel and the underlying dentin. Because of the acids, the enamel is deprived of its mineral component, formed essentially of calcium and phosphorus but also of fluorine. Literature reports that the daily fluoride requirement is estimated to be about 1.5-4 mg in the adult population [2].
Different methods of analysis of fluorine in teeth have been employed, such as chemical, physical and biological, as reported in the literature [10].
The aim of this research is that to present one of the different possible nuclear physics methods to analyze the equilibrium quantity of fluorine in teeth and measure its concentration in the different tooth zones, as investigated in the last recent years in bones and dental tissues [8,11-13]. A comparison of the results with the concentrations measurable in the cases of specific pathologies and with literature is also presented and discussed.
To this, a specific nuclear reaction in the fluorine-19, as a very sensitive technique, was applied in-vitro to extracted teeth in south Italy and analyzed in a Physics laboratory.
Experimental set-up
1.0-2.0 MeV proton beams have been accelerated at the Physics Department of Catania University using a Tandetron accelerator. Protons were employed to induce the nuclear reaction 19F(p, αγ)16O, consisting of their introduction in the F-19 nucleus and in the production of the excited Ne-20 compound nucleus. This last is unstable and decay immediately emitting α particles at the fundamental state (α0) or decay
emitting alpha particles at three possible excited states (α1, α2
and α3) of the O-16 nucleus, which de-excites in γ-rays of
specific energy (γ1, γ2 and γ3). Thus, the compound nucleus is
transformed into stable oxygen-16 [14,15].
This reaction is exoenergetic with the production of 8.11 MeV energy. Part of this energy can be given to the emitted alpha particles or γ-rays.
The kinetic energy of the alpha particles emitted to the fundamental state is E(α0) = 6.93 MeV.
The energies of the three gamma-rays are E(γ1) = 6.14 MeV,
E(γ2) = 6.91 MeV and E(γ3) = 7.12 MeV.
A scheme of the studied nuclear reaction, showing the de-excitation levels and the emitted radiations, is reported in
Figure 1a.
Thus, the measure of the fluorine present in the sample to be analyzed can be performed irradiating with energetic proton beams and detecting the α0 particles or the three γ-rays or both
characteristic radiations. Increasing the proton energy the range increases and the response from deeper layers can be monitored.
In our measurements was choice to detect the characteristic 6.93 MeV α0 particles. To avoid also the detection of protons at
lower energy scattered by the target, a thin mylar film of 27 microns thickness was used as an absorber in front of the alpha detector. Mylar is crossed by the more energetic alpha particles but not by the lower energetic protons.
Figure 1b reports a scheme of the used in-vitro experimental set-up in a vacuum chamber at 10-6 mbar pressure.
The probability of occurring of the reaction 19F(p, α0)16O is
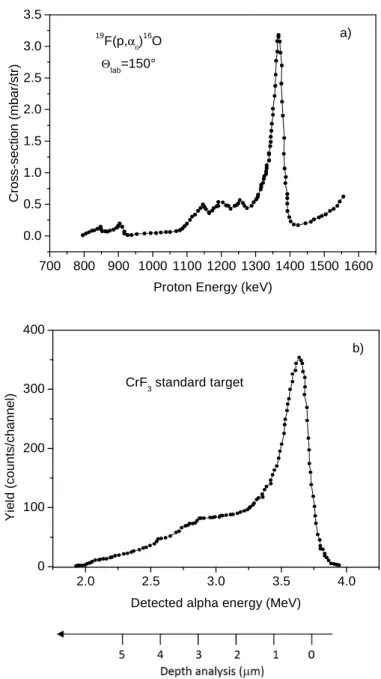
determined by a known cross-section versus the proton energy [16], which is presented in Figure 2a for a detection angle of 150°. The cross-section has a resonant peak at 1350 keV proton energy, at which it assumes the maximum value of about 3.25
mbarns/sr. Moreover, a near cross-section plateau occurs for proton energies between 1150 keV and 1300 keV at which it assumes a value of about 0.5 mbarns/sr, and decay to negligible values for proton energies lower than 1100 keV [16].
The teeth were previously irradiated by 2.0 MeV alpha particles, to measure their composition using the scattered particles in Rutherford backscattering spectrometry (RBS) regime at different energies [16].
The qualitative and quantitative calibration of the nuclear reaction methodology was obtained using a standard compound of CrF3 of different thicknesses, ranging between 50 nm and 7
microns, in which the F concentration is constant and uniform. The standard compound has a density of 3.8 g/cm3, while the density in enamel and dentine tissues is of about 3.1 g/cm3 and 2.6 g/cm3, respectively. The fluorine concentration in the standard sample is CS = 6.3x10²² atoms/cm3.
Figure 1. Scheme of the (p, αγ) nuclear reaction with energies of produced radiations (a) and scheme of the experimental set-up in vacuum for the proton irradiation and the alpha detection (b).
Tooth Enamel Dentine H+ Beam Detector
α
γ-rays P=10-6 mbar b) Mylar absΘ
=150°
a) MeV Proton 19F 20Ne 16O α0 6.93 γ1 γ2 6. γ3 7. α1 α2 α3
Figure 2. Cross-section of the reaction as a function of the proton
energy for detection at 150° (a) and typical spectrum in the CrF3
standard sample reporting the yield versus the detected alpha energy and the depth in the dental tissue (b).
Generally, the proton beam was employed at 1350 keV using 50 nA current and a beam spot of 1 mm2. However, other analyses were performed up to 2.0 MeV and 100 nA current in order to increase the proton penetration depth, the deeper fluorine analysis and the detection sensitivity in dental tissue. The alpha particles were detected using a Si p-n junction detector (Ortec) connected to a counting rate electronics and to a suitable multichannel analyzer reporting linearly counts versus channels, which were converted in alpha yield versus energy using reference standard samples.
The different stopping powers of protons and alpha particles in the samples were considered for the CrF3 standard sample
and for the dental tissue. In particular, for the used proton
energies (800 keV-1500 keV) the stopping powers in CrF3 is
about 10% higher than in hydroxyapatite (Ca5(PO4)3(OH)2),
supposed it to be the main mineral of the enamel. Thus, this difference affects the different penetration in the two materials (range). 1350 keV protons travel about 5.0 µm in CrF3 and
6.6 µm in hydroxyapatite before they are slowed down to 1.1 MeV, when the alpha production becomes negligible (see cross-section trend of Figure 2a).
In our used set-up, by using 1350 H+ beam, due to the detection angle of 150°, the investigated depth in the tooth corresponds to about 4.6 microns.
The stopping power of the 6.93 MeV alpha particles in the standard CrF3 and in the hydroxyapatite is SS = 207 keV/µm
and ST = 197 keV/µm, respectively. The energy loss of the 6.93
MeV alpha particles in the 27 µm mylar absorber is 3.32 MeV. The silicon detection efficiency for such alpha particles is 100%.
Thus, the fluorine concentration in the tooth, CT, can be
calculated comparing the alpha spectrum in the CrF3 standard
with that in the tooth and evaluating it as following:
= ∙ /
/ ∙ Eq. 1
where ZT is the depth in the tooth, Cs the standard fluorine
concentration, H the count rate (yield) in the tooth (HT) and in
the standard (HS), Q is the proton charge sent to the tooth (QT)
and to the standard (QS), and Sα the alpha stopping power in
the tooth (SαT) and in the standard (SαS).
By using 120 µC charge collection, the minimum detectable level (MDL) is evaluated at about 3x10¹⁸ atoms/cm3 corresponding to 0.1 mg/g in dental enamel.
SRIM code was used to calculate the ion stopping powers, ranges, and energy losses [17].
More details on the physical aspects of the used nuclear technique are reported in the literature [18,19].
The nuclear reaction was applied, again as in the past, to a new set of healthy teeth (n. 7 samples indicated with #1H…#7H), extracted for endodontic motifs, another set of decayed teeth (n. 7 samples indicated with #1D…#7D) and a third set of endemic fluorotic teeth (n. 7 samples indicated with #1F…#7F). All teeth were extracted to different patients of both sexes living in Sicily, in the Catania province, with an age between 59 and 72 years. In order to obtain information on the fluorine concentration at high depth, some teeth were cross-sectioned to analyze their interior enamel and dentine.
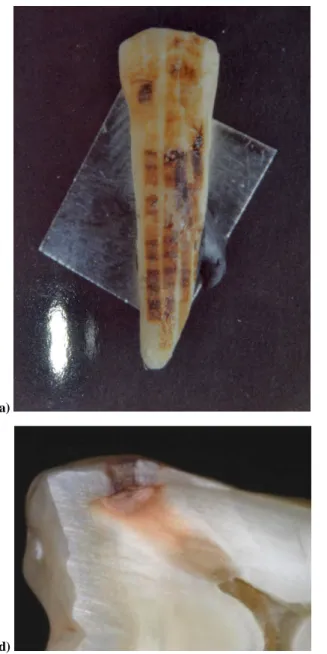
The analysis was performed in enamel and dentine of healthy, decayed and fluorotic teeth and in a different teeth of the dental arch. Figure 3 reports a photo of an incisive tooth irradiated on all external surface (the black colour is due to the proton beam irradiation) (a), a particular of the enamel-dentine interface in a cross-sectioned tooth (b), a cross-sectioned dentine (c), and cross-sectioned decayed enamel and dentine in molars (d, e). 700 800 900 1000 1100 1200 1300 1400 1500 1600 0.0 0.5 1.0 1.5 2.0 2.5 3.0 3.5 C ro s s -s e c ti o n ( m b a r/ s tr )
Proton Energy (keV) 19 F(p,α0)16O a) Θlab=150° 2.0 2.5 3.0 3.5 4.0 0 100 200 300 400 Y ie ld ( c o u n ts /c h a n n e l)
Detected alpha energy (MeV) CrF3 standard target
a)
b)
c)
d) e)
Figure 3: Photo of an incisive tooth irradiated on all surface (the black colour is due to the proton beam irradiation) (a), a particular of the enamel-dentine interface (b), a cross-sectioned dentine (c), and cross-sectioned decayed enamel and dentine in molars (d,e).
Results
Figure 2b shows a typical alpha spectrum produced by 1350
keV protons and detected from the CrF3 standard sample (6 µm
thickness). The spectrum is plotted in terms of the alpha yield (counts per channels) versus their detected energy (through the mylar filter). The shape of the spectrum is similar to that of the exciting nuclear reaction cross-section. The spectrum indicates also the depth analysis scale in microns and it is a reference for the quantitative analysis because the fluorine concentration is uniform and corresponds to 6.3x10²² F atoms/cm3.
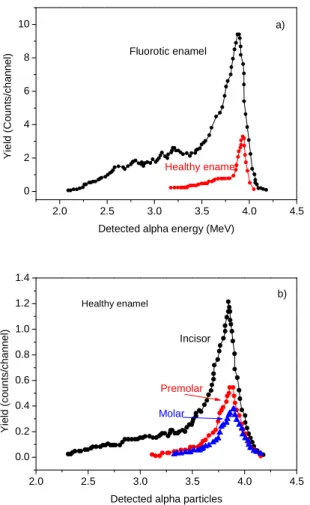
Figure 4 reports some alpha spectra acquired in dental tissues and in particular for the comparison between fluorotic and healthy enamel of two incisors (4a) and for the comparison between the fluorine content in the enamel of incisors,
premolars and molars teeth (4b). The analyses are referred to as the first 4.6 microns of the superficial layers of the sample. The comparison of the different spectra with that of the standard sample permits us to evaluate the fluorine depth profile in the different tooth structures by applying Equation 1. An example of typical fluorine depth profiles measured in incisor crowns (vestibular face) of fluorotic teeth is reported in
Figure 5a. For comparison, the bottom spectrum of the same
figure indicates the depth profile of healthy enamel. All spectra indicate that the fluorine concentration decreases from the surface, at which the concentration is higher, with depth and assumes an about constant value at depth of the order of 5 microns. The maximum concentration is measured in the enamel surface and is lower of about 50% in dentine. The higher concentrations are found in incisors and the lower in
molar teeth. The concentrations in fluorotic teeth are about 5 times higher than in healthy ones. The vestibular enamel faces present about 50% higher fluorine with respect to the palatine enamel faces of the same tooth.
Figure 5b reports some spectra relative to the fluorine concentration depth profiles measured in healthy teeth, referred to crown palatine faces. In addition, in this case, the higher concentrations are localized at the enamel surface. For comparison, in the same figure, the bottom spectrum indicates the F depth profile in the dentine of a molar tooth.
For a better vision and synthesis of obtained results, Table 1 reports the fluorine concentrations in the first-micron depth of different teeth extracted from different patients both healthy, than fluorotic and decayed. The reported data are measured with experimental errors of the order of 12-15%. A more variation in fluorine concentration was measured in decayed teeth. Here the F concentration depends on the tissue distance from the area of the carious outbreak (F increases at higher distances).
Figure 4. Alpha spectra from analysis of healthy and fluorotic enamel of two incisors (a) and comparison between the fluorine content in the enamel of incisor, premolar and molar teeth (b).
Figure 5. Fluorine depth profiles in different fluorotic enamels (a) and in different healthy enamels (b). The comparison of the depth profiles between fluorotic and healthy enamel and between healthy enamel and dentine is also reported.
Tooth
Healthy (#1H…#7H), mg/g Fluorotic (#1F…#7F), mg/g Decayed (#1D…#7D), mg/g
Enamel (vestibular) Enamel (palatine) Dentine Enamel (vestibular) Enamel
(palatine) Dentine Enamel Dentine
Incisor 4.8±0.6 2.4±0.3 0.5±0.06 14.6±1.5 6.6±0.8 7.0±0.9 0.8±0.12 0.2±0.03 Incisor 3.0±0.4 1.8±0.25 1.8±0.2 13.7±1.5 7.2±0.85 6.6±0.9 0.5±0.08 0.1±0.03 Incisor 2.8±0.3 1.5±0.2 1.5±0.2 12.2±1.5 5.0±0.6 6.2±0.8 Canine 1.9±0.25 0.9±0.1 0.3±0.04 12.1±1.5 6.1±0.7 6.0±0.8 0.2±0.03 ≤MDL Pre-molar 2.8±0.3 0.2±0.03 9.2±1.4 3.9±0.5 3.5±0.4 ≤MDL ≤MDL Molar 0.9±0.1 0.2±0.03 <MDL <MDL Molar 0.8±0.1 0.2±0.03 <MDL <MDL
Table 1. Summary of the main results of fluorine content in the first superficial micron of the investigated teeth (healthy, fluorotic and decayed) in different places of their surface.
2.0 2.5 3.0 3.5 4.0 4.5 0 2 4 6 8 10 Y ie ld ( C o u n ts /c h a n n e l)
Detected alpha energy (MeV) Fluorotic enamel Healthy enamel a) 2.0 2.5 3.0 3.5 4.0 4.5 0.0 0.2 0.4 0.6 0.8 1.0 1.2 1.4 Y ie ld ( c o u n ts /c h a n n e l)
Detected alpha particles
Healthy enamel Incisor Premolar Molar b) 0 1 2 3 4 5 0 2 4 6 8 10 12 14 16 F c o n c e n tr a ti o n ( m g /g ) Depth (microns) #1F #2F #3F #4F #5F #2H (Healthy)
Fluorotic Teeth, Apical Vestibular Enamel a)
Incisor Incisor Premolar Molar Molar 0 1 2 3 4 5 0.0 0.5 1.0 1.5 2.0 2.5 3.0 F c o n c e n tr a ti o n ( m g /g ) Depth (microns)
Healthy Teeth, Apical Vestibular Enamel
Incisor
Premolar
Molar Dentine
Obtained results indicate that the average concentrations in healthy enamels are about a factor 4÷5 times lower than in fluorotic ones. The dentine contains about 50% less fluorine with respect to the enamel both in healthy and fluorotic teeth. The F concentrations decrease from incisors to premolar and to molar teeth, indicating an intake process coming from the external.
Discussion and Conclusions
The paper demonstrates that a nuclear reaction analysis can be employed to study in vacuum extracted teeth in order to evaluate their fluorine content in surface and in deep for healthy elements and pathological ones.
Some observations of the results indicate that the normal F concentration in healthy enamel ranges between 4.8 mg/g and 0.8 mg/g decreasing from the maximum values for the incisor teeth to the minimum ones measured in the premolars and molars. The fluorotic teeth, showing F concentrations of about five times higher than in the healthy ones, not have white and reflecting enamel, such as in the healthy teeth, but show a yellow and opaque colour with a typical dark spot of the enamel. The discoloration is caused by the post-eruptive uptake of stains into the hypo-mineralized, porous enamel. In such spots the presence of fluorine was high. On the contrary, the fluorine concentration in the dental caries is very low and generally below the MDL, i.e. below about 0.1 mg/g, indicating a very low concentration of fluorapatite. Inside the decaying zone, the F concentration is always below the MDL value.
Such results obtained in the enamel of teeth extracted in Catania region (Sicily, Italy) population is in good agreement with the fluorine concentrations measured in other countries of the Mediterranean basin. For example Salah et al. in 2007 [20] from measurements in Algeria using the same technique reports that mostly the fluorine concentration fluctuates between 3700 and 4500 µg/g along the outer regions of the teeth (enamel), while the concentration value in the internal regions is found to lie between 3090 and 3900 µg/g (dentine). Carvalho et al. in 2001 [21] from measurements in Portugal using the same technique has measured F concentrations in canine and incisors, not carious ranging between 1.5 mg/g and 2.4 mg/g, between 1.0 and 0.9 in healthy premolars and between 0.9 and 0.6 in decayed premolars.
In agreement with the data reported in literature, we find that the F concentration in dentine is always lower than in the enamel and generally is a factor 2 times lower both in healthy, fluorotic and decay teeth (in the not decay zones). A difference between the F concentrations in the vestibular and palatine faces is evident: in the vestibular (buccal, external face) the F
concentrations are higher of about 50% than in the palatine faces (lingual, internal face).
The investigations on the fluorine depth profiles in the vestibular enamels indicate that they are similar, having high surface concentrations and decreasing to half value to about 3-4 microns depth, after which the concentration remains near-constant inside the tooth, decreasing at the interface with the dentine.
These results indicate that the main intake of fluorine may occur probably from the external environment and probably are also activated by the presence of visible and UV radiation, as reported in the literature [22].
In conclusion, the higher fluorine concentration is measured in the vestibular enamel of fluorotic teeth, at which concentrations up to 14 mg/g were measured. Such teeth are hypo-mineralized and therefore prone to premature breakdown. This causes the development of posteruptive lesions in fluorotic enamel and leads to more rapid wear of fluorotic teeth. In addition, such teeth are free of caries but the pathology produces not aesthetically aspects, they are opaque and stained. Literature reports that dental fluorosis was also found in prehistoric teeth, analyzed in our times because they are still particularly resistant and well preserved [23].
The concentration in healthy enamel teeth is of about 2-4 mg/g and decreases to a half value at about 2-4 micron depth. In their dentine, the concentration is about half than the maximum concentration in the enamel. The concentration decreases going from incisors to premolars and molars. Reported measurements are in good agreement with literature data [7,24].
In the decayed teeth the fluorine concentration is measurable only far from the decayed zone and generally is low, while it is below 0.1 mg/g, corresponding to the MDL of the technique, in the decayed core. This result confirms also the high fragility of the mineral phase in the absence of fluorapatite.
A fluoroprophylaxis should be performed at low levels of fluorine content if it is measured in children [25,26].
The decrement of fluorine concentrations between vestibular and palatine faces and that from incisors to molars indicates that probably the major fluorine intake comes from the external environment, food, water, air, and toothpaste.
Acknowledgements
This work was supported by the “Research and Mobility” project of Messina University No. 74893496.
Author thanks Prof. E. Rapisarda of the First Dentistry Clinic of Catania University for teeth collection and preparation and collaboration to the presented data.
References
[1] Buzalaf MAR, editor. Fluoride and the oral Environment. 2011. Basel, Switzerland: Karger; 2011.
[2] Standing Committee on the Scientific Evaluation of Dietary Reference Intakes. Dietary Reference Intakes for Calcium, Phosphorus, Magnesium, Vitamin D, and Fluoride. Food and Nutrition Board, Institute of Medicine. 1997.
[3] Anthony JW, Bideaux RA, Bladh KW, Nichols MC, editors. Handbook of Mineralogy.Chantilly, USA: Mineralogical Society of America. http://www.handbookofmineralogy.org/pdfs/fluorapatite.pdf
[4] Paiva MF, Delbem ACB, Danelon M, et al. Fluoride concentration and amount of dentifrice influence enamel demineralization in situ. J Dent. 2017;66:18-22.
[5] Martinez-Mier EA, Shone DB, Buckley CM, et al. Relationship between enamel fluorosis severity and fluoride content. J Dent. 2016;46:42-46.
[6] Campus G, Cagetti MG, Spano N, et al. Laboratory enamel fluoride uptake from fluoride products. Am J Dent. 2012;25(1):13-16. [7] Rosin-Grget K, Peros K, Sutej I, Basic K. The cariostatic mechanisms of fluoride. Acta Med Acad. 2013;42(2):179-188.
[8] Torrisi L, Rapisarda E. Fluorine concentrations in the enamel and dentin of healthy, carious and fluorotic teeth in a nuclear reaction study. Minerva Stomatologica. 1984;33(1):17-21.
[9] Fejerskov O, Kidd E, editors. Dental Caries – The Disease and its Clinical Management. Munksgaard, Oxford: Blackwell; 2008. [10] Richards A, Coote GE, Pearce EI. Proton Probe and Acid Etching for Determining Fluoride Profiles in Porous Porcine Enamel. J
Dent Res. 1994;73(3):644-651.
[11] Sastri CS, Iyengar V, Blondiaux G, et al. Fluorine determination in human and animal bones by particle-induced gamma-ray emission. Fresenius J Anal Chem. 2001;370(7):924-929.
[12] Rapisarda E, Sortino F, Torrisi L. Physical analysis of the structure of dental enamel using the photon induced X-ray emission method. Minerva Stomatologica. 1982;31(4):415-422.
[13] Cabanelas P, Cruz J, Fonseca M, et al. Cross Sections for proton induced high energy gamma-ray emission (PIGE) in reaction 19
F(p,αγ)16O at incident proton energies between 1.5 and 4 MeV. Nucl Instrum Meth Phys Res B. 2016;381:110-113.
[14] La Cognata M, Palmerini S, Spitaleri C, et al. Updated THM Astrophysical Factor of the 19F(p, α)16O reaction and influence of new direct data at astrophysical energies. Astrophys J. 2015;805:128-134.
[15] Torrisi L, Sheng KL, Rapisarda E, Foti G. Depth distribution of fluorine in enamel teeth by 19F(p, α0)16O reaction. Il Nuovo Cimento D. 1985;5(2):164-174.
[16] Tesmer JR, Nastasi M, editors. Handbook of Modern Ion Beam materials analysis. Pittsburg, Pennsylvania: Materials Research Society. 1995.
[17] Ziegler J. SRIM, The stopping and range of ions in the matter. http://www.srim.org/
[18] Rapisarda E, Torrisi L, Scala F. Difference in concentration of fluoride in the buccal and lingual enamel of teeth with or without fluorosis, analyzed by nuclear reaction. Stomatologia Mediterranea. 1984;4(3):387-395.
[19] Torrisi L, Foti G, Campisano SU. Fluorine microanalysis in teeth. Clinical Materials. 1990;5(2-4):139-145.
[20] Salah H, Arab N. Application of PIGE to Determine Fluorine Concentration in Human Teeth: Contribution to Fluorosis Study. JNucl Radiochem Sci. 2007;8(1):31-34.
[21] Carvalho ML, Karydas A, Casaca C, et al. Fluorine determination in human healthy and carious teeth using the PIGE technique. Nucl Instrum Meth Phys Res B. 2001;179(4):561-567.
[22] Majni G, Torrisi L Molinari G. Fluorine absorption in dental enamel assisted by UV irradiation. Il Nuovo Cimento D. 1988;10(2):137-143.
[23] Torrisi L. Fluoride concentration in ancient teeth measured by nuclear reaction. Clinical Materials. 1994;17(3):151-154. [24] Ekstrand J, Fejerskov O, Silverstone LM, editors. Fluoride in Dentistry. Copenhagen; 1988.
[25] Buzalaf MAR, Levy SM. Fluoride Intake of Children: Considerations for Dental Caries and Dental Fluorosis. In: Buzalaf MAR, editor. Fluoride and the oral Environment. 2011. Basel, Switzerland: Karger; 2011. pp. 1-19.
[26] Vernole B, Palano D, Molinari G, et al. In vitro enamel fluoridation using an ultraviolet laser. Bull Group Int Rech Sci Stomatol Odontol. 1989;32(1):47-52.