XXXVII CONFERENZA ITALIANA DI SCIENZE REGIONALI
ARE EUROPEAN FUNDS SUPPORTING NEW FIRMS’ FORMATION WELL SPENT?
NEW EVIDENCE ON THE ROLE OF PUBLIC EXPENDITURE FOR
ENTREPRENEURSHIP IN ITALY
Andrea Ciffolilli
1, Eleonora Cutrini
2, Marco Pompili
3Preliminary draft, please do not quote
ABSTRACT
This paper analyses the relation between the European expenditure for entrepreneurship in 2007-2013 and new firm formation in the Italian provinces (NUTS3 level). Binomial regression models are used to estimate the effects of public spending as well as of a set of control variables drawn from the literature on new firm formation. We find that EU spending has a positive and significant effect on new firm formation. We also find a clear evidence of positive effects of: human capital, demand growth (measured by the average annual growth rate of population) and density of economic activity (measured by the number of existing firms per thousand inhabitants). The role of other factors is less clear but, overall, the findings confirm that even in a time of recession, the resources used for entrepreneurship policy had the desired effect and more can be done in the future to extend their scope and coverage.
1 Ismeri Europa, Via G.G. Belli 39, 00193 Roma, e-mail: [email protected].
2 Università degli Studi di Macerata, Dipartimento di Giurisprudenza, Piaggia dell’Università 2, 62100, Macerata, e-mail: [email protected] (corresponding author).
Introduction
Entrepreneurship and new firm formation are essential for competitiveness, employment, prosperity of regions and, ultimately, for individual wellbeing. According to the literature, several factors are important for explaining regional variation in new firm formation. These factors are wide ranging and include: the business cycle, the existence of an innovation friendly environment characterised by the availability of services and institutions which facilitate entrepreneurship (e.g. from incubators to research and financial institutions), industrial density and the average size of existing firms, labour market characteristics (e.g. unemployment rate and structure, human capital), demographic features, cultural factors and history.
European countries and regions invest a significant amount of EU Cohesion policy resources on firm formation both directly, through non-repayable and repayable grants (EUR 746 million, or nearly 4% of total ERDF was disbursed in Europe for these kind of initiatives in the 2007-2013 period), as well as indirectly (e.g. by strengthening research and innovation systems, developing transport and digital infrastructures, investing in education and training, encouraging self-employment).
Therefore, understanding the role of public intervention in respect to firm formation is crucial for policy design, evaluation and management, in addition to being relevant for economic theory. Nonetheless, the public policy side is often disregarded in the studies on firm formation, also due to a scarcity of suitable data.
The present paper is aimed at mitigating this knowledge gap and providing an original contribution to the existing evidence. A binomial regression model is used to analyse the factors which may have influenced new firm formation, including public expenditure co-financed by the EU, in Italy over the period 2007-2013. The inclusion of the public policy dimension is made possible by a new database on the European Regional Development Fund (ERDF) expenditure by NUTS3 and priority theme which was developed by the authors for the European Commission in 20154. ERDF is the main and often the only source of public funding for facilitating business creation in the majority of the Italian regions.
The preliminary results of the analysis are consistent with the existing literature as regards the relation between firms formation, density of economic activity, human capital, and unemployment rate. Furthermore, our analysis shows that public spending has a positive and significant effect on new firm formation.
The remainder of the article is organized as follows. Section 1 reviews the relevant literature. Section 2 illustrates the data, the variables used in the analysis and the estimation method. The results of the analysis are discussed in section 3 and conclusions in section 4.
1.
Literature review
The empirical literature so far has devoted only a scant attention to the role of public expenditure on new firm formation. The main reasons include the difficulties in evaluating the effects of public policies and also that the culture of evaluation has only recently been introduced in the public sphere, especially in Italy.
Several factors have been recognized to be important in regional variation in new firm formation: industrial density, size structure, population growth and household wealth, labour market characteristics (unemployment rate and, more recently, also unemployment structure; human capital), financial development, cultural factors.
The density of industrial activity should facilitate spillovers across different manufacturing sectors (agglomeration economies) (Ciccone and Hall, 1996) and thus should have a positive effect on new firm
4 We thank Stefano Condello of Ismeri Europa, who was involved in the WP13 project and contribute to produce the database..
formation. Armington and Acs, 2002 to capture this spillover effect use an industry density indicator (number of establishment divided by the population). The economic cycle, growth dynamics (population growth, income growth are indicators to capture this growth effect) and ownership and household wealth (Garofoli, 1994) should facilitate new firm formation. Industry density and population growth rates are usually found to have strongly positive effects on creation of new firms; income growth also but to a lesser extent (Armington and Acs, 2002; Audretsch and Fritsch, 1994; Keeble and Walker, 1994;).
The size structure of existing enterprises can be a factor influencing new firm formation rates. Localities dominated by small firms have high rates of new firm formation (Cross, 1981; Storey, 1982; Audretsch and Fritsch, 1994; Garofoli, 1994; Armington and Acs, 2002). Gudgin et al., 1979; Cross, 1981, show that a large proportion of entrepreneurs spring from having had prior experience in small firms. In this sense, Cross 1981, argues that the small firm is the best incubator of entrepreneurial capacity. In the case of Italy, this has been considered to reflect the importance of local productive systems but also reflects the relatively high barriers to entry in industries dominated by large firms (Garofoli, 1994).The existing literature also highlighted that areas dominated by large plants are likely to have lower rates of new firm formation (Gudgin, 1978) because even if large firms both provide employment for highly skilled workers in the economy, they fail to provide a suitable training ground for new entrepreneurs.
Unemployment has an ambiguous role in relation to new firm formation. In this respect there are two opposing view. On one side, drawing from the seminal work of Oxenfeld (1943), due to the lack of job opportunities individuals tend to become self-employed therefore higher rate of unemployment should increase new firm birth (unemployment push-hypothesis). On the other side, lower rate of unemployment are usually associated to economic prosperity, high level of demand and thus positive expectations for entrepreneurs (unemployment pull-hypothesis). In this second case, the relationship between unemployment and new firm formation should be negative. Some studies are consistent with the unemployment push-hypothesis (e.g Storey and Johnson, 1987), others found support of the unemployment pull-hypothesis (e.g. Storey, 1991; Audretsch and Fritsch, 1994) while some are not conclusive in this respect (Armington and Acs, 2002; Audretsch et al. 2005). To better understand this uncertain relationship, Audretsch et al., 2014 considers the impact of unemployment structure by duration and skill endowments and found that both have an important impact in the regional start-up intensity.
For Italy, in their analysis conducted on 103 provinces for the period 1997-2003, Santarelli et al. (2009) conclude that unemployment does not provide a positive effect on entry (push effect is not confirmed by their analysis). When the analysis is conducted at the regional level, the effects of unemployment on entry depend upon the sector under study, but are mainly negative, thus confirming the unemployment pull-hypothesis (Carree et al. (2008).
According to the incubator hypothesis metropolitan areas and core regions should have a crucial role in new firm formation (Hoover and Vernon, 1959; Vernon, 1960). However such hypothesis is not supported in the Italian case (Garofoli, 1994).
Another important driver of firm birth rate is the entrepreneurial culture, which is related to features of the local population, cultural traits such as life modes (self-employment, career and wage-work) (Illeris, 1986) and other characteristics of the local institutional environment (e.g. political leadership, financial and educational institutions) (Johannisson, 1984). Regions where there is dominance of large and externally owned firms should have low new firm birth rates, while large metropolitan areas, where well-educated workers engaged in the advancement of their career are widespread, there should be a higher rate of new firm formation (See Armington and Acs, 2002 for a discussion on this issue). Fritsch and Mueller (2007) found that the main factors determining the level of regional start-ups are innovation and an entrepreneurial climate.5 They conclude that steering innovation and creating an entrepreneurial
5 Entrepreneurship Climate is here proxied by the share of employees working in small and young businesses in the respective region. Businesses were classified as small and young when they had less than 20 employees at the time
atmosphere could be an appropriate starting point for policy measures that try to promote start-ups, although their effect can be appreciated only in the long run.
In this context, new firm formation should also be positively associated with higher levels of educational attainment. In fact, human capital is usually found to be positively associated with new firm formation especially in technologically advanced industries (Armington and Acs, 2002; Savage et al., 1998; Anselin et al. 1997, 2000). Nevertheless, when the analysis is restricted to manufacturing firms the relationship between college education and birth rate is negative. Garofoli, 1994 found that areas having a large proportion of manual workers have low rates of new firm formation.
More recently, cultural diversity of the population and migration have been recognised to be crucial from the point view of knowledge transmission mechanisms (Audretsch et al., 2010 and Niebuhr, 2010).
The role of the public expenditure is investigated by Karahasan (2015), that analysed new firm formation in Turkey during the period 1997-2006. In this case, the evidence provided demonstrates the inability of the public support to explain regional new firm formation, possibly because less developed locations have benefited more from public expenditure and subsidies. Karahasan (2015) confirms the role of local demand, business cycles, human capital, for manufacturing and service sectors.
As for Italy, the recent literature that focuses on the spatial differences in new firm formation is limited. Audretsch et al., 1999 carried out a survival analysis of firms in each manufacturing industry and related the growth process to the start-up size. Santarelli et al., 2009 analyses the relationship between firm entry and exit and unemployment in Italian provinces for the period 1997-2003. Carree et al. (2008) conducted a similar analysis but at the regional level. They find that industrial districts are important determinants for entry but only for manufacturing. In the context of the Great Recession, in Italy the analysis on the demography of firms have focused more on firm survival (eg.; Ferragina and Mazzotta, 2014) and/or firm mortality (e.g. Cainelli et al., 2012, Arrighetti et al., 2016) rather than new firm formation.
2.
Data and method
1. 1.Data
This study utilizes several databases. As regards the population of new firms established in Italy we refer to Unioncamere (Movimprese).
Data on EU public spending (ERDF) supporting new firm formation were produced within the Ex-post evaluation of Cohesion policy 2007-2013 (Work Package 13 of “Geography of Expenditure”). The study, carried out by Ismeri Europa and Wiiw6, was aimed at collecting and estimating data on the cumulative allocations to selected projects and the expenditures, at the end of 2013 and 2014, of both ERDF and CF programmes at the NUTS3 level of EU regions for all 28 EU countries. Data were collected with the support of a network of national experts and estimations were performed when data were available at lower level of detail. Data are broken down by 86 priority themes, as defined in the Commission Regulation No 1828/2006 (annex II). This makes it possible to analyse how much EU support was invested in relevant fields (for instance enterprises, transport, research, human capital development, etc.).
Furthermore, data on economic context, demographics and labour market conditions of Italian provinces are from the Italian National Institute of Statistics (ISTAT) and the Ministry of Education, University and Research.
.
2. 1.
Method
The geographical unit of analysis used for this study is the Italian provincial level (NUTS3).
To select the appropriate regression model we performed a simple analysis of our dependent variable (new_firms_2014): the number of new firms at provincial level in 2014. The variance of the dependent variable is nearly 6,000 times larger than the mean. The distribution of our outcome variable is certainly characterized by over-dispersion, that is, greater variance than might be expected in a poisson distribution. The distribution of the number of new firms is also highly skewed to the right.
We have first run a poisson regression, and tested the poisson goodness-of-fit (gof) of the model (with the Stata poisgof command). The large values of chi-square in the goodness of fit that we have found warned us that the poisson distribution would not be a good choice. The significance of the test (p<0.05) from the gof confirms that the poisson model was not inappropriate.
Considering that the dependent variable is a count variable characterized by over-dispersion, we evaluated the relation between structural funds and new firm formation by estimating a negative binomial regression model (for a similar approach, see Bonaccorsi et al, 2013 and Audretsch and Lehmann 2005).
We estimate the following specification:
)
exp(
' , 2 1 , 1 ,t pt pt x p pexpenditur
e
X
Newfirm
=
α
+
β
−+
β
−+
ε
(1)Our main explanatory variable is the EU public spending supporting new firm formation (expenditurep,t-1). It identifies the actual expenditures carried out within the European cohesion policies in
the 2007-2013 period. We considered three policy areas in our study to calculate expenditure for new firms’ formation: Support for self-employment and business start-ups (ERDF priority theme no. 68); Other measures to stimulate research and innovation and entrepreneurship in SMEs (priority theme no. 9); and Advanced support services for firms and groups of firms (priority theme no. 5). The first component is completely aimed at supporting new firms formation, the other two have a broader scope, but many interventions were financed to support entrepreneurship within these two areas. The expenditure include only the European Funds and not the national co-financing.
We identified different additional explanatory variables, drawing on the existing literature on regional variation in new firm formation (See Section 2 for a survey of the relevant literature).
Xp,t-x in Equation (1) is a vector of control variables. For them, we consider the average values for the
period 2008-2013 or 2012-2013 depending on the availability of data (See Table A1 in the Appendix for details). The considered variables are:
• Density of economic activity: We include the number of incumbent firms per thousand inhabitants (av_firms_pop_2008_13) in the same province p to check for the importance of the density of economic activity, which, according to the literature, should positively affect new firm creation.
• Demand growth: As a measure of the demand growth we use the increase in population (average for the period 2008-2013, av_popincrease_2008_13 ). We expect to find a more vital new firms’ formation in provinces with higher population growth.
• Unemployment: To verify which of the competing view on the effect of unemployment on new firm birth (unemployment push-hypothesis vs unemployment pull-hypothesis) we include the unemployment rate (percentage of unemployed individuals out of the total workforce) in province p (av_dis_2008_2013)
• Entrepreneurial culture: We consider the proportion of self-employed (or independent workers) over the total workers (av_sh_indip_2008_2013). The proportion of strictly
autonomous workers in the active population should show a positive sign according to the literature.
• Urbanization economies: It is hypothesized here that new firm formation rates are positively associated with urban area localities with high levels of immigration, and provinces with high proportions of younger workers in the economy. Therefore, we included the percentage of the population between 25 and 44 years old out of the total population in the province p (av_sh_25_44_pop_2012_13).
• Human capital: We also consider the role of human capital in the local labour market including a variable that measure the proportion of graduates in the active population (share_laureati_2013).
• Cultural diversity: cultural diversity of the population and migration have been recognized to be crucial from the point view of knowledge transmission mechanisms (Audretsch et al., 2010 and Niebuhr, 2010). We thus include the share of immigrant over total population in province p (av_sh_stra_2012_13).
• Manufacturing specialization: We intend to capture whether new firm formation is higher in the provinces that are more specialized in the manufacturing production. Therefore we included the share of manufacturing employees out of total employees in the province p (av_sh_manuf_2008_2013).
• Industrial districts: The presence of industrial districts is captured by a count variable, with values corresponding to the number of industrial districts in province p according to Istat (2015). This variable ranges from 0 to 14 (See Table 1). There are 43 provinces for which Istat has identified no industrial districts while the highest value (14 industrial districts) is associated to the province of Brescia (n_industrial_districts).
• Firms’ size: In the past decades, during the Seventies and Eighties, small firms were considered the best incubator of entrepreneurial capacity, particularly in industrial districts (See Section 2 for a review). In more recent years, the size of existing firms still continues to be important, but it seems that medium-sized firms are central in the context of district areas. Some scholars have explicitly recognised that Italian export performance derives mainly from the performance of medium-sized enterprises that are mostly localized in industrial districts (Coltorti et al., 2013). Therefore with the aim to capture the structure of firms we have included in our analysis the share of firms with different size (small firms, medium-sized firms and large firms) classified according to the number of employees.
We also use interaction terms that allow us to evaluate the marginal effect of industrial districts’ density in the province p once firms’ size is accounted for.
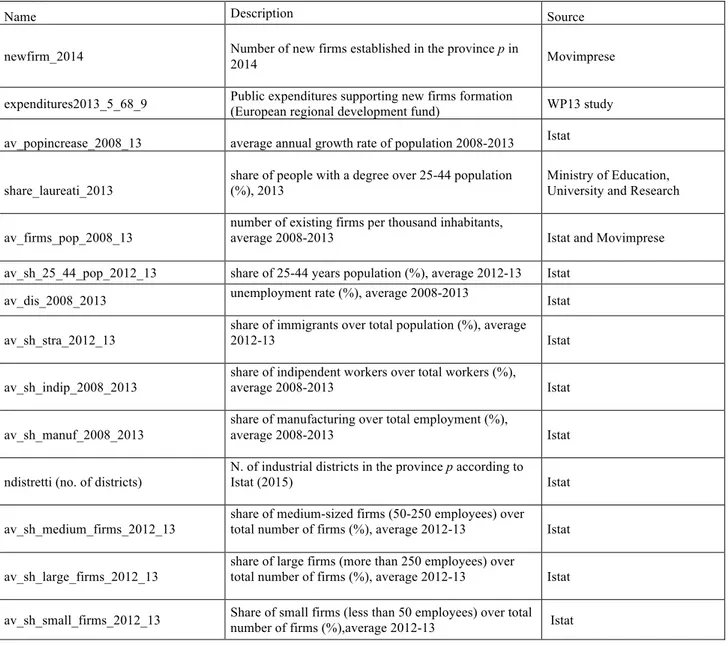
The complete list of variables, with a detailed description and the source of data, is reported in the Appendix (Table A1).
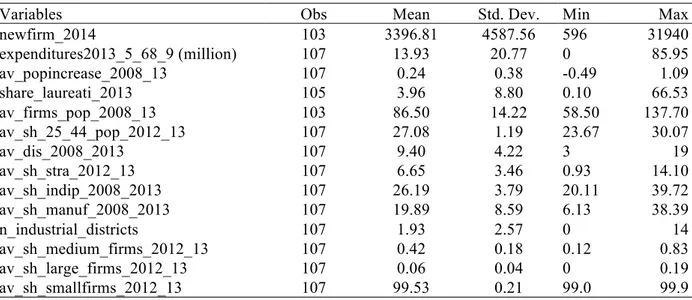
Table 1. Summary statistics
Variables Obs Mean Std. Dev. Min Max
newfirm_2014 103 3396.81 4587.56 596 31940 expenditures2013_5_68_9 (million) 107 13.93 20.77 0 85.95 av_popincrease_2008_13 107 0.24 0.38 -0.49 1.09 share_laureati_2013 105 3.96 8.80 0.10 66.53 av_firms_pop_2008_13 103 86.50 14.22 58.50 137.70 av_sh_25_44_pop_2012_13 107 27.08 1.19 23.67 30.07 av_dis_2008_2013 107 9.40 4.22 3 19 av_sh_stra_2012_13 107 6.65 3.46 0.93 14.10 av_sh_indip_2008_2013 107 26.19 3.79 20.11 39.72 av_sh_manuf_2008_2013 107 19.89 8.59 6.13 38.39 n_industrial_districts 107 1.93 2.57 0 14 av_sh_medium_firms_2012_13 107 0.42 0.18 0.12 0.83 av_sh_large_firms_2012_13 107 0.06 0.04 0 0.19 av_sh_smallfirms_2012_13 107 99.53 0.21 99.0 99.9 Data on 103 Italian provinces were considered in the analysis. The dependent variable, whose average is approx. 3,397 over the period, is characterised by a considerable variance and ranges between 596 in Oristano and 31,940 in Rome.
The EU expenditures on categories 5, 9 and 68 (our main exploratory variable) amounts to EUR 1,490 million, representing 14% of total ERDF spent in Italy at the end of 2013. ERDF expenditure ranges between zero and 85.95 in Bari.
Most of the other explanatory variables show a considerable variance across provinces except for the population growth, the average share of medium, large and small firms which are quite uniform across the territories.
The first 30 provinces with the highest shares of large firms are located in Centre-North provinces, the highest being in Milan (0.19%); the same is true for the share of the medium-sized firms. On the contrary, the share of small firms is higher in the south provinces.
3.
Discussion of results
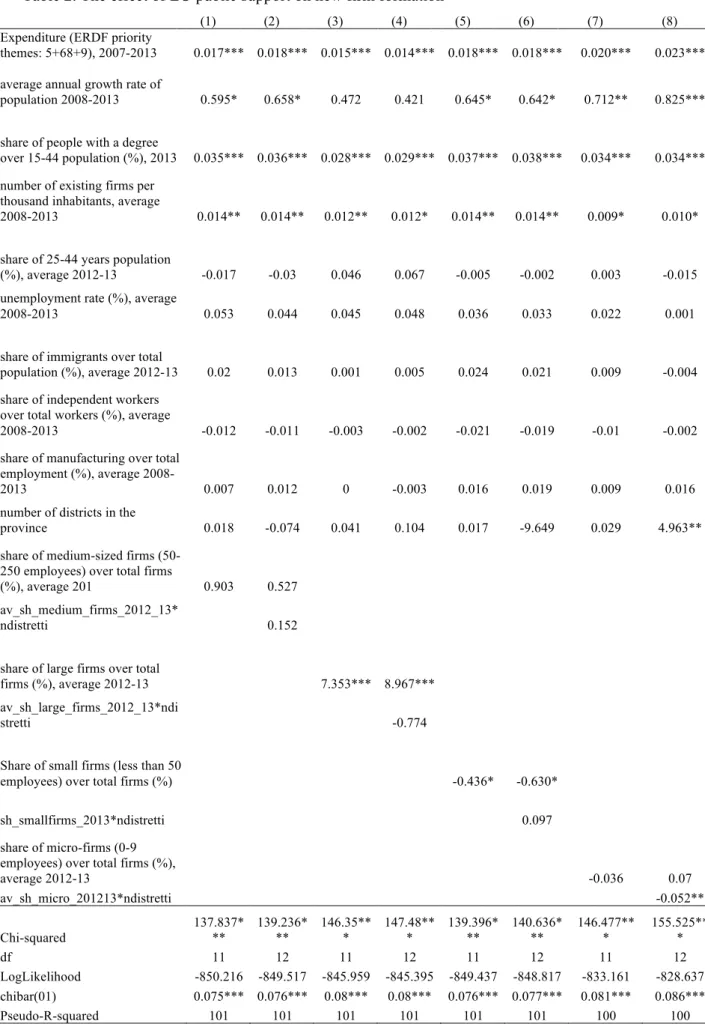
Table 2 shows the results of the negative binomial regressions of Eq. (1). First we discuss the effect of ERDF-financed policies supporting new firm formation and then continue with the effect of industrial structure and the other explanatory variables. The equations (1), (3) and (5) differ due to the inclusion of different firms’ size indicators. Equation (1) considers the share of medium-sized firms in the local economy, equation (3) considers the share of large firms in the local economy (number of firms with more than 250 employees as a % of the total number of firms), equation (5) considers the share of small firms (number of firms with less than 50 employees as a % of the total number of firms) while equation (7) considers the share of micro-firms (firms with less than 10 employees). In equations (2), (4), (6) and (8) the respective interactions terms are included to control for the marginal effects of the presence of industrial districts once the firm’s size is accounted for. All equations also include a set of control variables to capture the role of demand growth, urbanisation economies, the density of economic activity, unemployment, immigration, entrepreneurship culture (independent workers), the industrial’s orientation of the local economy.
Table 2. The effect of EU public support on new firm formation
(1) (2) (3) (4) (5) (6) (7) (8)
Expenditure (ERDF priority
themes: 5+68+9), 2007-2013 0.017*** 0.018*** 0.015*** 0.014*** 0.018*** 0.018*** 0.020*** 0.023*** average annual growth rate of
population 2008-2013 0.595* 0.658* 0.472 0.421 0.645* 0.642* 0.712** 0.825***
share of people with a degree
over 15-44 population (%), 2013 0.035*** 0.036*** 0.028*** 0.029*** 0.037*** 0.038*** 0.034*** 0.034*** number of existing firms per
thousand inhabitants, average
2008-2013 0.014** 0.014** 0.012** 0.012* 0.014** 0.014** 0.009* 0.010*
share of 25-44 years population
(%), average 2012-13 -0.017 -0.03 0.046 0.067 -0.005 -0.002 0.003 -0.015
unemployment rate (%), average
2008-2013 0.053 0.044 0.045 0.048 0.036 0.033 0.022 0.001
share of immigrants over total
population (%), average 2012-13 0.02 0.013 0.001 0.005 0.024 0.021 0.009 -0.004
share of independent workers over total workers (%), average
2008-2013 -0.012 -0.011 -0.003 -0.002 -0.021 -0.019 -0.01 -0.002
share of manufacturing over total employment (%), average
2008-2013 0.007 0.012 0 -0.003 0.016 0.019 0.009 0.016
number of districts in the
province 0.018 -0.074 0.041 0.104 0.017 -9.649 0.029 4.963**
share of medium-sized firms (50-250 employees) over total firms
(%), average 201 0.903 0.527
av_sh_medium_firms_2012_13*
ndistretti 0.152
share of large firms over total
firms (%), average 2012-13 7.353*** 8.967***
av_sh_large_firms_2012_13*ndi
stretti -0.774
Share of small firms (less than 50
employees) over total firms (%) -0.436* -0.630*
sh_smallfirms_2013*ndistretti 0.097
share of micro-firms (0-9 employees) over total firms (%),
average 2012-13 -0.036 0.07 av_sh_micro_201213*ndistretti -0.052** Chi-squared 137.837* ** 139.236* ** 146.35** * 147.48** * 139.396* ** 140.636* ** 146.477** * 155.525** * df 11 12 11 12 11 12 11 12 LogLikelihood -850.216 -849.517 -845.959 -845.395 -849.437 -848.817 -833.161 -828.637 chibar(01) 0.075*** 0.076*** 0.08*** 0.08*** 0.076*** 0.077*** 0.081*** 0.086*** Pseudo-R-squared 101 101 101 101 101 101 100 100
* p<0.05, ** p<0.01, *** p<0.001
Negative binomial regression estimates on the effect of European public expenditure for new firm formation. The dependent variable is the number of new firms established in province p in 2014. The likelihood ratio test at the bottom of the analysis (chibar2(01)) is a test of the over-dispersion parameter alpha. When the over-dispersion parameter is zero the negative binomial distribution is equivalent to a poisson distribution. In our regression, alpha is always significantly different from zero (Prob>=chibar2 = 0.000) and thus reinforces one last time that the poisson distribution was not appropriate.
We find that public spending has a positive and significant effect on new firm formation in local economies7.
As for the role of economic structure (firm size), the results of equation (3) and (5) suggest that the influence of large firms is positive and highly significant (99%), while the effect of small firms is negative and significant at the 95%. In particular, the different sign of the coefficients suggest that a local economy dominated by large firms fosters new firm formation (equation (3)) while a small-scale economic structure hinders it (equation (5)). It is possible that the density of small firms produces a sort of saturation effect in the economy and hence where the density of these enterprises is particularly high, the likelihood that new firms are established is lower. When each of these two variables (small-scale, large-scale) are interacted with the presence of industrial districts, the coefficients turn insignificant and take an opposite sign as the main effect of the explanatory variable capturing firm size (cfr. (equations (4) and (6)).
These results suggest that the presence of large firms facilitates new firm formation possibly because of spinoff effects and the need for local suppliers. This contrasts, to some extent, with the literature which suggests a higher “fertility” of areas populated by small firms.
As we have seen the coefficients on small firms and large firms are statistically significant. Instead, the coefficient on the share of medium-sized firms is positive but not statistically significant. In this case, the coefficient associated to the interaction term with industrial districts is lower, still positive and not significant (cfr. Equation (1) and (2)).
It is worth noting that the presence of industrial districts, by itself, has a positive influence, although not significant, on new firm formation. On one side, this result might be related to the fact that our dependent variable includes firms from very different sectors (manufacturing, services). For example, Carree et al. (2008) find that industrial districts are important determinants for entry but only for manufacturing. On the other side, our results could also confirm the reduced capacity of local productive systems of small firms to generate spinoff effects in the local economy compared to previous decades. As a matter of fact, the extraordinary “fertility” of Italian industrial districts, in terms of new firm creation, came to a halt since the 90ies. Our results suggest that, in district areas, the creation of new firms is higher when combined with a strong presence of medium-sized enterprises, while it is not if the local economy is dominated by large firms. Instead the presence of industrial clusters associated with micro-enterprises does not promote entrepreneurship and the interaction term, in this case, is highly significant (equation 8). This result suggests that, the presence of small and micro-firms is not conducive to entrepreneurship by itself, and, in provinces with a substantial presence of industrial districts, the predominance of micro-firms hinder the start-up of new micro-firms.
As for the other control variables, some results are in line with the literature, some are not.
The share of young population (15-44 years old) holding a degree plays an important role. The coefficient associated to the human capital variable is positive and highly significant (99%) in all the equations. This result confirms the importance of human capital for entrepreneurship in general, that is, irrespective of the sector of activity, and not only for the formation of innovative firms, as the results in the literature usually stress.
Our results confirm that demand growth fosters entrepreneurship. The coefficient associated with the variable “average population growth 2008-2013” is positive and statistical significant at the 95% level in equations (1), (2), (5) and (6).
The density of economic activity (measured with the number of existing firms per thousand inhabitants, average 2008-2013) is positively associated with new firm formation, and the effect is significant in all equations, at least at the 95% level.
The findings on the effect of the urban environment on entrepreneurship (measured by means of: the share of active population over total population, and the immigration rate) are not conclusive. In fact, while the demographic factor (measured by the share of population between 25 and 44 years old in the province) has a prevailing negative sign, the coefficient of the immigration variable, a proxy for a diverse cultural environment, is positive.
As for the effect of unemployment, the positive sign of the coefficient on unemployment rate may support the unemployment push-hypothesis: due to the lack of job opportunities individuals tend to become self-employed therefore higher rate of unemployment increase new firm birth.
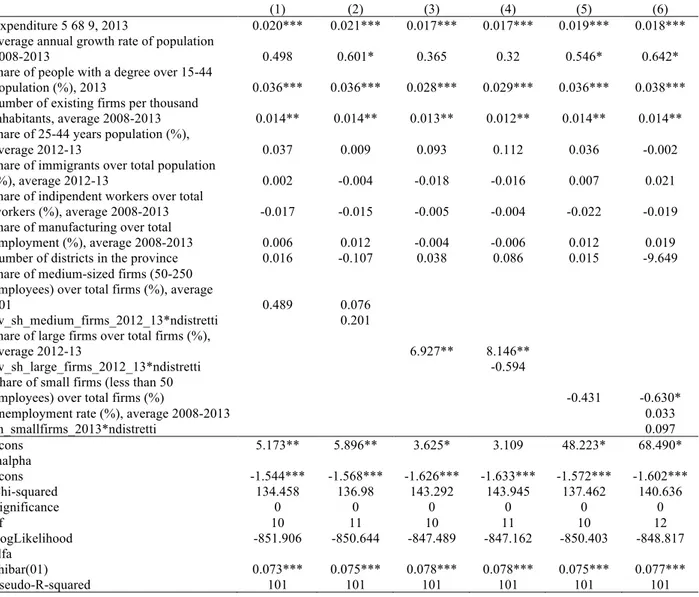
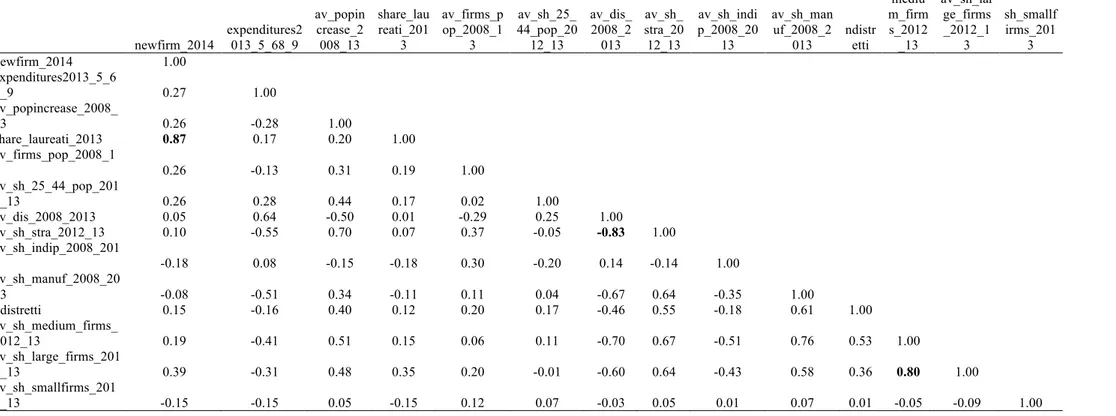
In this respect, we checked whether our results might be affected by the high correlation between unemployment rate and the incidence of immigrants (See the correlation matrix reported in the Appendix (Table A4). To avoid a possible biased result due to the high correlation between these two variables, we rerun the same regressions as in Table 2, either with only the unemployment rate (Table A2), or with only the immigration incidence (Table A3). Results do not differ considerably except that for both the coefficients associated to the unemployment rate and the immigration incidence become lower and the sign of immigration rate is now uncertain, not always positive as before.
Entrepreneurship is higher in provinces with high industrial specialisation, even if the effect is not statistically significant.
Finally, and quite surprisingly, the share of independent workers is associated with a lower number of new firms, but the effect is not statistically significant.
4.
Concluding remarks and further developments
This paper presents an empirical analysis of the effects of EU expenditure for entrepreneurship on new firm formation at the provincial level. The results show that the EU Cohesion policy has the positive, desired effect on entrepreneurship. As for the control variables, our analysis confirms previous findings of the literature on new firm formation in that we find a clear evidence for the role of human capital, demand growth and the density of economic activity. The findings of the analysis differ partially from the existing literature as regards the implications of firm size. Areas dominated by large plants are more likely to foster entrepreneurial capacity, presumably due to spin-offs and the effects on the network of suppliers. Conversely, a high importance of small firms in the local economy has a negative effect on entrepreneurial capacity, arguably because of market saturation effects and/or the fact that we focused on a period of recession. A high share of medium-sized firms has a positive relation with new firms formation, but the coefficient associated to this variable is not statistically significant. The role of various aspects of local economic structure (industry specialisation, district model, demographic factors) highlighted in the literature is less clear and may deserve further investigation.
One limitation of this study is that it does not consider the possible effects of contiguous provinces. Even if they may be limited, robustness checks will be performed in subsequent versions to control whether our results are affected by spatial autocorrelation.
5.
Bibliography
Anselin L., Varga A. and Acs Z. J. (1997) Local geographic spillovers between university research and high technology innovation, Journal of Urban Economics, 42, 422–48.
Anselin L., Varga A. and Acs Z. J. (2000) Geographic spillovers and university research: a spatial econometric approach, Growth & Change 31, 501–15.
Armington, C. And Acs, Z. (2002) The determinants of regional variation in new firm formation, Re-gional Studies 36, 33–45.
Arrighetti A., Landini F., Lasagni A. (2016), Economic crisis and firm exit: Do intangibles matter?, paper presented at the XIV Annual Workshop of the Italian Society for Industrial Economics and Policy, 5-6 February, Florence
Audretsch D. B. and Fritsch M. (1994) The geography of firm births in Germany, Regional Studies 28(4), 359–65.
Audretsch D.B., Santarelli E., Vivarelli M. 1999. Start-up size and industrial dynamics: some evidence from Italian manufacturing. International Journal of Industrial Organization, 17(7): 965–983.
Audretsch, D., Dohse D. and A. Niebuhr (2014), Regional Unemployment Structure and New Firm Formation, Kiel Working Paper No. 1924, Kiel Institute for the World Economy
Audretsch, D., Dohse, D., Niebuhr, A. 2010. Cultural Diversity and entrepreneurship: A regional analysis for Germany. The Annals of Regional Science, 45, 55–85.
Audretsch, D., Thurik, R. and others (2005) Does Self-Employment Reduce Unemployment? Discussion Paper on Entrepreneurship, Growth and Public Policy No. 07-2005. Max Planck Institute of Eco-nomics, Jena.
Cainelli G., Montresor S. , Marzetti Vittucci G. 2012. Firms’ death rate and spatial agglomeration. Evidence on the resilience of Italian local production systems. Rivista di Economia e Statistica del Territorio, 3(1): 101-126.
Caree M., Santarelli E., Verheul I. 2008. Firm entry and exit in Italian provinces and the relationship with unemployment. International Entrepreneurial Mangament Journal. 4(2): 171-186
Ciccone C. and Hall R. E. (1996) Productivity and the density of economic activity, Am. Econ. Rev. 86(1), 54–70.
Coltorti, F., Resciniti, R., Tunisini, A., Varaldo, R. (Eds.), 2013, Mid-sized Manufacturing Companies: The New Driver of Italian Competitiveness, Springer
Cross M . (1981) New Firm Formation and Regional Development. Gower, Aldershot, Hants.
Ferragina A. M., Mazzotta F. (2014), Agglomeration economies in Italy: impact on heterogeneous firms’ survival, paper presented at the International Conference On “Economics Of Global Interactions: New Perspectives On Trade, Factor Mobility And Development”, Bari (Italy), 8-9 September 2014
Fritsch M. and Mueller P. (2007), The Persistence of Regional New Business Formation Activity Over Time. Assessing the Potential of Policy Promotion Programs, Journal of Evolutionary Economics, 17, 299–315.
Garofoli, G. 1994. New Firm Formation and Regional Development: The Italian Case. Regional Studies, 28(4), 381–393.
Gudging . (1978), Industrial Location Processes and Regional Employment Growth. Saxon House, Farnborough, Hants.
Hoover M. and Vernon (1959) Anatomy ofa Metropolis, Harvard University Press, Cambridge, MA. Ismeri Europa (2016), “Geography of expenditure”, Ex post evaluation of Cohesion policy 2007-2013,
WP13, European Commission, DG Regional and urban policy.
Johannisson B. (1984) A cultural perspectives on small business – local climate, Int. Small Bus. J. 2(4), 32–43.
Karahasan (2015), Dynamics of regional new firm formation in Turkey, Review of Urban & Regional Development Studies, Volume 27, Issue 1, pages 18–39, March 2015
Karahasan B. C. (2015), Dynamics of regional new firm formation in Turkey, Review of urban & regional development studies, 27(1), 18-39
Keeble D. and Walker S. (1994) New firms, small firms and dead firms: spatial patterns and determinants in the United Kingdom, Regional Studies 28(4), 411–27.
Niebuhr, A. 2010. Migration and Innovation: Does cultural diversity matter for regional R&D activity? Papers in Regional Science 89, 563–585.
Oxenfeldt A. (1943) New Firms and Free Enterprise. American Council on Public Affairs, Washing-ton, DC.
Santarelli E., Carree, M.A. and I. Verheul (2009), Unemployment and Firm Entry and Exit: An Update on a Controversial Relationship, Regional Studies, 43(8), 1061-73
Savage M., Dickens P. And Fielding T. (1988) Some social and political implications of the contemporary fragmentation of the service class in Britain, Int. J. Urban & Reg. Research 12(3). Storey D. J. (1991) The birth of new firms – does unemployment matter? A review of the evidence, Small
Business Economics 3,167–178.
Storey D. J. and Johnson A. M. (1987) Job Generation and Labour Market Change, Macmillan, London. Storey, D. 1991. The Birth of New Firms: Does unemployment matter? A Review of Evidence. Small
Business Economics, 3, 167–178.
Storey, D. 1994. Understanding the Small Business Sector, 1st Edition, Routledge, London. Vernon. (1960), Metropolis 1985. Harvard University Press, Cambridge, MA.
APPENDIX
Table A1. List of variables
Name Description Source
newfirm_2014 Number of new firms established in the province p in 2014 Movimprese expenditures2013_5_68_9 Public expenditures supporting new firms formation (European regional development fund) WP13 study av_popincrease_2008_13 average annual growth rate of population 2008-2013 Istat share_laureati_2013
share of people with a degree over 25-44 population (%), 2013
Ministry of Education, University and Research av_firms_pop_2008_13 number of existing firms per thousand inhabitants, average 2008-2013 Istat and Movimprese av_sh_25_44_pop_2012_13 share of 25-44 years population (%), average 2012-13 Istat
av_dis_2008_2013 unemployment rate (%), average 2008-2013 Istat
av_sh_stra_2012_13
share of immigrants over total population (%), average
2012-13 Istat
av_sh_indip_2008_2013
share of indipendent workers over total workers (%),
average 2008-2013 Istat
av_sh_manuf_2008_2013 share of manufacturing over total employment (%), average 2008-2013 Istat ndistretti (no. of districts)
N. of industrial districts in the province p according to
Istat (2015) Istat
av_sh_medium_firms_2012_13
share of medium-sized firms (50-250 employees) over total number of firms (%), average 2012-13 Istat av_sh_large_firms_2012_13 share of large firms (more than 250 employees) over total number of firms (%), average 2012-13 Istat av_sh_small_firms_2012_13 Share of small firms (less than 50 employees) over total number of firms (%),average 2012-13 Istat
Table A2. The effect of EU public support on new firm formation (as Table 2, but without immigration incidence)
(1) (2) (3) (4) (5) (6)
Expenditure 5 68 9, 2013 0.017*** 0.018*** 0.015*** 0.014*** 0.017*** 0.017***
average annual growth rate of population
2008-2013 0.669** 0.708** 0.475* 0.44 0.739** 0.724**
share of people with a degree over 15-44
population (%), 2013 0.035*** 0.035*** 0.028*** 0.029*** 0.036*** 0.038***
number of existing firms per thousand
inhabitants, average 2008-2013 0.015** 0.015** 0.012** 0.012** 0.015** 0.015**
share of 25-44 years population (%),
average 2012-13 -0.028 -0.037 0.046 0.065 -0.019 -0.014
unemployment rate (%), average
2008-2013 0.048 0.041 0.044 0.047 0.031 0.028
share of indipendent workers over total
workers (%), average 2008-2013 -0.013 -0.012 -0.003 -0.002 -0.022 -0.02
share of manufacturing over total
employment (%), average 2008-2013 0.008 0.013 0 -0.003 0.017 0.020*
number of districts in the province 0.022 -0.077 0.041 0.104 0.021 -10.03
share of medium-sized firms (50-250 employees) over total firms (%), average
201 0.934 0.525
av_sh_medium_firms_2012_13*ndistretti 0.16
share of large firms over total firms (%),
average 2012-13 7.365*** 9.003***
av_sh_large_firms_2012_13*ndistretti -0.76
Share of small firms (less than 50
employees) over total firms (%) -0.439* -0.640*
sh_smallfirms_2013*ndistretti 0.101 _cons 6.063*** 6.423*** 4.255* 3.697* 50.031* 69.906* lnalpha _cons -1.573*** -1.588*** -1.655*** -1.665*** -1.586*** 1.599*** -Chi-squared 137.51 139.104 146.35 147.453 138.94 140.286 Significance 0 0 0 0 0 0 df 10 11 10 11 10 11 LogLikelihood -850.38 -849.582 -845.96 -845.408 -849.664 -848.992 alfa chibar(01) 0.075 0.076 0.08 0.08 0.076 0.076 Pseudo-R-squared 101 101 101 101 101 101 * p<0.05, ** p<0.01, *** p<0.001
Table A3. The effect of EU public support on new firm formation (as Table 2, but without unemployment rate)
(1) (2) (3) (4) (5) (6)
Expenditure 5 68 9, 2013 0.020*** 0.021*** 0.017*** 0.017*** 0.019*** 0.018***
average annual growth rate of population
2008-2013 0.498 0.601* 0.365 0.32 0.546* 0.642*
share of people with a degree over 15-44
population (%), 2013 0.036*** 0.036*** 0.028*** 0.029*** 0.036*** 0.038***
number of existing firms per thousand
inhabitants, average 2008-2013 0.014** 0.014** 0.013** 0.012** 0.014** 0.014**
share of 25-44 years population (%),
average 2012-13 0.037 0.009 0.093 0.112 0.036 -0.002
share of immigrants over total population
(%), average 2012-13 0.002 -0.004 -0.018 -0.016 0.007 0.021
share of indipendent workers over total
workers (%), average 2008-2013 -0.017 -0.015 -0.005 -0.004 -0.022 -0.019
share of manufacturing over total
employment (%), average 2008-2013 0.006 0.012 -0.004 -0.006 0.012 0.019
number of districts in the province 0.016 -0.107 0.038 0.086 0.015 -9.649
share of medium-sized firms (50-250 employees) over total firms (%), average
201 0.489 0.076
av_sh_medium_firms_2012_13*ndistretti 0.201
share of large firms over total firms (%),
average 2012-13 6.927** 8.146**
av_sh_large_firms_2012_13*ndistretti -0.594
Share of small firms (less than 50
employees) over total firms (%) -0.431 -0.630*
unemployment rate (%), average 2008-2013 0.033
sh_smallfirms_2013*ndistretti 0.097 _cons 5.173** 5.896** 3.625* 3.109 48.223* 68.490* lnalpha _cons -1.544*** -1.568*** -1.626*** -1.633*** -1.572*** -1.602*** Chi-squared 134.458 136.98 143.292 143.945 137.462 140.636 Significance 0 0 0 0 0 0 df 10 11 10 11 10 12 LogLikelihood -851.906 -850.644 -847.489 -847.162 -850.403 -848.817 alfa chibar(01) 0.073*** 0.075*** 0.078*** 0.078*** 0.075*** 0.077*** Pseudo-R-squared 101 101 101 101 101 101
Table A4. Correlation matrix newfirm_2014 expenditures2 013_5_68_9 av_popin crease_2 008_13 share_lau reati_201 3 av_firms_p op_2008_1 3 av_sh_25_ 44_pop_20 12_13 av_dis_ 2008_2 013 av_sh_ stra_20 12_13 av_sh_indi p_2008_20 13 av_sh_man uf_2008_2 013 ndistr etti av_sh_ mediu m_firm s_2012 _13 av_sh_lar ge_firms _2012_1 3 sh_smallf irms_201 3 newfirm_2014 1.00 expenditures2013_5_6 8_9 0.27 1.00 av_popincrease_2008_ 13 0.26 -0.28 1.00 share_laureati_2013 0.87 0.17 0.20 1.00 av_firms_pop_2008_1 3 0.26 -0.13 0.31 0.19 1.00 av_sh_25_44_pop_201 2_13 0.26 0.28 0.44 0.17 0.02 1.00 av_dis_2008_2013 0.05 0.64 -0.50 0.01 -0.29 0.25 1.00 av_sh_stra_2012_13 0.10 -0.55 0.70 0.07 0.37 -0.05 -0.83 1.00 av_sh_indip_2008_201 3 -0.18 0.08 -0.15 -0.18 0.30 -0.20 0.14 -0.14 1.00 av_sh_manuf_2008_20 13 -0.08 -0.51 0.34 -0.11 0.11 0.04 -0.67 0.64 -0.35 1.00 ndistretti 0.15 -0.16 0.40 0.12 0.20 0.17 -0.46 0.55 -0.18 0.61 1.00 av_sh_medium_firms_ 2012_13 0.19 -0.41 0.51 0.15 0.06 0.11 -0.70 0.67 -0.51 0.76 0.53 1.00 av_sh_large_firms_201 2_13 0.39 -0.31 0.48 0.35 0.20 -0.01 -0.60 0.64 -0.43 0.58 0.36 0.80 1.00 av_sh_smallfirms_201 2_13 -0.15 -0.15 0.05 -0.15 0.12 0.07 -0.03 0.05 0.01 0.07 0.01 -0.05 -0.09 1.00