1
An NMR-based metabolomics approach reveals a
combined-biomarkers model in a wine interventional trial with validation
in free-living individuals of the PREDIMED study
Rosa Vázquez-Fresno1,2, Rafael Llorach1,2*, Mireia Urpi-Sarda1,2, Olha Khymenets1,2, Mònica Bulló3,4, Dolores Corella4,5,Montserrat Fitó4,6, Miguel Angel Martínez-González 4,7, Ramon
Estruch4,8, Cristina Andres-Lacueva1,2* 1
Biomarkers and Nutrimetabolomic Lab. Nutrition and Food Science Department, XaRTA, INSA, Torribera Campus, Pharmacy Faculty, University of Barcelona, Av. Joan XXIII s/n, 08028 Barcelona, Spain. 2INGENIO-CONSOLIDER Program, Fun-C-Food CSD2007-063, Ministry of Science and Innovation, Barcelona, Spain.3Human Nutrition Unit, Biochemistry and Biotechnology Department and Hospital Universitari de Sant Joan de Reus, Institut d‘Investigació Sanitària Pere Virgili, Universitat Rovira I Virgili, Reus, Spain. 4
CIBER Fisiopatologia de la Obesidad y Nutrición (CIBERobn), Instituto de Salud Carlos III, Madrid, Spain. 5Department of Preventive Medicine and Public Health, University of Valencia, Valencia, Spain. 6Cardiovascular Epidemiology Unit, Municipal Institute for Medical Research (IMIM), Barcelona, Spain. 7Department of Preventive Medicine and Public Health, University of Navarra, Pamplona, Spain.8Department of Internal Medicine, Hospital Clinic, Institut d’Investigacions Biomèdiques August Pi Sunyer (IDIBAPS), Barcelona, Spain.
*Correspondence: Cristina Andres-Lacueva, [email protected]; and Rafael Llorach,
[email protected]. Nutrition and Food Science Department, Pharmacy Faculty, University of Barcelona, Av. Joan XXIII s/n, 08028 Barcelona, Spain. Phone:+34.934034840. Fax:+34.934035931
Abbreviated title: NMR approach to determine wine exposure biomarkers
ABSTRACT
The development of robust biomarkers of consumption would improve the classification of participants with regard to their dietary exposure. In addition, validation of them in free-living individuals remains an important challenge. The aim of this study is to assess wine intake biomarkers using an NMR metabolomic approach to measure the utility of these biomarkers in a wine interventional study (WIS, n=56) and also to evaluate them in a free-living individuals (PREDIMED study, n=91). Nine metabolites showed a significantly higher presence in urinary excretion in the WIS after wine intake: five food metabolome metabolites (tartrate, ethyl glucuronide [EtG], 2,3-butanediol, mannitol, and ethanol); one related to the endogenous response to wine exposure (3-methyl-2-oxovalerate) and three unidentified compounds. Receiver operating characteristic (ROC) curve for each single metabolite were evaluated and exhibited areas under the curves (AUC) between 67.4% - 86.3% when they were evaluated individually. Then, a logistic regression model was fitted to generate a combined-biomarkers model using these metabolites. The model generated which included tartrate-EtG, showed an AUC of 90.7% in WIS. Similarly, the AUC in the PREDIMED study, the biomarker model was 92.4%. Results showed that a model combining tartrate-EtG is more useful for evaluating exposure to wine than single biomarkers, both in interventional studies and epidemiological data. To our knowledge, this is the first time that a combined-biomarker model using an NMR platform in wine biomarkers’ research has been generated and reproduced in a free-living population.
2
Keywords: biomarkers, nutrimetabolomics, NMR, wine, interventional study, cohort
study.
Introduction
The food metabolome is very complex and variable and could constitute an extremely useful source of information on the human diet Accurate characterization of the food metabolome should allow precise monitoring of dietary exposure and identification of foods that influence disease risk (Scalbert et al., 2014). Nowadays, evaluation of food intake is a big challenge, particularly if the relation between diet and health is taken into consideration. In this context, the moderate wine intake included in the Mediterranean food pattern has been related to some health benefits (Estruch, 2000). In addition, wine is of special interest in Mediterranean countries because it is a common constituent of the daily pattern of Mediterranean diets. Therefore, in the biomarker research field, studies testing biomarker exposure conducted in countries with a regular wine intake are an interesting focus for research.
Metabolomics offers a conceptual breakthrough for biomarker discovery (Pujos-Guillot et al., 2013). NMR is a robust technique for metabolomic applications enabling the simultaneous detection of a wide range of structurally different metabolites. As it is a non-hypothesis-driven approach, this enables new biomarkers to be discovered in the field of food research (O'Sullivan et al., 2011). Several studies apply metabolomic approaches to identify novel dietary biomarkers (Llorach et al., 2012), while the number of metabolomics studies that use an ROC curve procedure is still very limited (<2% in the last 10 years) (Xia et al., 2013), and only a few are applied in food biomarker research (Lloyd et al., 2013). To date, robust NMR-based metabolomics has rarely been applied to identify new biomarkers of wine intake. However, two metabolomics studies have evaluated a mix of red wine and red grape juice extracts to assess the wine polyphenols in humans subjected to microbial metabolism by NMR analysis (Jacobs et al., 2008; van Dorsten et al., 2010).
Traditionally, in nutrition a single biomarker has been used to define exposure to complex foods (e.g., red wine) or complex dietary patterns in interventional trials and/or a free-living population. However, in clinical research, the evaluation of a combination of several biomarkers by a logistic regression model is frequently applied. For instance, Hwa and co-workers demonstrated that a combination of more than one biomarker with a logistic regression model can improve the predictive sensitivity of breast cancer and lymph node metastatic status (Hwa et al., 2008). The goal of biomarker development in metabolomics is to create a predictive model from a collection of multiple compounds, which can be used to classify individuals into specific groups with optimal sensitivity and specificity (Xia et al., 2013). All this suggests a change in biomarker discovery research conventionally focused on a single biomarker, shifting towards a combination of biomarkers to assess dietary exposure.
A few limited studies have been carried out to determine biomarkers of wine consumption in human individuals, reporting gallic acid, 4-O-methylgallic acids (Mennen et al., 2006), caffeic acid (Simonetti et al., 2001) and catechins (Donovan et al., 2002) as biomarkers of wine intake in interventional studies, with only resveratrol and resveratrol metabolites assessed in epidemiological data (Zamora-Ros et al., 2009). Moreover, procyanidin metabolites derived from the microbiota are well described after wine polyphenol intake (Gonthier et al., 2003). In this context, human gut microbiota variability and the presence in other procyanidin dietary sources such as green tea (Roowi
3 et al., 2009), cocoa products (Urpi-Sarda et al., 2009b) or almond skin (Bartolomé et al., 2010; Urpi-Sarda et al., 2009a), increase the variability between subjects and decrease the specificity of these metabolites as candidate biomarker of wine intake.
The purpose of the present study is to identify wine intake biomarkers in the context of a Mediterranean wine interventional study using the robust and reproducible 1H-nuclear magnetic resonance spectroscopy analysis, and subsequently measure the utility of these biomarkers by evaluating them in a free-living independent Mediterranean sub-cohort.
Materials and Methods
Subjects and Study design
Wine interventional study (WIS). Wine intervention study was a prospective, randomized,
crossover and controlled trial (Chiva-Blanch et al., 2012). High-risk subjects aged ≥55 years without documented CHD (CHD: ischemic heart disease—angina/recent or past myocardial infarction/previous or cerebral vascular accident, peripheral vascular disease) were recruited for the study. The subjects included had diabetes mellitus or more than three of the following CHD risk factors: tobacco smoking, hypertension, hypercholesterolemia, plasma LDL cholesterol ≥160 mg/dL, plasma HDL cholesterol <40 mg/dL, obesity (BMI (in kg/m2) ≥30), and/or a family history of premature CHD (first-line male relatives <55 years or females <65 years). Participants had to voluntarily give signed informed consent. Subjects with a previous history of CVD, any severe chronic disease, alcoholism, or other toxic abuse were excluded. The study was a prospective, randomized, crossover, and controlled trial. As a result of random computer-generated selection, participants were asked to take either, 272mL/day of red wine (hereafter, RWA) (about 30g ethanol/day), 272mL/day of dealcoholized red wine (hereafter, RWD, polyphenols control), or 100mL/day of gin (hereafter, GIN, alcohol control), every day for 4 weeks (28 days). Twenty-four-hour urine samples were collected on the last day of each period as well as the basal time. All participants received all three interventions. To fulfil the objectives of the present study, we evaluated the urinary metabolome modifications from 56 participants between baseline and after 28 days of red wine intake, analysed by 1H-NMR spectroscopy.
PREDIMED sub-cohort study. A random subsample of participants in the PREDIMED
study was used to test the WIS results. The PREDIMED study is a parallel-group, single-blind, multicentre, randomized, controlled, 5-year feeding trial assessing the effects of the Mediterranean diet (MD) supplemented either with EVOO (MD+EVOO) or mixed nuts (MD+Nuts) on the primary prevention of CHD compared to advice on a low-fat diet (LFD). The participants from the present study had between 53 and 79 years of age and fulfilled more than three cardiovascular risk factors (current smoking, hypertension, hypercholesterolemia, body mass index (BMI) ≥25 kg/m2, or a family history of premature cardiovascular disease). Exclusion criteria were type 2 diabetes mellitus, cardiovascular disease, any severe chronic illness, drug or alcohol addiction, history of allergy, or intolerance to olive oil or nuts. The sub-cohort consisted of a random sample of 205 participants at high cardiovascular risk, recruited from the Barcelona and Valencia PREDIMED centres. Urinary metabolome was analysed at baseline (before to start the dietary intervention). The PREDIMED study design and 137-item validated food frequency questionnaire used have been reported elsewhere (Estruch et al., 2006; Estruch et al., 2013; Fernández-Ballart et al., 2010). Data reported included information on
4 drinking habits, such as amount, frequency and type of alcohol intake. The question ―how long ago did you consume your last glass of wine?‖ was also asked.
Untargeted 1-NMR metabolomics analysis.
Wine interventional study (WIS). A procedure based on previous published methodology
(Vázquez-Fresno et al., 2012) was applied for the metabolomics analysis. The urine samples were thawed, vortexed, and centrifuged at 13 200 rpm for 5 min. The supernatant (600 µl) from each urine sample was mixed with an internal standard solution (120 µL, consisting of 0.1% TSP (3-(trimethylsilyl)-proprionate-2,2,3,3-d4, chemical shift reference), 2 mM of sodium azide (NaN3, bacteriostatic agent), and 1.5M KH2PO4 in
99% deuterium water (D2O)).
PREDIMED sub-cohort study. Briefly, the initial volume of urine from the sub-cohort
study participants was 300 µl of urine sample diluted with 200 µl of H2O/D2O (8:2) and
mixed with the internal standard solution. (120 µL, consisting of 0.1% TSP (3-(trimethylsilyl)-proprionate-2,2,3,3-d4, chemical shift reference), 2 mM of sodium azide (NaN3, bacteriostatic agent), and 1.5M KH2PO4 in 99% deuterium water (D2O)).
For both studies, the optimized pH of the buffer was set at 7.0, with a potassium deuteroxide (KOD) solution, to minimize variations in the chemical shifts of the NMR resonances. Mixture was transferred to a 5-mm NMR tube. The spectral data processed were intelligent bucketed in domains of 0.005 ppm (Sousa et al., 2013) and integrated using ACD/NMR Processor 12.0 software (Advanced Chemistry Development, Inc.). The spectral region between 4.75 and 5.00 ppm was excluded from the data set to avoid spectral interference from residual water. Significant unassigned compounds were further characterized using 2-D NMR experiments in 600 MHz Bruker Avance III: a previous
1
H-NMR experiment, followed by a1H-1H homonuclear 'H/'H correlation spectroscopy (COSY) experiment. The 1H-NMR experiment was processed with 128 scans with a spectral width of 14 ppm, an acquisition time of 3.2 s and a relaxation delay of 3 s. In the COSY analysis, 512 x 1024 data points were collected and processed in a 1024 x 1024 matrix using 48 scans per increment, a relaxation delay of 1.1s, an acquisition time of 0.16s and 16 dummy scans. To exclude data points showing little variance across experimental conditions, data were interquartile range (IQR) filtered, and row-wise normalized by sum to reduce systematic bias during sample collection (Xia and Wishart, 2011).
Metabolite identification.
Discriminant metabolites were identified using the Chenomx NMR Suite 7.5 (Chenomx Inc., Edmonton, Canada) library, by comparing NMR spectral data to those available in databases such as the Human Metabolome Database (HMDB; www.hmdb.ca), the Biological Magnetic Resonance Data Bank (BMRB, www.bmrb.wisc.edu) and the Madison Metabolomics Consortium Database (MMCD, mmcd.nmrfam.wisc.edu).
Classification of the free-living population in the cohort study in terms of wine intake.
The population from the cohort study (n=205) was stratified using food frequency questionnaires (FFQs) for non-wine consumers (0ml/d, n=69), intermittent wine consumers (<180 ml/d, n=87) and wine consumers (≥180ml/d, n=22), based on a daily
5 wine intake (Teissedre and Landrault, 2000). Wine consumers concern individuals that were drinking red, white, rosé or Muscat wine. No sparkling wines were considered. Non-wine consumers that drink other kinds of alcohol-containing beverages were excluded from the study (n=27). Besides, the intermittent wine consumers were not considered for the assessment of biomarkers of wine intake. Alcohol intake was assessed at baseline with a validated 137-item semi-quantitative food-frequency questionnaire (FFQ). In the validation study for the Spanish version of this questionnaire, the intra-class correlation coefficient between alcohol intake from the FFQ and repeated food records was 0.82 (Fernández-Ballart et al., 2010). The use of FFQ in metabolomics (Menni et al., 2013)and the stratification of the cohort individuals by consumption is reported as being an effective strategy for discovering sensitive biomarkers of consumption (Pujos-Guillot et al., 2013).
Because very few participants consumed wine on a daily basis, a skewed consumption frequency pattern emerged (Lloyd et al., 2013), resulting in a different number of samples in the sub-cohort study tested for each group. In this context, the receiver operating characteristic (ROC) curve is a non-parametric measure of biomarker utility and there is no need for the two distributions to have an equal number of individuals and equal variance (Xia et al., 2013). In the analysis of the last time of drinking wine, the population analysed were participants who consumed their last glass of wine the day before (n=53), between 2 and 3 days before (n=14), and up to 3 days (n=15) among the wine consumers group (n=69). Each group was compared individually with the non-wine consumers group.
Statistical analysis of potential biomarkers.
The Mann-Whitney U test was used to explore differences in the NMR data to compare baseline and wine intake periods in the WIS, and in PREDIMED sub-cohort consumers and non-consumers. Significant metabolites from WIS study which were tested in ROC curve analysis were those previously found (Vázquez-Fresno et al., 2012) and those significant after Bonferroni correction. ROC curves for each metabolite that was statistically significant were calculated (each ROC curve was constructed using a dichotomous variable of wine consumption).Then, a logistic regression model was generated by forward stepwise selection procedures as previously described (Bahado-Singh et al., 2012; Murabito et al., 2009). The area under the curve (AUC) was calculated and used to assess the adequacy of the prediction model in the WIS. Then, this model was evaluated in the sub-cohort PREDIMED study with the subsequent ROC analysis to test the accuracy of the model in the free-living population. Spearman’s rank correlation coefficient was calculated to estimate correlations between wine intake from FFQ and the combined model. The Mann-Whitney test was also applied in the analysis of ―last time of drinking wine‖ among the groups of consumers and the non-consumers. Mann-Whitney U test analysis and a logistic regression model were conducted using SPSS 20 and statistical significance was set at p<0.05. AUC in ROC curve and p-value resulting from comparing AUCs were calculated with the pROC package from www.r-project.org (Robin et al., 2011).
Results and Discussion
Descriptive baseline characteristics of the participants from both studies are summarized in Online Resource 1. Composition of wine provided for WIS study is detailed in Online
6
Table 1. Significant metabolites resulting from the analysis comparing the baseline values and the values after red wine intake (WIS study;
n=56) and PREDIMED sub-cohort (epidemiological data, n=91) with the Mann-Whitney statistical test1.
Biomarker
NMR assignment WIS PREDIMED
Sub-cohort Metabolite information
δ 1 H-1H COSYa P P EtG 1.24 (t, J=7.10Hz) 4.48 (d, J=7.97Hz) - 3.40x10⁻¹¹ 5.84x10⁻⁹ Ethanol metabolite (FM)
Tartrate 4.35 (s) - 7.43x10⁻¹¹ 6.86x10⁻⁸ Wine compound (FM)
Ethanol 1.19 (t, J=7.05Hz) - 2.97x10⁻⁶ 0.008 Compound of alcohol-containing
beverages (FM)
2,3-butanediol 1.15 (d, J=5.90Hz) - 1.15x10⁻⁶ 0.004 Wine compound (FM)
3-methyl-2-oxovalerate 1.10 (d, J=6.36Hz) - 1.45x10⁻⁴ 0.002 Branched-chain amino acid metabolites Mannitol 3.69 (dd, J=6.27Hz, 11.93Hz) - 0.001 0.006 Wine compound (FM) U1 1.26 (t, J=7.21Hz) 4.171 1.37x10⁻⁶ 7.24x10⁻⁶ - U2 0.85 (d, J=6.80Hz) 1.863 3.42x10⁻⁶ 0.009 - U3 0.92 (d, J=6.58Hz) 1.867 1.42x10⁻⁵ 0.01 - 1
EtG: ethyl glucuronide; FM: food metabolome; δ: chemical shift, in parenthesis multiplicity and J-coupling. P<0.05 in Mann-Whitney test .a2D analysis from unidentified compounds. U: unassigned compound; WIS: wine interventional study, d: doublet; t: triplet; s: singlet, J= J-coupling
7
Detection of potential wine intake biomarkers.
Statistically significant metabolites evaluated at baseline and after consumption of wine in the WIS study were food metabolome biomarkers related to wine (tartrate, ethyl glucuronide, 2,3 butanediol, alcohol and mannitol), the endogenous metabolite 3-methyl-2-oxovalerate, and three unidentified compounds (U1, U2, U3). Two metabolites previously described associated with dealcoholized wine (Vázquez-Fresno et al., 2012) and derived from gut microbiota were hippurate and 4-hydroxyphenylacetate. These two metabolites were also tested with wine versus baseline participants showing no significant association after logistic regression analysis (p>0.05). Significant metabolites comparing the baseline values and the values after the intake of red wine in WIS (crossover intervention, n=56), and in the PREDIMED sub-cohort (epidemiological data, n=91), are presented in Table 1.
The subsequent ROC curve analysis for each single metabolite revealed the best AUC for the ethyl glucuronide (EtG) (AUC=86.3%) and tartrate (AUC=85.7%) metabolites, followed by 2,3-butanediol (AUC=76.7%), ethanol signal (AUC=75.6%)and the unassigned metabolites U1 (AUC=76.5%), U2 (AUC=75.4%) and U3 (AUC=73.8%), 3-methyl-2-oxovalerate (AUC=70.8%) and mannitol (AUC=69.9%). Sensitivity and specificity in each case were also determined (Online Resource 3).
Combined biomarkers model in the wine intake study.
Subsequently, to achieve greater accuracy with the potential wine biomarkers, the significant metabolites in the WIS study were subjected to a forward logistic regression analysis to create a model in order to optimally allocate each individual as a wine/non-wine intake subject. The resulting model included tartrate and EtG biomarkers of wine/non-wine intake. The ROC curves for tartrate and EtG within the model and separately are presented in Figure 1.
Fig. 1 Receiver operating
characteristic (ROC) curve analysis comparing the combined metabolite model to models for each metabolite alone, in the intervention WIS study after wine consumption. Area under the curve (AUC) is calculated for each case
8
Combined biomarkers model in the PREDIMED sub-cohort study.
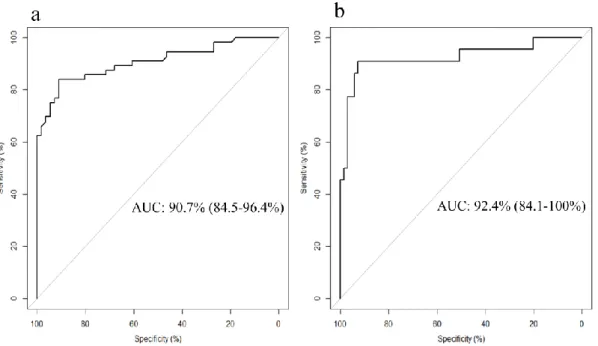
To assess the reproducibility our experimental findings, the resulting model for potential biomarkers of wine intake was tested in the sub-cohort of the PREDIMED study. A significant correlation of daily wine intake reported in PREDIMED study and the combined model (r=0.6, p<0.001) was observed. The result of the ROC curve analysis in this case, was a comparable and slightly greater AUC with very similar sensitivity and specificity to those obtained in the WIS. The ROC curves for the logistic regression in the WIS and the prediction of consumers and non-consumers from the free-living population are presented in Figure 2. The equation generated from the logistic regression and the AUCs from both the model in the WIS and the PREDIMED study with their sensitivity and specificity are shown in Table 2. A comparison between the curves was also made, and the results exhibited no statistical differences (p=0.7) between the both ROC curves. The similar AUC curve for both studies could be explained by the similar consumption of wine among the participants for both studies. The mean ± SD reported consumption of daily wine consumers (n=22) in the PREDIMED study was 343.07 ± 139.41 ml, while the WIS study participants’ consumption was fixed at 272ml/day. Figure 3 shows the distribution by boxplot analysis and the statistical significance of the metabolites that generated the model comparing both studies.
Fig. 2 Receiver operating characteristic (ROC) curve analysis using model (a) in the
intervention WIS study, and applying the same model to the PREDIMED sub-cohort study (b), with the AUC (CI) discriminating between wine consumers and non-wine consumers. Comparison between both curves, p=0.7
9
Table 2.Metabolites included in the logistic classification model from the Mann-Whitney
test1.
Regression model AUC (95% CI) Sensitivity (%) Specificity (%)
Intervention study Metabolites (tartrate-EtG)a 90.7 (84.5-96.4) 83.9 91.1 Sub-cohort study Metabolites (tartrate-EtG)a 92.4 (84.1-100) 90.9 92.8 1
Equation of the model = -5.400 + (4.65x (δ EtG))+(2.315x (δ tartrate)). ametabolites included in the model. AUC: area under the ROC curve. CI: confidence interval.
Fig. 3 Box plot of urinary tartrate and ethyl glucuronide (EtG) at baseline and after wine
intake in the WIS intervention study; and in wine and non-wine consumers from the sub-cohort PREDIMED study.*p<0.001
The additional information concerning to the last time that the participants consumed wine before urine collection (1day, between 2 and 3days and >3days), and the results of combined wine biomarkers (tartrate-EtG) comparing wine consumers and non-wine consumers, are presented in Figure 4. Statistically significant were the participants who had their last drink of wine one day before (1day) the urine collection (p=4x10-11) and between the second and third day (2-3days) (p=0.01), both compared with the non-wine consumers group. No differences were shown between non-wine consumers and consumers whose last glass of wine was reported more than 3 days before. Therefore, using these data the applied methodology could allow the detection of wine consumers up to 3 days after the last glass of wine consumed.
10
Fig. 4 Combined wine biomarkers model (tartrate-EtG) comparing consumers that
consume their last glass of wine 1 day, between 2 and 3 days, and more than 3 days before the urine collection, between the non-wine consumers in the PREDIMED sub-cohort. *Mann-Whitney test (p<0.01)
Biomarkers associated with wine exposure and classification of wine consumers in
both WIS and PREDIMED studies
The obtained results showed that several metabolites, both exogenous (food metabolome) and endogenous, were associated with wine consumers. Tartrate, 2,3-butanediol, ethanol, ethyl glucuronide and mannitol are described compounds present in wine (Liu, 2002; Son et al., 2009; Son et al., 2008), while 3-methyl-2-oxovalerateis a product of degradation of branched-chain amino acids. Elsewhere, in a previous work conducted by our group, hippurate and 4-hydroxyphenylacetate were significantly associated with consumers of dealcoholized wine (Vazquez-Fresno et al. 2012). This fact suggests a possible impact of ethanol on the metabolic pathways related to the excretion of both compounds.
With regard to the AUC curves, the results show that wine and non-wine consumers can be classified with good accuracy using a combination of two biomarkers. One of them, tartrate, is the major acid in grapes and is also present in wine (Son et al., 2008). Even though tartrate is also used in the food industry as an additive (Bemrah et al., 2012), the amount present in wine is considerably higher (2-8g/L) in red wine (Pérez-Magariño and González-San José, 2004), white wine (Darias-Mart n et al., 2000; López-Tamames et al., 1996; Recamales et al., 2006), rosé (Salinas et al., 2005) and Muscatel wines (Roussis et al., 2005). In addition, some human studies have detected tartrate in urine after wine consumption (Heinzmann et al., 2011; Vázquez-Fresno et al., 2012). The other metabolite present in the model, ethyl glucuronide, is a metabolite of ethanol and has received much
11 recent attention as a sensitive and specific biological marker of acute ethanol consumption after intake of alcoholic beverages (Lande and Marin, 2013). In addition, the results demonstrated the good accuracy of the classification of wine consumers, in spite of including non-wine consumers who drink other kinds of alcohol-containing beverages in the non-consumer group.
The combination of tartrate and ethyl glucuronide exhibited good accuracy in interventional data. Furthermore, our analysis of the epidemiological data showed good classification of wine consumers reported from the FFQs and confirmed by NMR urinary biomarker excretion. These results are in line with those published by Zamora-Ros et al.(Zamora-Ros et al., 2009) using an LC-MS/MS targeted approach. The authors showed that using resveratrol metabolites, instead of single resveratrol, could increase the ability to discriminate between wine consumers and non-wine consumers (Zamora-Ros et al., 2009). Compared with NMR-based metabolomics studies, potential biomarkers of citrus consumption were evaluated in an interventional as well as in an epidemiological assay (Heinzmann et al., 2010), showing similar results in terms of accuracy to the model currently being used for wine intake.
The use of the modelling process
With regard to the modelling process, several studies have used this approach in metabolomics-based clinical biomarker investigation, obtaining a variety in terms of the number of biomarkers included. An NMR-based study on epithelial cancer detection (Odunsi et al., 2005) had a perfect-fitting model with an AUC=1.0 combining two signals. In this context, Bahado-Singh et al.(Bahado-Singh et al., 2012) reported that with three metabolites cases can be distinguished from controls. Altogether, these findings demonstrate that there are several results on combining biomarkers in a model, although it is important to find the simplest combination of metabolites that can produce a proper effective outcome (Xia et al., 2013). The development of robust food biomarkers has important goals aimed at providing better classification of individuals in terms of dietary exposure(Garcia-Aloy et al., 2014), and in turn this would improve assessment of the relationship between diet and chronic disease (O’Gorman et al., 2013).
Detection times of biomarkers from the model
The concentration of EtG in urine after a given dose of ethanol may vary considerably between, but also within, individuals as it is influenced by several factors besides the amount of alcohol consumed, such as urine dilution and time of voiding(Høiseth et al., 2007). Detection times for EtG ranging from <24h to >90h were demonstrated after alcohol ingestion depending on the ethanol ingested(Beck et al., 2007). Our data reported a mean ± SD alcohol intake in the total wine consumers of 16.92 ± 19.85 g/day with a mean ± SD 78.25 ± 13.32 kg of body weight, therefore, a mean alcohol intake of 0.22g/kg of body weight. Weinmann et al. confirmed by mass spectrometry that after 9 g of ethanol intake (0.16g/kg), EtG reached a maximum concentration at 8-10 h and is detectable over 30 h (Weinmann et al., 2004), this fact is in line with our results. Similarly other studies reported detection up to 48h (~0.5 g/kg)(Wojcik and Hawthorne, 2007)and up to 130h (~5days) in extreme cases of alcohol intoxication (Helander et al., 2009).
Tartrate is reported excreted over 24h after acute intake of grape juice (Stalmach et al., 2013). Further, Lord and co-workers reported urinary tartrate excretion after restricted tartrate intake and after ingestion of 280 mL of grape juice the day after (Lord et al., 2005). As far as we know, there are no further studies testing tartrate excretion beyond the day after its consumption. In any case, the values of the combined model of tartrate-EtG of consumers≥24h and <72h are in keeping with the kinetics results of studies
12 presented above (Helander et al., 2009; Stalmach et al., 2013; Weinmann et al., 2004; Wurst et al., 2006).
Concluding remarks
This study shows the potential for identifying wine intake biomarkers in interventional studies using an NMR-based metabolomics approach with good accuracy and reproducibility in free-living individuals. Also, these results confirm that a model combining tartrate and EtG is a better biomarker of exposure to wine than a single biomarker. Additionally, these combined wine biomarkers could be detected in urine between 2 -3 days after the last consumption of wine. To our knowledge, this is the first time that this strategy has been used with a model of combined biomarkers using an NMR-based metabolomics untargeted approach on biomarkers of wine intake. This is interesting for future studies using a robust metabolomic approach based on NMR technique to discriminate between individuals in terms of their dietary patterns in the search for new biomarkers and their association with health.
ACKNOWLEDGMENTS
Supported by the Spanish National Grants from Ministry of Economy and Competitiveness (MINECO) and cofounded by FEDER (Fondo Europeo de Desarrollo Regional): AGL2006-14228-C03-02/ALI, AGL2009-13906-C02-01, AGL2010-10084-E, the CONSOLIDER INGENIO 2010 Programme, FUN-C-FOOD (CSD2007-063), CIberOBN, as well as PI13/01172 Project, (Plan N de I+D+i 2013-2016) by ISCII-Subdirección General de Evaluación y Fomento de la Investigación. We also thank the award of 2014SGR1566 from the Generalitat de Catalunya’s Agency AGAUR. R.V.-F, O.K, M.U.-S and R. Ll. would like to thank the FPI fellowship, the ―Juan de la Cierva‖ and the ―Ramon y Cajal‖ programmes of the Spanish Government and the Fondo Social Europeo. We thank the participants for their collaboration in the study.
CONFLICT OF INTERESTS DISCLOSURE
All the authors declare no competing financial interest
COMPLIANCE WITH ETHICAL REQUIREMENTS
WIS study. The study received the ethical approval Institutional Review Board of the
Hospital Clinic of Barcelona. All participants had signed an informed consent. This trial has been registered in the Current Controlled Trials in London, International Standard Randomized Controlled Trial Number (ISRCTN88720134).
PREDIMED study. The trial protocol was conducted according to the Declaration of
Helsinki and was approved by the institutional review boards of all the centres involved. All participants had signed an informed consent. This trial has been registered in the Current Controlled Trials in London, International Standard Randomized Controlled Trial Number (ISRCTN35739639).
ABREVIATIONS
AUC: area under the curve; CI: confidence interval; COSY: correlation spectroscopy; d: doublet; EtG: ethyl glucuronide; FFQ; food frequency questionnaires; FM: food metabolome; IQR: interquartile range; J= J-coupling; m: multiplet; ROC: receiver operating characteristic; s: singlet; t: triplet; U: unassigned compound; WIS: wine interventional study;
13
Reference
Bahado-Singh, R.O., Akolekar, R., Mandal, R., et al. (2012). Metabolomics and first-trimester prediction of early-onset preeclampsia. J Matern Fetal Neonatal Med 25, 1840-1847 Bartolomé, B., Monagas, M., Garrido, I., et al. (2010). Almond (Prunus dulcis (Mill.) D.A.
Webb) polyphenols: From chemical characterization to targeted analysis of phenolic metabolites in humans. Arch Biochem Biophys 501, 124-133
Beck, O., Stephanson, N., Böttcher, M., et al. (2007). Biomarkers to disclose recent intake of alcohol: potential of 5-hydroxytryptophol glucuronide testing using new direct UPLC-tandem MS and ELISA methods. Alcohol Alcohol 42, 321-325
Bemrah, N., Vin, K., Sirot, V., et al. (2012). Assessment of dietary exposure to annatto (E160b), nitrites (E249-250), sulphites (E220-228) and tartaric acid (E334) in the French population: the second French total diet study. Food Addit Contam Part A 29, 875-885 Chiva-Blanch, G., Urpi-Sarda, M., Llorach, R., et al. (2012). Differential effects of polyphenols
and alcohol of red wine on the expression of adhesion molecules and inflammatory cytokines related to atherosclerosis: a randomized clinical trial. Am J Clin Nutr 95, 326-34
Darias-Mart n, J.J., Rodr guez, O., D az, E. and Lamuela-Raventós, R.M. (2000). Effect of skin contact on the antioxidant phenolics in white wine. Food Chem 71, 483-487
Donovan, J.L., Kasim-Karakas, S., German, J.B. and Waterhouse, A.L. (2002). Urinary excretion of catechin metabolites by human subjects after red wine consumption. Br J Nutr 87, 31-7
Estruch, R. (2000). Wine and cardiovascular disease. Food Res Int 33, 219-226
Estruch, R., Martínez-González, M.A., Corella, D., et al. (2006). Effects of a Mediterranean-style diet on cardiovascular risk factors: a randomized trial. Ann Intern Med 145, 1-11
Estruch, R., Ros, E., Salas-Salvadó, J., et al. (2013). Primary prevention of cardiovascular disease with a Mediterranean diet. N Engl J Med 368, 1279-90
Fernández-Ballart, J.D., Piñol, J.L., Zazpe, I., et al. (2010). Relative validity of a semi-quantitative food-frequency questionnaire in an elderly Mediterranean population of Spain. Br J Nutr 103, 1808-1816
Garcia-Aloy, M., Llorach, R., Urpi-Sarda, M., et al. (2014). Nutrimetabolomics fingerprinting to identify biomarkers of bread exposure in a free-living population from the PREDIMED study cohort. Metabolomics, 1-11
Gonthier, M.-P., Cheynier, V., Donovan, J.L., et al. (2003). Microbial Aromatic Acid Metabolites Formed in the Gut Account for a Major Fraction of the Polyphenols Excreted in Urine of Rats Fed Red Wine Polyphenols. J Nutr 133, 461-467
Heinzmann, S.S., Brown, I.J., Chan, Q., et al. (2010). Metabolic profiling strategy for discovery of nutritional biomarkers: proline betaine as a marker of citrus consumption. Am J Clin Nutr 92, 436-443
Heinzmann, S.S., Merrifield, C.A., Rezzi, S., et al. (2011). Stability and Robustness of Human Metabolic Phenotypes in Response to Sequential Food Challenges. J Proteome Res 11, 643-655
Helander, A., Böttcher, M., Fehr, C., Dahmen, N. and Beck, O. (2009). Detection Times for Urinary Ethyl Glucuronide and Ethyl Sulfate in Heavy Drinkers during Alcohol Detoxification. Alcohol Alcohol 44, 55-61
Høiseth, G., Bernard, J.P., Karinen, R., et al. (2007). A pharmacokinetic study of ethyl glucuronide in blood and urine: Applications to forensic toxicology. Forensic Sci Int 172, 119-124
Hwa, H.-L., Kuo, W.-H., Chang, L.-Y., et al. (2008). Prediction of breast cancer and lymph node metastatic status with tumour markers using logistic regression models. J Eval Clin Pract 14, 275-280
Jacobs, D.M., Deltimple, N., van Velzen, E., et al. (2008). (1)H NMR metabolite profiling of feces as a tool to assess the impact of nutrition on the human microbiome. NMR Biomed 21, 615-26
14 Lande, R.G. and Marin, B. (2013). A Comparison of Two Alcohol Biomarkers in Clinical
Practice: Ethyl Glucuronide Versus Ethyl Sulfate. J Addict Dis 32, 288-292
Liu, S.Q. (2002). Malolactic fermentation in wine – beyond deacidification. J Appl Microbiol 92, 589-601
Llorach, R., Garcia-Aloy, M., Tulipani, S., Vazquez-Fresno, R. and Andres-Lacueva, C. (2012). Nutrimetabolomic Strategies To Develop New Biomarkers of Intake and Health Effects. J Agric Food Chem 60, 8797−8808
Lloyd, A.J., Beckmann, M., Haldar, S., et al. (2013). Data-driven strategy for the discovery of potential urinary biomarkers of habitual dietary exposure. Am J Clin Nutr 97, 377-389 López-Tamames, E., Puig-Deu, M.A., Teixeira, E. and Buxaderas, S. (1996). Organic Acids,
Sugars, and Glycerol Content in White Winemaking Products Determined by HPLC: Relationship to Climate and Varietal Factors. Am. J Enol Vitic 47, 193-198
Lord, R.S., Burdette, C.K. and Bralley, J.A. (2005). Significance of Urinary Tartaric Acid. Clin Chem 51, 672-673
Mennen, L.I., Sapinho, D., Ito, H., et al. (2006). Urinary flavonoids and phenolic acids as biomarkers of intake for polyphenol-rich foods. Br J Nutr 96, 191-8
Menni, C., Zhai, G., Macgregor, A., et al. (2013). Targeted metabolomics profiles are strongly correlated with nutritional patterns in women. Metabolomics 9, 506-514
Murabito, J.M., Keyes, M.J., Guo, C.-Y., et al. (2009). Cross-sectional relations of multiple inflammatory biomarkers to peripheral arterial disease: The Framingham Offspring Study. Atherosclerosis 203, 509-514
O'Sullivan, A., Gibney, M.J. and Brennan, L. (2011). Dietary intake patterns are reflected in metabolomic profiles: potential role in dietary assessment studies. Am J Clin Nutr 93, 314-21
O’Gorman, A., Gibbons, H. and Brennan, L. (2013). Metabolomics in the identification of biomarkers of dietary intake. Comput Struct Biotechnol J ; 2013: Volume 4,
Odunsi, K., Wollman, R.M., Ambrosone, C.B., et al. (2005). Detection of epithelial ovarian cancer using 1H-NMR-based metabonomics. Int J Cancer 113, 782-8
Pérez-Magariño, S. and González-San José, M.L. (2004). Evolution of Flavanols, Anthocyanins, and Their Derivatives during the Aging of Red Wines Elaborated from Grapes Harvested at Different Stages of Ripening. J Agric Food Chem 52, 1181-1189
Pujos-Guillot, E., Hubert, J., Martin, J.-F., et al. (2013). Mass Spectrometry-based Metabolomics for the Discovery of Biomarkers of Fruit and Vegetable Intake: Citrus Fruit as a Case Study. J Proteome Res 12, 1645-1659
Recamales, Á.F., Sayago, A., González-Miret, M.L. and Hernanz, D. (2006). The effect of time and storage conditions on the phenolic composition and colour of white wine. Food Res Int 39, 220-229
Robin, X., Turck, N., Hainard, A., et al. (2011). pROC: an open-source package for R and S+ to analyze and compare ROC curves. BMC Bioinformatics 12, 77
Roowi, S., Stalmach, A., Mullen, W., et al. (2009). Green Tea Flavan-3-ols: Colonic Degradation and Urinary Excretion of Catabolites by Humans. J Agric Food Chem 58, 1296-1304 Roussis, I.G., Lambropoulos, I. and Papadopoulou, D. (2005). Inhibition of the decline of volatile
esters and terpenols during oxidative storage of Muscat-white and Xinomavro-red wine by caffeic acid and N-acetyl-cysteine. Food Chem 93, 485-492
Salinas, M.R., Garijo, J., Pardo, F., Zalacain, A. and Alonso, G.L. (2005). Influence of prefermentative maceration temperature on the colour and the phenolic and volatile composition of rosé wines. J Sci Food Agric 85, 1527-1536
Scalbert, A., Brennan, L., Manach, C., et al. (2014). The food metabolome: a window over dietary exposure. Am J Clin Nutr 99, 1286-1308
Simonetti, P., Gardana, C. and Pietta, P. (2001). Caffeic acid as biomarker of red wine intake. Methods Enzymol 335, 122-30
Son, H.-S., Hwang, G.-S., Kim, K.M., et al. (2009). Metabolomic Studies on Geographical Grapes and Their Wines Using 1H NMR Analysis Coupled with Multivariate Statistics. J Agric Food Chem 57, 1481-1490
15 Son, H.S., Kim, K.M., van den Berg, F., et al. (2008). 1H nuclear magnetic resonance-based metabolomic characterization of wines by grape varieties and production areas. J Agric Food Chem 56, 8007-16
Sousa, S.A.A., Magalhães, A. and Ferreira, M.M.C. (2013). Optimized bucketing for NMR spectra: Three case studies. Chemometr Intell Lab Syst 122, 93-102
Stalmach, A., Edwards, C.A., Wightman, J.D. and Crozier, A. (2013). Colonic catabolism of dietary phenolic and polyphenolic compounds from Concord grape juice. Food Funct 4, 52-62
Teissedre, P.-L. and Landrault, N. (2000). Wine phenolics: contribution to dietary intake and bioavailability. Food Res Int 33, 461-467
Urpi-Sarda, M., Garrido, I., Monagas, M., et al. (2009a). Profile of Plasma and Urine Metabolites after the Intake of Almond [Prunus dulcis (Mill.) D.A. Webb] Polyphenols in Humans. J Agric Food Chem 57, 10134-10142
Urpi-Sarda, M., Monagas, M., Khan, N., et al. (2009b). Epicatechin, procyanidins, and phenolic microbial metabolites after cocoa intake in humans and rats. Anal Bioanal Chem 394, 1545-1556
van Dorsten, F.A., Grün, C.H., van Velzen, E.J., et al. (2010). The metabolic fate of red wine and grape juice polyphenols in humans assessed by metabolomics. Mol Nutr Food Res 54, 897-908
Vázquez-Fresno, R., Llorach, R., Alcaro, F., et al. (2012). (1) H-NMR-based metabolomic analysis of the effect of moderate wine consumption on subjects with cardiovascular risk factors. Electrophoresis 33, 2345-54
Weinmann, W., Schaefer, P., Thierauf, A., Schreiber, A. and Wurst, F.M. (2004). Confirmatory analysis of ethylglucuronide in urine by liquid-chromatography/electrospray ionization/tandem mass spectrometry according to forensic guidelines. J Am Soc Mass Spectrom 15, 188-193
Wojcik, M.H. and Hawthorne, J.S. (2007). Sensitivity of commercial ethyl glucuronide (ETG) testing in screening for alcohol abstinence. Alcohol Alcohol 42, 317-320
Wurst, F.M., Dresen, S., Allen, J.P., et al. (2006). Ethyl sulphate: a direct ethanol metabolite reflecting recent alcohol consumption. Addiction 101, 204-211
Xia, J., Broadhurst, D., Wilson, M. and Wishart, D. (2013). Translational biomarker discovery in clinical metabolomics: an introductory tutorial. Metabolomics 9, 280-299
Xia, J. and Wishart, D.S. (2011). Web-based inference of biological patterns, functions and pathways from metabolomic data using MetaboAnalyst. Nat Protoc 6, 743-60
Zamora-Ros, R., Urpí-Sardà, M., Lamuela-Raventós, R.M., et al. (2009). Resveratrol metabolites in urine as a biomarker of wine intake in free-living subjects: The PREDIMED Study. Free Radic Biol Med 46, 1562-6