DO POVERTY AND ECONOMIC INEQUALITY MATTER FOR
NEONATAL MORTALITY? INTERNATIONAL COMPARISON
OF MACRO-LEVEL DETERMINISTIC PATTERNS OF
EARLY-AGE MORTALITY
Filippo Temporin1Department of Social Policy, London School of Economics and Political Science, London, UK
1. INTRODUCTION
The reduction of early-age mortality, and especially its neonatal component (first 28 days of life), represents a major challenge for health systems worldwide. Although a decrease in neonatal mortality rates (NMRs) has been observed over the last decades, the pace of decline has been slower than that of infant or child mortality. As a result, the proportion of under-five mortality occurring within the neonatal period has been gradually higher in the world, from 37% of the total in 1990 to 44% in 2013 (UNICEF et al., 2015). Figure 1 shows that this pattern has occurred in every area of the world, except in the Western Pacific (World Health Organization, 2016).
Figure 1 – Neonatal deaths as percentage of under-five mortality.
According to UNICEF (2018) data, West and Central African countries present the highest NMR in the world in 2015, with an estimate of 31.4 deaths per 1,000 live
births, followed by South Asian countries (28.9 deaths per 1,000 live births). East and Central Asian countries have the fastest pace of reduction of neonatal mortality, with, respectively, 69.0 and 64.1 % reduction between 1990 and 2015, while West and Cen-tral African countries have the slowest pace among low- and middle-income countries (35.4%). Latin American countries have a relatively low NMR (9.9 deaths per 1,000 live births) and one of the fastest pace of reduction in the world (56.2% between 1990 and 2015).
The reduction of infant mortality plays a fundamental role in triggering the de-mographic transition, and determines variation in the patterns of the transition across countries (Pozzi and Fariñas, 2015). For instance, sub-Saharan Africa had a delayed and slower mortality transition in comparison with other areas, and still have higher levels of infant mortality (Garenne and Gakusi, 2006). This pattern is also due to political crises, civil wars, and the effect of the HIV/AIDS epidemics (ibid).
Neonatal mortality has been labelled as a “hidden problem” as a result of the lack of data (Martineset al., 2005) and under-reporting in official statistics (Målqvist, 2011). For instance, there is evidence of a tendency of misreporting neonatal deaths as stillbirths, especially in countries where NMRs are an indicator of the quality of health facilities (Aleshina and Redmond, 2005). Another issue is related to the great proportion of de-liveries occurring at home, particularly in low- and middle-income countries (McClure et al., 2006); NMRs might be therefore biased in official statistics (Målqvist, 2011). A recent call for action has helped to bring international attention on neonatal mortal-ity (Lawn et al., 2005; Martines et al., 2005; Darmstadt et al., 2005). As a result, the neonatal component has been specifically targeted by Sustainable Development Goal 3.2 (Norheimet al., 2015), while only under-five mortality as a whole was mentioned in Millennium Development Goals 4 (Lozanoet al., 2011). While the socioeconomic determinants of infant and child mortality have been extensively analysed in the liter-ature, neonatal mortality requires a more detailed investigation (Neal, 2009). A large body of literature exists about the relationship between poverty and child mortality at the macro level, and a positive association between the two variables is well documented (Flegg, 1982; Preston and Haines, 2014; Pritchett and Summers, 1993). However, few studies have focused on the socioeconomic determinants of neonatal mortality. Most of the analyses using monetary measures have found a significant association with neona-tal health outcomes (Luoet al., 2004; Rip et al., 1987). There is also some evidence of a stronger association between income and post-neonatal mortality (between the age of 28 days and 12 months) than with neonatal mortality (Lawnet al., 2005; Neal, 2009; Neal and Falkingham, 2014), but evidence is still insufficient. Other studies have found house-hold income to be correlated with under-five mortality, but not with neonatal mortality (DaVanzoet al., 1983; Pebley and Stupp, 1987). Moreover, there is some evidence that not only the absolute level of wealth, but also its distribution may affect mortality out-comes (Wagstaff, 2002; Mayer and Sarin, 2005; Wilkinson and Pickett, 2006). Different effects of neonatal and post-neonatal determinants might be the reason for the different pace of decline observed in the last decades (Figure 1); economic development might have played a stronger role in tackling post-neonatal mortality (Flegg, 1982), explaining
the relative stagnation of NMRs.
This paper investigates the association between a set of national-level socioeconomic determinants and early-age mortality rates using country-level panel data. Two models including the same covariates are fitted to predict NMRs and post-neonatal mortality rates (PNMRs). The focus is on the potential different patterns of association of poverty and economic inequality with mortality between the neonatal and post-neonatal peri-ods. Aiming to study the research question: “Do poverty and economic inequality have different patterns of association with neonatal mortality and post-neonatal mortality, at the macro level?”, this paper builds on Neal and Falkingham (2014) who analysed dif-ferences in the patterns of the association between gross national income and mortality occurring in the neonatal and post-neonatal period at the macro level.
In the final part of this study, non-monetary measures of deprivation are used in-stead of the national gross domestic product, in order to evaluate their association with neonatal and post-neonatal mortality. A recent trend in the study of poverty is to use non-monetary measures of deprivation (Grosseet al., 2005). Assessing deprivation from a broader perspective and looking beyond the sole concepts of income or consumption expenditure, these indicators complement income-based measures by describing the lack of basic needs such as resources or services (Vandemoortele, 2000), since income cannot fully describe a household’s living environment (Piachaud, 1987) and can have strong variation over time (Nowatzki, 2012). The national proportions of households with ac-cess to electricity, improved water sources and improved sanitation facilities are used as measures of deprivation, thus defining deprivation as a lack of basic needs related to the housing environment.
2. SOCIOECONOMIC DETERMINANTS OF NEONATAL MORTALITY
2.1. Poverty
Poverty can be identified as an underlying cause of many neonatal deaths, due to its effect on several risk factors during the antenatal and neonatal period (Wagstaff, 2002). Un-favourable economic conditions are found to be positively associated with risk factors, acting through environmental aspects (Jain, 1985; Rutstein, 2000), nutritional depriva-tion both in mothers and children (United Nadepriva-tions Fund for Populadepriva-tionet al., 1999), maternal education (Neal, 2009), and reduced access to health care (Lawnet al., 2005). There is evidence in the literature of a stronger association between poverty and mor-tality in the post-neonatal period, than in the neonatal period. This pattern was iden-tified following analyses of the association between GDP per capita and neonatal and post-neonatal mortality, in two cross-sectional studies in low- and middle-income coun-tries (Neal, 2009; Neal and Falkingham, 2014). Other studies found a correlation be-tween household income and under-five mortality, but not with neonatal mortality in Guatemala (Pebley and Stupp, 1987), in Malaysia (DaVanzoet al., 1983), and in Egypt (Casterlineet al., 1989).
2.2. Income inequality
Few studies have assessed the association between neonatal mortality and economic in-equality, and neonatal mortality is rarely compared to mortality occurring later in life. Among the studies finding a positive relationship, Mayer and Sarin (2005) found income inequality to be associated with higher neonatal mortality in the US when controlling for a set of biodemographic and contextual variables. On the other hand, Szwarcwald et al. (2002) found a non-significant effect of income inequality on neonatal mortality in a micro-level study in Rio de Janeiro.
2.3. Alternative measures of deprivation
An interpretation of poverty in monetary terms dominates in the literature. However, measuring poverty only from the income dimension has some drawbacks. Income re-flects only short-term and transitory flows of money (Nowatzki, 2012), and is therefore unable to evaluate “the capacity of a family to maintain a particular standard of living” (Spilerman, 2000). Monetary measures might not completely reflect the environment in which people live, and the source of the monetary flow is often not taken into account (Piachaud, 1987). Moreover, expenditure does not take into consideration choices made by a consumer (Sen, 2014).
Another perspective on poverty involves the use of non-income indicators in directly measuring the functioning of households (Grosseet al., 2005). Deprivation can there-fore be considered as a lack of basic needs, such as resources or services (Vandemoortele, 2000). In general, a reduction in poverty leads to a rise in household living standards, with a commensurate improvement in access to electricity, clean water and adequate sanitation, directly impacting child and adult health (Nandyet al., 2005). At the individ-ual level, a well-known non-monetary measure is the Demographic and Health Survey wealth index, whose association with child health outcomes is found to be significant in several articles (Hillet al., 2001; Mesike and Mojekwu, 2012; Pamuk et al., 2011). The Oxford Multidimensional Poverty Index (Alkire and Santos, 2014) is another indicator belonging to this stream of literature.
The final part of this paper explores the association between early-age mortality and the non-income dimension of poverty. Three measures of deprivation have been considered: access to electricity, clean water, and improved sanitation. These variables have been considered the most significant and measurable factors that can explain the latent concept of household deprivation. They have been preferred to composite mea-sures of deprivation, such as the Demographic and Health Survey wealth index, which allows ranking of households within countries, but which is not suitable for interna-tional comparisons, being an indicator of wealth only in a specific country-year com-bination (McKenzie, 2005). The chosen variables allow identification of extremely de-prived households, lacking basic needs for a minimal living standard, and allow compar-isons over time and space. This pragmatic approach to deprivation measurement has a practical use in social policies aiming to identify and fight extreme deprivation.
• Access to electricity: The first measure of deprivation is the national proportion of households connected to electricity. This variable is related to health, since a lack of electricity forces households to depend on solid fuels for cooking and heating, which are responsible for high levels of health-damaging pollutants in-side houses (Zhang and Smith, 2007; Smithet al., 2011). Indoor air pollution is associated with neonatal and post-neonatal mortality (Bobak and Leon, 1992), and to low birth weight (Boyet al., 2002). It is also estimated to be the cause of more than half of premature deaths due to pneumonia among children under-five (World Health Organization, 2016). Moreover, it is also associated with the un-availability of light during dark hours, and of motive power.
• Access to clean water: The quality of water supply is associated with early-age mortality, due to exposure to water-borne diseases, particularly those causing di-arrhoea (Esreyet al., 1991). Moreover, clean water is related to improved personal and food preparation hygiene, and to a reduced risk of infections (Mertenset al., 1990). Access to clean water is found to be significantly associated with early-age mortality (Macinkoet al., 2006; Victora et al., 1997).
• Access to improved sanitation: The third measure of deprivation is the percent-age of a population with access to improved sanitation2. The WHO considers inadequate sanitation as the major cause of deaths from diarrhoea, together with the unavailability of clean water (World Health Organization, 2009). Improve-ments in sanitation infrastructures significantly reduced the socioeconomic dif-ferences in child mortality due to diarrhoeal diseases between the 19th and 20th centuries (Burströmet al., 2005). Less than two-thirds of the global population was estimated to have access to adequate sanitation in 2009 (ibid). Improvements in sanitation conditions are significantly associated with a reduction in neonatal and post-neonatal mortality (Jain, 1985; Rutstein, 2000).
2.4. Other socioeconomic variables
In addition to the two determinants of interest (poverty and economic inequality), also female education, expenditures on health and place of residence have been highlighted in the literature as factors affecting early-age mortality. These variables are those available at the macro level, among the determinants of neonatal mortality included in Titaley et al. (2008) and Målqvist (2011) theoretical frameworks.
The relationship between maternal education and neonatal mortality is found to be strongly negative, in high-income countries (Arntzenet al., 2007), as well as in low-and middle-income countries (Kamal, 2012). Possible explanations for the link between 2Improved sanitation includes sewage and septic systems, while open pit and surface water are
maternal education and neonatal mortality include higher knowledge regarding compli-cations, adequate access to health services, quality of feeding and household sanitation (Neal, 2009). Education can also affect newborn survival through its effect on women’s status within the household and their capability to communicate effectively with health staff (Caldwell, 1979; Karlsenet al., 2011).
The relationship between public expenditure on a health system and children’s health outcomes is not clear: while some studies reported a positive correlation (Bhalotra, 2006; Kim and Lane, 2013; Verhoevenet al., 1999), other analyses have found no significant as-sociation (Filmer, 1999; Deolalikar, 2005). Factors associated with lower neonatal mor-tality include adequate equipment (Boo and Chor, 1994), a suitable environment, avail-ability of transport (Lawnet al., 2009) and delivery at a health facility (Wall et al., 2009). Finally, urban-rural mortality differentials in early-age mortality exist in low- and middle-income countries (Van de Poelet al., 2009). Rural areas are associated with a lower probability of individuals seeking health care, due to lower access to health ser-vices in comparison with urban areas (Andersen, 2002), and cultural issues (Lalou and LeGrand, 1997; Say and Raine, 2007; Kitts and Roberts, 1996). Rural areas are likely to lack infrastructures (Andersen, 2002) , and to have limited access to electricity and clean water supply (Van de Poelet al., 2009) exposing rural populations to endemic diseases.
3. DATA AND MEASURES
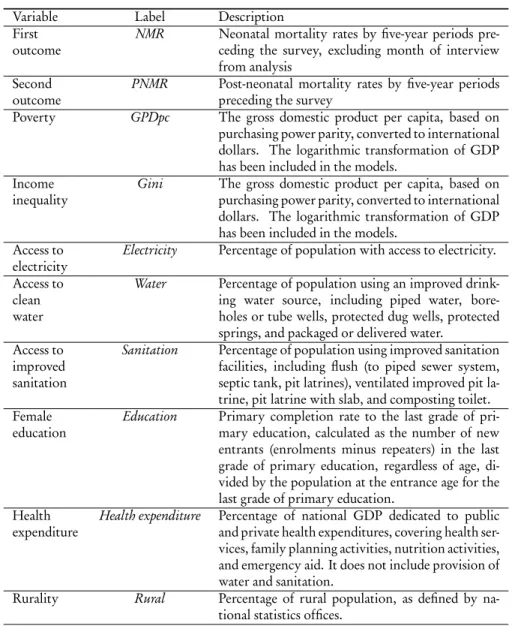
Here, country-level panel data are analysed in order to assess the association between early-age mortality and the socioeconomic determinants described above. The data are from the World Bank (2015) database. Countries were selected if their NMR in 2015 was higher than the threshold of 12 per 1000 live births, specified by Sustainable Devel-opment Goal 3.2 (Norheimet al., 2015). For each of the selected 79 countries, data from 2000, 2005, 2010 and 2015 were included. The list of selected countries is presented in Appendix A. The logarithmic transformation of the outcome variablesNMR and PNMR were carried out to obtain an approximately normally-distributed variable (the Shapiro test producedp-value< 0.01 for NMR, and p-value=0.13 for log(NMR); p-values < 0.01 and equal to 0.02 for, respectively,PNMR and log(PNMR)). Table 1 shows the list of the variables included in the models.
In addition to the socioeconomic determinants, year dummies were included in the model, since part of the temporal variation in NMR and PNMR can be explained by pe-riod effects. NMR and PNMR have experienced a decrease over the 15-year observation period in low- and middle-income countries. This trend is due to the ongoing demo-graphic transition (Mason, 2007), as well as to the fact that early-age mortality has been specifically targeted by Millennium Development Goal 4, fostering policy initiatives and investments specifically targeting under-five mortality (Murrayet al., 2007; Rajaratnam et al., 2010). Table 2 presents the descriptive statistics of the variables included in the model. As we can observe, some variables have a high proportion of missing data. A multilevel multiple imputation strategy is discussed in the next chapter.
TABLE 1 Variables and description.
Variable Label Description
First outcome
NMR Neonatal mortality rates by five-year periods pre-ceding the survey, excluding month of interview from analysis
Second outcome
PNMR Post-neonatal mortality rates by five-year periods preceding the survey
Poverty GPDpc The gross domestic product per capita, based on purchasing power parity, converted to international dollars. The logarithmic transformation of GDP has been included in the models.
Income inequality
Gini The gross domestic product per capita, based on purchasing power parity, converted to international dollars. The logarithmic transformation of GDP has been included in the models.
Access to electricity
Electricity Percentage of population with access to electricity. Access to
clean water
Water Percentage of population using an improved drink-ing water source, includdrink-ing piped water, bore-holes or tube wells, protected dug wells, protected springs, and packaged or delivered water.
Access to improved sanitation
Sanitation Percentage of population using improved sanitation facilities, including flush (to piped sewer system, septic tank, pit latrines), ventilated improved pit la-trine, pit latrine with slab, and composting toilet. Female
education
Education Primary completion rate to the last grade of pri-mary education, calculated as the number of new entrants (enrolments minus repeaters) in the last grade of primary education, regardless of age, di-vided by the population at the entrance age for the last grade of primary education.
Health expenditure
Health expenditure Percentage of national GDP dedicated to public and private health expenditures, covering health ser-vices, family planning activities, nutrition activities, and emergency aid. It does not include provision of water and sanitation.
Rurality Rural Percentage of rural population, as defined by na-tional statistics offices.
TABLE 2
Descriptive statistics and proportion of missing for country-year observations.
Variable Median Min Max Proportion missing
NMR 28.5 12.8 61.3 0 PNMR 24.8 2.6 92.0 0 GDPpc 2,470.5 419.5 33,777.3 0 Gini 42.4 16.6 63.0 83.4 Education 68.5 12.7 124.7 40.3 Health Expenditure 5.2 0.9 21.9 27.5 Rural 63.3 0.0 91.8 0.3 Electricity 42.7 0.1 100.0 25.9 Water 75.6 28.9 100.0 3.4 Sanitation 38.8 6.6 100.0 5.9 4. STATISTICAL METHODS
4.1. Multilevel multiple imputation for missing data
As seen in Table 2, the World Bank database has missing data for some variables; the variable with the largest proportion of missing values isGini (83.4 %). While the mech-anism leading to missingness is not clear, it has been assumed that these data are missing at random, implying that the value of the variable that is missing is not related to the reason behind its absence (Carpenter and Kenward, 2012).
A multilevel multiple imputation (MI) strategy has been implemented to impute missing values. Multiple imputed datasets were created, and the model of interest was fitted to each one. Parameter estimates and standard errors were obtained using Rubin’s rules (Rubin, 2004). A regression coefficient was estimated by the mean of the estimates across the imputed datasets and its standard error combines the within- and between-imputation variance. Multilevel MI takes into account the multilevel structure of data, with observations nested within countries, allowing us to obtain reliable estimates from multilevel analyses (Grundet al., 2016).
MI has been found to perform better than other approaches for missing completely at random and missing at random data when the sample size is small (Cheema, 2014), and when the proportion of missing data is high (Schafer and Graham, 2002), even up to 80 % (Lee and Huber Jr, 2011). However, it might be argued that the missing rate of the variableGini is very high. Therefore, models excluding the variable Gini have also been fitted. The significance of the association between the other covariates and the outcome was not affected by the imputation of values ofGini (results in Appendix B).
The first step of MI is to specify the imputation model, which should include vari-ables that are predictive of the varivari-ables with missing values.GDPpc has been included in the imputation model since it is predictive of many of the variables with incomplete information; for example, the economic performance of a country is correlated with the educational level (Knack and Keefer, 1997) and with the level of urbanization
(Hender-son, 2003). The mean-centred variable for time has also been included in the MI model in order to account for the effects of time on the variables having missing values (Zhang, 2016), since many of them show a clear trend over the 15-year period.
Denote bymi jthe value in the ith survey of thejt hcountry for the covariate whose missing values we want to impute. The equation for the two-level imputation model is: mi j= β0+ β1log(GDP pci j) + β2ti j+ u0j+ εi j, (1) whereti j is the mean-centred variable for time, u0j∼ N (0, σ2
u) is the country random effect representing unmeasured time-invariant characteristics of the jt h country, and
εi j∼ N (0, σε2) is the time-varying error term.
The imputation model was estimated using Markov chain Monte Carlo (MCMC) methods, which simulate a set of parameters at each iteration from the posterior pre-dictive distribution of the missing data (Gelman et al., 2013). Following the Bayesian approach, the missing values were treated as parameters and were estimated at each it-eration of the MCMC sampling. All the variable with missing data were estimated si-multaneously by means of multivariate models, ensuring that the relationship between the variables was preserved. In this analysis, the number of burn-in iterations was set to 100,000. After the burn-in phase, 500,000 iterations were run, and the values for every 5,000 iterations were stored to obtain 100 imputed datasets. A high number of imputations is required when the rate of missing data is high (Bodner, 2008; Graham et al., 2007). The potential scale reduction factor (Gelman and Rubin, 1992) is the main tool to check the convergence of the parameters of the imputation models. Packages pan (Schafer and Graham, 2002) and mitml (Grund et al., 2016) of software R (R Core Team, 2013) were used to run these analyses.
4.2. Fixed effect model for mortality rates
The Hausman test suggested that fixed effect models are preferred to random effect mod-els, since 76 of the 100 imputed datasets have ap-value lower than 0.05. The model of interest is a fixed effects model for the mortality outcome. Denote byN M Ri j the out-come variable measured in theit h (i = 1,...,4) survey of the jt h(j = 1,...,80) country, and the equation for the fixed effect model is:
log(N M Ri j) =β1log(GDPpc
i j) + β2Gi nii j+ β3E d ucat i oni j
+ β4H eal t h.e x pe nd i t u r ei j+ β5Ru rali j+ β6Yea r _2006i + β7Yea r _2011i+ β8Yea r _2016i+ γj+ εi j,
(2)
whereγjis the unobserved time-invariant country effect, andεi j∼ N (0, σ2
ε) is the error term. The inclusion of time dummies allows controlling for time fixed effects, since variation in the outcome is expected to arise from overall time trends, as discussed earlier.
Before the analysis, all the continuous covariates were mean centred. The R packageplm (Croissant and Millo, 2008) was used to run these analyses. The same model was fitted to predict log(PN M Ri j).
5. RESULTS
The two-level imputation model of Equation 1 was applied to impute the missing values of the covariatesGDPpc, Gini, Education, Health expenditure, and Rural. The potential scale reduction factor associated with the parameters of this model suggests that con-vergence has been reached. The parameter with the highest potential scale reduction factor is the intercept variance forEducation, with a value of 1.021. This value is below the typical threshold of 1.050, indicating that convergence has been achieved. After in-spection of the correlation matrix, all the covariates were included in the model, since no issues of multicollinearity arose (the strongest correlation was between log(GDPpc) andEducation, with a correlation coefficient ranging from 0.48 to 0.59 in the imputed datasets).
Table 3 shows the results of Models 1 and 2, with log(NMR) and log(PNMR) as the outcomes, respectively. Among the determinants of interest, log(GDPpc) has a strongly significant negative association with both outcomes. This result is consistent with a large body of literature on the association between poverty and early-age mortality at the country level (Wagstaff, 2002; United Nations Fund for Populationet al., 1999; Neal, 2009). Poorer countries, in general, offer worse access to health services than better-off countries, and households lacking financial resources can face barriers to accessing health services (Peterset al., 2008). In general, a reduction in poverty leads to an improvement in a household’s nutritional levels and living standards, factors having a direct impact on children’s health (Scott and Duncan, 2000; Nandyet al., 2005).
The association between poverty and neonatal mortality is generally found to be stronger than with post-neonatal mortality. However, this result is not consistent with part of the existing literature, which has found income to have a stronger association with post-neonatal mortality than with neonatal mortality in cross-sectional studies in low- and middle-income countries (Lawnet al., 2005; Neal, 2009; Neal and Falkingham, 2014). It is reasonable to think that the effects of poverty need a time span longer than four weeks after birth to be totally expressed, especially if adopting Mosley and Chen (1984) view of child mortality as the “ultimate consequence of a cumulative series of bi-ological insults rather than the outcome of a single bibi-ological event”. However, poverty might be associated with limited access to antenatal and delivery care services, espe-cially in countries where the gap between private and public health services is significant, therefore affecting neonatal mortality.
Gini was not significantly associated with the mortality outcomes. A potential pathway through which economic inequality affects infant health outcomes involves widespread adverse housing and sanitation conditions, inadequate investment in public goods, and social and geographical segregation leading to more difficult access to the
TABLE 3
Fixed effect country-level regressions of the log neonatal and post-neonatal mortality rates; Models 1 and 2.
Model 1: Outcome log(N M R) Model 2: Outcome log(PN M R)
Variable Coefficient P-value Coefficient P-value
log(GDP pc) -0.132 < 0.01 -0.203 < 0.01 Gini 0.002 0.14 0.003 0.15 Education -0.002 < 0.01 -0.002 < 0.01 Health expenditure -0.005 0.42 -0.009 0.42 Rural -0.002 0.61 0.000 0.98 Year 2005 -0.067 0.01 -0.150 < 0.01 Year 2010 -0.141 < 0.01 -0.308 < 0.01 Year 2015 -0.226 < 0.01 -0.461 < 0.01
health system. However, these pathways have been found not to be significant in mining early-age mortality after taking into consideration other socioeconomic deter-minants. This result is consistent with Szwarcwaldet al. (2002) at the micro level, while Mayer and Sarin (2005) found an association between income inequality and early-age mortality at the macro level. However, certain issues might affect analyses of the associa-tion between mortality and income inequality at the macro level. Gravelle (1998) stated that the relationship between health and income is curvilinear, meaning that the same amount of money is associated with a higher increase in health among poorer groups than among richer groups. Therefore, a decrease in income inequality deriving from any money transfer from the richest to the poorest necessarily leads to an artefactual corre-lation between income inequality and health outcomes. It is also worth noting that this analysis considers a sample of low- and middle-income countries, many of which are still in a condition of widespread poverty. It could be reasonable to think that in this context the absolute level of deprivation is the primary socioeconomic determinant of early-age mortality, being more important than the distribution of income within coun-tries. Wilkinson and Pickett (2006) hypothesised that economic inequality might affect health outcomes only in contexts where basic needs are met, which would not be the case in the set of low- and middle-income countries examined in this analysis.
Moreover, the interaction term between log(GDPpc) and Gini has been included in Models 1 and 2, in order to test whether the negative effect of poverty is stronger in countries with greater income inequality. The interaction effect is not significant (p-value= 0.93 for neonatal mortality and 0.74 for post-neonatal mortality, results not shown): there is no evidence that the same level of deprivation can have a different im-pact on neonatal and post-neonatal mortality in a country where economic distribution is more unequal. Among the other variables,Education was strongly significant for both outcomes, whileHealth expenditure and Rural were not significant predictors of early-age mortality. The adjustedR2calculated for each of the imputed datasets ranged from 0.63 to 0.68 for Model 1, and from 0.69 to 0.72 for Model 2. Appendix B presents the
results for Models 1 and 2, excluding the variableGini. These results show that the asso-ciation between the rest of the covariates and the mortality outcomes is not affected by the imputation of values ofGini, which has a very high proportion of missing values.
5.1. Models including measures of non-monetary deprivation
Alternative models including three non-monetary measures of deprivation instead of log(GDPpc) have been fitted. As discussed earlier, the chosen variables were access to electricity, clean water and improved sanitation. These three variables could be included simultaneously in the models, since their correlation coefficient is not too large (the largest correlation coefficient is that betweenElectricity and Water, which ranges from 0.64 to 0.66 in the imputed datasets), and no issues of multicollinearity arise. Results are shown in Table 4.
Among the three determinants of risk, access to clean water was the only signifi-cant predictor of both mortality outcomes: inadequate water sources are a major cause of water-borne diseases such as those causing diarrhoea (Fewtrellet al., 2005). This de-terminant had a stronger association with neonatal mortality than with post-neonatal mortality. These results could seem counter-intuitive, since the estimated proportion of neonatal mortality caused by diarrhoea has been estimated to be much smaller than diarrhoea-related mortality in the first five years of life (Lawnet al., 2005; Boschi-Pinto and Tomaskovic, 2006). We can however mention the impact of unimproved water supply and sanitation on maternal health during pregnancy, which can affect neona-tal morneona-tality (Khanet al., 2011; Manassaram et al., 2005). Comparing the magnitude of the coefficients ofWater across the two models, this determinant have a stronger as-sociation with neonatal mortality than with post-neonatal mortality (the standardized coefficients areβW at e r,N M R? = −0.49 vs β?W at e r,P N M R= −0.36).
Access to improved sanitation was not correlated with post-neonatal mortality, while it had a weak association with neonatal mortality (p-value= 0.07), which can be ex-plained by the same factors related to water-borne diseases mentioned earlier in relation to access to clean water (Fewtrellet al., 2005). Access to electricity was not a significant predictor of early-age mortality: while this variable has been linked to the use of solid fuels for cooking and heating, impacting indoor air pollution (Bruceet al., 2000), other dimensions of deprivation are more strongly associated with early-age mortality.
Differently from Model 1,Gini has a borderline effect (p-value= 0.08) in the model for log(N M R), while it was not associated with post-neonatal mortality. None of the other covariates were significantly associated with the mortality outcomes. As with the previous models, this set of covariates explains more the variability of the post-neonatal mortality outcome than of the neonatal mortality outcome (the adjustedR2calculated on each of the imputed datasets ranged from 0.64 to 0.69 in Model 3, and from 0.69 to 0.73 in Model 4).
TABLE 4
Fixed effect country-level regressions of the log neonatal and post-neonatal mortality rates; Models 3 and 4.
Model 3: Outcome log(N M R) Model 4: Outcome log(PN M R)
Variable Coefficient P-value Coefficient P-value
Electricity 0.002 0.45 0.001 0.80 Water -0.010 < 0.01 -0.014 0.01 Sanitation -0.009 0.07 -0.012 0.13 Gini -0.005 0.08 -0.006 0.15 Education 0.000 0.77 0.000 0.77 Health expenditure -0.010 0.17 -0.016 0.21 Rural 0.008 0.13 0.014 0.12 Year 2005 -0.044 0.09 -0.116 0.01 Year 2010 -0.092 0.04 -0.238 < 0.01 Year 2015 -0.153 0.02 -0.354 < 0.01 6. CONCLUSION
While determinants of infant and child mortality have received broad attention in the literature, socioeconomic factors impacting neonatal mortality have only recently inter-ested demographers and health researchers. A decrease in under-five mortality observed globally has not been followed by an equal drop in neonatal deaths (Pathiranaet al., 2016). By making use of World Bank data from different surveys of 79 low- and middle-income countries, this study has assessed whether poverty and economic inequality have different patterns of association with deaths occurring in and after the first month of life, while controlling for potential confounders. Poverty and access to clean water were found to be significant predictors of neonatal and post-neonatal mortality. Four path-ways through which poverty can affect early-age mortality have been identified: reduced access to health care (Lawnet al., 2005), environmental aspects (Jain, 1985; Rutstein, 2000), nutritional deprivation both in mothers and children (United Nations Fund for Populationet al., 1999), and maternal education (Neal, 2009). Access to clean water was associated with water-borne diseases, such as those leading to diarrhoea. Both poverty and access to clean water here were found to have a stronger association with neonatal than with post-neonatal mortality. Economic inequality does not seem to be a predic-tor of early-age mortality. It should be taken into account that the sample analysed in this study contains many countries in which the threshold of absolute deprivation has not been overcome. In such contexts absolute deprivation, rather than its distribution, has been found to have a major effect on health outcomes (Wilkinson, 1994; Marmot, 2005). The pragmatic consequences of poverty and deprivation are therefore of primary importance for early-age mortality.
Two main limitations affect this study. First, several uncaptured factors – among oth-ers, measures of political context, social norms and cultural beliefs – could be the reason for the unexplained heterogeneity in NMRs and PNMRs. For instance, the percentage
of GDP aimed at health expenditures could not be informative about the effectiveness of health services and policies, as well as about their coverage across the population. Sec-ond, some variables, like the Gini coefficient, had a high proportion of missing data, as explained in Section 4.1.
By identifying the macro-level socioeconomic factors associated with early-age mor-tality, this study has implications for health and social policies that aim to reduce early-age mortality. Policies oriented towards the reduction of poverty and the extension of the clean water supply can have a positive effect on post-neonatal mortality, while mater-nal education is the only other significant determinant of early-age mortality. These find-ings can partly explain the relative stagnation in NMRs observed over the last decades, in comparison to infant and child mortality. Further research might involve the study of causal paths leading from deprivation to early-age health outcomes. It might also be of interest to study the association between deprivation and other early-age health outcomes beyond mortality, like birth weight or infant morbidity.
APPENDIX
A. LIST OF THE SELECTED COUNTRIES
The selected countries (79 in total) are3:
Afghanistan, Algeria, Angola, Azerbaijan, Bangladesh, Benin, Bhutan, Bolivia, Botswana, Burkina Faso, Burundi, Cambodia, Cameroon, Central African Republic, Chad, Co-moros, Congo Dem. Rep., Congo, Rep., Cote d’Ivoire, Djibouti, Dominica, Domini-can Republic, Egypt Arab Rep., Equatorial Guinea, Eritrea, Ethiopia, Gabon, Gam-bia, Ghana, Guatemala, Guinea, Guinea-Bissau, Guyana, Haiti, India, Indonesia, Iraq, Kenya, Kiribati, Lao PDR, Lesotho, Liberia, Madagascar, Malawi, Mali, Marshall Is-lands, Mauritania, Micronesia, Morocco, Mozambique, Myanmar, Namibia, Nauru, Nepal, Niger, Nigeria, Pakistan, Papua New Guinea, Philippines, Rwanda, Sao Tome and Principe, Senegal, Sierra Leone, South Africa, South Sudan, Sudan, Swaziland, Tajik-istan, Tanzania, Timor-Leste, Togo, Trinidad &Tobago, TurkmenTajik-istan, Tuvalu, Uganda, Uzbekistan, Yemen, Zambia, Zimbabwe.
3The observations referring to Somalia have been excluded, since this is the only country having
no data for GDP per capita, which needs to be complete since it is a variable used as a predictor in the imputation model.
B. MODELS FORlog(N M R)ANDlog(PN M R)EXCLUDINGGINI
TABLE 5
Fixed effect country-level regressions of the log neonatal and post-neonatal mortality rates; Models 1 and 2, Gini not included.
Model 1 :Outcome log(N M R) Model 2: Outcome log(PN M R)
Variable Coefficient P-value Coefficient P-value
log(GDP pc) -0.128 < 0.01 -0.196 < 0.01 Education -0.001 < 0.01 -0.002 0.03 Health expenditure -0.007 0.27 -0.012 0.29 Rural 0.001 0.65 0.005 0.29 Year 2005 -0.065 < 0.01 -0.147 < 0.01 Year 2010 -0.137 < 0.01 -0.303 < 0.01 Year 2015 -0.219 < 0.01 -0.450 < 0.01 REFERENCES
N. ALESHINA, G. REDMOND(2005). How high is infant mortality in Central and East-ern Europe and the Commonwealth of Independent States? Population Studies, 59, no. 1, pp. 39–54.
S. ALKIRE, M. E. SANTOS(2014). Measuring acute poverty in the developing world: Robustness and scope of the multidimensional poverty index. World Development, 59, pp. 251–274.
L. E. ANDERSEN(2002). Rural-urban migration in Bolivia: Advantages and disadvan-tages. Documento de Trabajo 05/02, Instituto de Investigaciones Socio-Económicas, Universidad Católica Boliviana.
A. ARNTZEN, L. MORTENSEN, O. SCHNOR, S. CNATTINGIUS, M. GISSLER, A.-M. N. ANDERSEN(2007). Neonatal and postneonatal mortality by maternal educa-tion - a populaeduca-tion-based study of trends in the nordic countries, 1981–2000. European Journal of Public Health, 18, no. 3, pp. 245–251.
S. BHALOTRA(2006). Childhood mortality and economic growth. Research Paper 79, UNU-WIDER, United Nations University (UNU).
M. BOBAK, D. A. LEON(1992).Air pollution and infant mortality in the Czech Republic,
1986-88. The Lancet, 340, no. 8826, pp. 1010–1014.
T. E. BODNER(2008). What improves with increased missing data imputations?
N. BOO, C. CHOR(1994). Six year trend of neonatal septicaemia in a large Malaysian maternity hospital. Journal of Paediatrics and Child Health, 30, no. 1, pp. 23–27. C. BOSCHI-PINTO, L. TOMASKOVIC (2006). Methods and assumptions for diarrhoea
mortality estimates. URL http://www.who.int/maternal_child_adolescent/ documents/cherg_diarrhoea_mortality/en/. Available online.
E. BOY, N. BRUCE, H. DELGADO(2002). Birth weight and exposure to kitchen wood smoke during pregnancy in rural Guatemala. Environmental Health Perspectives, 110, no. 1, pp. 109–114.
N. BRUCE, R. PEREZ-PADILLA, R. ALBALAK(2000).Indoor air pollution in developing countries: A major environmental and public health challenge. Bulletin of the World Health Organization, 78, pp. 1078–1092.
B. BURSTRÖM, G. MACASSA, L. ÖBERG, E. BERNHARDT, L. SMEDMAN(2005). Eq-uitable child health interventions: The impact of improved water and sanitation on in-equalities in child mortality in Stockholm, 1878 to 1925. American Journal of Public Health, 95, no. 2, pp. 208–216.
J. C. CALDWELL (1979). Education as a factor in mortality decline an examination of Nigerian data. Population Studies, pp. 395–413.
J. CARPENTER, M. KENWARD(2012). Multiple imputation and its application. John Wiley & Sons, Chicester, UK.
J. B. CASTERLINE, E. C. COOKSEY, A. F. E. ISMAIL(1989). Household income and child survival in Egypt. Demography, 26, no. 1, pp. 15–35.
J. R. CHEEMA(2014).Some general guidelines for choosing missing data handling methods in educational research. Journal of Modern Applied Statistical Methods, 13, no. 2, p. 3. Y. CROISSANT, G. MILLO(2008).Panel data econometrics in R: The plm package. Journal
of Statistical Software, 27, no. 2, pp. 1–43.
G. L. DARMSTADT, Z. A. BHUTTA, S. COUSENS, T. ADAM, N. WALKER, L. DEBER
-NIS(2005).Evidence-based, cost-effective interventions: How many newborn babies can we save? The Lancet, 365, no. 9463, pp. 977–988.
J. DAVANZO, W. P. BUTZ, J.-P. HABICHT(1983).How biological and behavioural influ-ences on mortality in Malaysia vary during the first year of life. Population Studies, 37, no. 3, pp. 381–402.
A. B. DEOLALIKAR(2005). Attaining the Millennium Development Goals in India: Re-ducing Infant Mortality, Child Malnutrition, Gender Disparities and Hunger-Poverty and Increasing School Enrollment and Completion. Oxford University Press, New Delhi, India.
S. A. ESREY, J. B. POTASH, L. ROBERTS, C. SHIFF(1991). Effects of improved water supply and sanitation on ascariasis, diarrhoea, dracunculiasis, hookworm infection, schis-tosomiasis, and trachoma. Bulletin of the World Health Organization, 69, no. 5, p. 609.
L. FEWTRELL, R. B. KAUFMANN, D. KAY, W. ENANORIA, L. HALLER, J. M. COL -FORDJR(2005). Water, sanitation, and hygiene interventions to reduce diarrhoea in
less developed countries: A systematic review and meta-analysis. The Lancet Infectious Diseases, 5, no. 1, pp. 42–52.
D. FILMER (1999). Child Mortality and Public Spending on Health: How Much Does Money Matter? The World Bank, Washington, DC.
G. FINK, I. GÜNTHER, K. HILL(2011).The effect of water and sanitation on child health: Evidence from the demographic and health surveys 1986–2007. International Journal of Epidemiology, 40, no. 5, pp. 1196–1204.
A. FLEGG(1982). Inequality of income, illiteracy and medical care as determinants of
infant mortality in underdeveloped countries. Population Studies, 36, no. 3, pp. 441– 458.
M. GARENNE, E. GAKUSI(2006).Health transitions in sub-Saharan Africa: Overview of mortality trends in children under 5 years old (1950-2000). Bulletin of the World Health Organization, 84, pp. 470–478.
A. GELMAN, D. B. RUBIN (1992). Inference from iterative simulation using multiple sequences. Statistical Science, 7, no. 4, pp. 457–472.
J. W. GRAHAM, A. E. OLCHOWSKI, T. D. GILREATH(2007). How many imputations
are really needed? Some practical clarifications of multiple imputation theory. Prevention Science, 8, no. 3, pp. 206–213.
H. GRAVELLE (1998). How much of the relation between population mortality and un-equal distribution of income is a statistical artefact? BMJ, 316, no. 7128, pp. 382–385. M. GROSSE, K. HARTTGEN, S. KLASEN(2005). Measuring pro-poor growth with
non-income indicators. Discussion papers 132, Ibero America Institute for Economic Re-search, Göttingen.
S. GRUND, O. LÜDTKE, A. ROBITZSCH(2016).Multiple imputation of multilevel miss-ing data: An introduction to the R package pan. SAGE Open, 6, no. 4, pp. 1–17. V. HENDERSON (2003). The urbanization process and economic growth: The so-what
question. Journal of Economic Growth, 8, no. 1, pp. 47–71.
K. HILL, G. BICEGO, M. MAHY(2001).Childhood mortality in kenya: An examination
of trends and determinants in the late 1980s to mid 1990s. Working paper, Hopkins Population Center.
A. K. JAIN(1985).Determinants of regional variations in infant mortality in rural India. Population Studies, 39, no. 3, pp. 407–424.
S. M. KAMAL (2012). Maternal education as a determinant of neonatal mortality in Bangladesh. Journal of Health Management, 14, no. 3, pp. 269–281.
S. KARLSEN, L. SAY, J.-P. SOUZA, C. J. HOGUE, D. L. CALLES, A. M. GÜLMEZOGLU,
R. RAINE(2011). The relationship between maternal education and mortality among
women giving birth in health care institutions: Analysis of the cross sectional WHO global survey on maternal and perinatal health. BMC Public Health, 11, no. 606, pp. 1–10. A. E. KHAN, A. IRESON, S. KOVATS, S. K. MOJUMDER, A. KHUSRU, A. RAHMAN,
P. VINEIS(2011). Drinking water salinity and maternal health in coastal Bangladesh: Implications of climate change. Environmental Health Perspectives, 119, no. 9, pp. 1328–1332.
T. K. KIM, S. R. LANE(2013).Government health expenditure and public health outcomes:
A comparative study among 17 countries and implications for US health care reform. American International Journal of Contemporary Research, 3, no. 9, pp. 8–13. J. KITTS, J. H. ROBERTS(1996). The Health Gap: Beyond Pregnancy and Reproduction.
IDRC, Ottawa, Canada.
S. KNACK, P. KEEFER(1997).Does social capital have an economic payoff? A cross-country investigation. The Quarterly Journal of Economics, 112, no. 4, pp. 1251–1288. R. LALOU, T. K. LEGRAND(1997). Child mortality in the urban and rural Sahel.
Pop-ulation: An English Selection, 9, pp. 147–168.
J. LAWN, K. KERBER, C. ENWERONU-LARYEA, O. MASSEEBATEMAN(2009). New-born survival in low resource settings—are we delivering? BJOG: An International Journal of Obstetrics & Gynaecology, 116, pp. 49–59.
J. E. LAWN, S. COUSENS, J. ZUPAN(2005). 4 million neonatal deaths: When? Where?
Why? The Lancet, 365, no. 9462, pp. 891–900.
J. H. LEE, J. HUBERJR (2011). Multiple imputation with large proportions of missing data: How much is too much? In United Kingdom Stata Users’ Group Meetings 2011. Stata Users Group, 23.
R. LOZANO, H. WANG, K. J. FOREMAN, J. K. RAJARATNAM, M. NAGHAVI, J. R. MARCUS, L. DWYER-LINDGREN, K. T. LOFGREN, D. PHILLIPS, C. ATKINSON,
A. D. LOPEZ, C. J. L. MURRAY (2011). Progress towards millennium development
goals 4 and 5 on maternal and child mortality: An updated systematic analysis. The Lancet, 378, no. 9797, pp. 1139–1165.
Z.-C. LUO, W. J. KIERANS, R. WILKINS, R. M. LISTON, J. MOHAMED, M. S. KRAMER
(2004).Disparities in birth outcomes by neighborhood income: Temporal trends in rural and urban areas, British Columbia. Epidemiology, 15, no. 6, pp. 679–686.
J. MACINKO, F. C. GUANAIS, M. D. F. M. DESOUZA(2006). Evaluation of the im-pact of the family health program on infant mortality in Brazil, 1990–2002. Journal of Epidemiology & Community Health, 60, no. 1, pp. 13–19.
M. MÅLQVIST(2011).Neonatal mortality: An invisible and marginalised trauma. Global
Health Action, 4, no. 5724, pp. 1–11.
D. M. MANASSARAM, L. C. BACKER, D. M. MOLL (2005). A review of nitrates in drinking water: Maternal exposure and adverse reproductive and developmental out-comes. Environmental Health Perspectives, 114, no. 3, pp. 320–327.
M. MARMOT (2005). Social determinants of health inequalities. The Lancet, 365, no. 9464, pp. 1099–1104.
J. MARTINES, V. K. PAUL, Z. A. BHUTTA, M. KOBLINSKY, A. SOUCAT, N. WALKER, R. BAHL, H. FOGSTAD, A. COSTELLO, LANCETNEONATALSURVIVALSTEER -INGTEAM(2005). Neonatal survival: A call for action. The Lancet, 365, no. 9465,
pp. 1189–1197.
A. MASON(2007). Demographic transition and demographic dividends in developed and developing countries. In United Nations Expert Group Meeting on Social and Eco-nomic Implications of Changing Population Age Structures. United Nations, New York, vol. 31, pp. 81–101.
S. E. MAYER, A. SARIN(2005).Some mechanisms linking economic inequality and infant mortality. Social Science & Medicine, 60, no. 3, pp. 439–455.
E. MCCLURE, M. NALUBAMBA-PHIRI, R. GOLDENBERG(2006). Stillbirth in
devel-oping countries. International Journal of Gynecology & Obstetrics, 94, no. 2, pp. 82–90.
D. J. MCKENZIE(2005). Measuring inequality with asset indicators. Journal of Popula-tion Economics, 18, no. 2, pp. 229–260.
T. MERTENS, M. FERNANDO, S. N. COUSENS, B. R. KIRKWOOD, T. MARSHALL, R. FEACHEM(1990). Childhood diarrhoea in Sri Lanka: A case-control study of the impact of improved water sources. Tropical Medicine and Parasitology, 41, no. 1, pp. 98–104.
C. G. MESIKE, J. N. MOJEKWU(2012). Environmental determinants of child mortality in Nigeria. Journal of Sustainable Development, 5, no. 1, p. 65.
W. H. MOSLEY, L. C. CHEN (1984). An analytical framework for the study of child survival in developing countries. Population and Development Review, 10, no. 10, pp. 25–45.
C. J. MURRAY, T. LAAKSO, K. SHIBUYA, K. HILL, A. D. LOPEZ(2007). Can we
achieve millennium development goal 4? New analysis of country trends and forecasts of under-5 mortality to 2015. The Lancet, 370, no. 9592, pp. 1040–1054.
S. NANDY, M. IRVING, D. GORDON, S. SUBRAMANIAN, G. D. SMITH (2005). Poverty, child undernutrition and morbidity: New evidence from India. Bulletin of the World Health Organization, 83, pp. 210–216.
S. NEAL(2009). Neonatal Mortality in Developing Countries: An Analysis of Trends and Determinants. Ph.D. thesis, University of Southampton.
S. NEAL, J. FALKINGHAM(2014). Neonatal death and national income in developing countries: Will economic growth reduce deaths in the first month of life? International Journal of Population Research, 2014, pp. 1–6.
O. F. NORHEIM, P. JHA, K. ADMASU, T. GODAL, R. J. HUM, M. E. KRUK,
O. GÓMEZ-DANTÉS, C. D. MATHERS, H. PAN, J. SEPÚLVEDA, W. SURAWEERA,
S. VERGUET, A. T. WOLDEMARIAM, G. YAMEY, D. T. JAMISON, R. PETO(2015).
Avoiding 40% of the premature deaths in each country, 2010–30: review of national mortality trends to help quantify the UN sustainable development goal for health. The Lancet, 385, no. 9964, pp. 239–252.
N. R. NOWATZKI(2012).Wealth inequality and health: A political economy perspective.
International Journal of Health Services, 42, no. 3, pp. 403–424.
E. R. PAMUK, R. FUCHS, W. LUTZ(2011). Comparing relative effects of education and economic resources on infant mortality in developing countries. Population and Devel-opment Review, 37, no. 4, pp. 637–664.
J. PATHIRANA, F. M. MUNOZ, V. ABBING-KARAHAGOPIAN, N. BHAT, T. HARRIS, A. KAPOOR, D. L. KEENE, A. MANGILI, M. A. PADULA, S. L. PANDE, V. POOL, F. POURMALEK, F. VARRICCHIO, S. KOCHHAR, C. CUTLAND, B. C. N. D. W. GROUP(2016).Neonatal death: Case definition & guidelines for data collection, analysis, and presentation of immunization safety data. Vaccine, 34, no. 49, pp. 6027–6037. A. R. PEBLEY, P. W. STUPP (1987). Reproductive patterns and child mortality in
Guatemala. Demography, 24, no. 1, pp. 43–60.
D. H. PETERS, A. GARG, G. BLOOM, D. G. WALKER, W. R. BRIEGER,
M. HAFIZURRAHMAN(2008). Poverty and access to health care in developing
D. PIACHAUD(1987). Problems in the definition and measurement of poverty. Journal
of Social Policy, 16, no. 2, pp. 147–164.
L. POZZI, D. R. FARIÑAS (2015). Infant and child mortality in the past. Annales de
Démographie Historique, 1, no. 129, pp. 55–75.
S. H. PRESTON, M. R. HAINES(2014). Fatal years: Child mortality in late nineteenth-century America, vol. 1175. Princeton University Press.
L. PRITCHETT, L. H. SUMMERS(1993). Wealthier is healthier. The Journal of Human Resources, 31, no. 4, pp. 841–868.
R CORE TEAM (2013). R: A Language and Environment for Statistical Computing. R Foundation for Statistical Computing, Vienna, Austria. URL http://www. R-project.org/.
J. K. RAJARATNAM, J. R. MARCUS, A. D. FLAXMAN, H. WANG, A. LEVIN-RECTOR, L. DWYER, M. COSTA, A. D. LOPEZ, C. J. MURRAY(2010).Neonatal, postneonatal, childhood, and under-5 mortality for 187 countries, 1970–2010: A systematic analysis of progress towards millennium development goal 4. The Lancet, 375, no. 9730, pp. 1988–2008.
M. R. RIP, C. S. KEEN, D. L. WOODS(1987). Intra-urban variations of neonatal and
post-neonatal mortality in a developing city. Social Science & Medicine, 25, no. 8, pp. 889–894.
D. B. RUBIN(2004).Multiple Imputation for Nonresponse in Surveys, vol. 81. John Wiley & Sons, New York.
S. O. RUTSTEIN(2000). Factors associated with trends in infant and child mortality in developing countries during the 1990s. Bulletin of the World Health Organization, 78, pp. 1256–1270.
L. SAY, R. RAINE(2007).A systematic review of inequalities in the use of maternal health care in developing countries: Examining the scale of the problem and the importance of context. Bulletin of the World Health Organization, 85, pp. 812–819.
J. L. SCHAFER, J. W. GRAHAM(2002). Missing data: Our view of the state of the art. Psychological Methods, 7, no. 2, p. 147.
S. SCOTT, C. J. DUNCAN(2000).Interacting effects of nutrition and social class
differen-tials on fertility and infant mortality in a pre-industrial population. Population Studies, 54, no. 1, pp. 71–87.
A. SEN(2014). Development as freedom (1999). In J. ROBERTS, A. HITE, N. CHOREV
(eds.),The Globalization and Development Reader: Perspectives on Development and Global Change, Wiley-Blackwell, Chichester, UK, pp. 525–547.
K. R. SMITH, J. P. MCCRACKEN, M. W. WEBER, A. HUBBARD, A. JENNY, L. M.
THOMPSON, J. BALMES, A. DIAZ, B. ARANA, N. BRUCE(2011). Effect of reduc-tion in household air pollureduc-tion on childhood pneumonia in Guatemala (RESPIRE): A randomised controlled trial. The Lancet, 378, no. 9804, pp. 1717–1726.
S. SPILERMAN(2000). Wealth and stratification processes. Annual Review of Sociology, 26, no. 1, pp. 497–524.
C. L. SZWARCWALD, C. L. T.DEANDRADE, F. I. BASTOS(2002). Income inequality, residential poverty clustering and infant mortality: A study in Rio de Janeiro, Brazil. Social Science & Medicine, 55, no. 12, pp. 2083–2092.
C. R. TITALEY, M. J. DIBLEY, K. AGHO, C. L. ROBERTS, J. HALL(2008). Determi-nants of neonatal mortality in Indonesia. BMC Public Health, 8, no. 1, p. 232. UNICEF (2018).The neonatal period is the most vulnerable time for a child. URLhttps:
//data.unicef.org/topic/child-survival/neonatal-mortality/. Available online.
UNICEF, WHO, WORLDBANK, UN-DESA POPULATIONDIVISION(2015).Levels and Trend in Child Mortality 2015. WHO press, Geneva, Switzerland.
UNITED NATIONS FUND FOR POPULATION, UNICEF, WORLD BANK, WHO (1999). Reduction of Maternal Mortality. WHO press, Geneva, Switzerland.
E. VAN DEPOEL, O. O’DONNELL, E. VANDOORSLAER(2009). What explains the rural-urban gap in infant mortality: Household or community characteristics? Demog-raphy, 46, no. 4, pp. 827–850.
J. VANDEMOORTELE(2000). Absorbing social shocks, protecting children and reducing poverty. the role of basic social services. UNICEF staff working papers. Evaluation, Policy and Planning Series EPP-00-001, UNICEF.
M. VERHOEVEN, M. S. GUPTA, M. E. TIONGSON(1999). Does higher government spending buy better results in education and health care? Working paper no. 99/21, International Monetary Fund.
C. G. VICTORA, S. R. HUTTLY, S. C. FUCHS, M. OLINTO(1997).The role of conceptual
frameworks in epidemiological analysis: A hierarchical approach. International Journal of Epidemiology, 26, no. 1, pp. 224–227.
A. WAGSTAFF(2002). Inequality aversion, health inequalities, and health achievement.
Journal of Health Economics, 21, no. 4, pp. 627–641.
S. N. WALL, A. C. LEE, S. NIERMEYER, M. ENGLISH, W. J. KEENAN, W. CARLO,
Z. A. BHUTTA, A. BANG, I. NARAYANAN, I. ARIAWAN, J. E. LAWN(2009). Neona-tal resuscitation in low-resource settings: What, who, and how to overcome challenges to
scale up? International Journal of Gynecology & Obstetrics, 107, no. Supplement 1, pp. S47–S64.
R. G. WILKINSON(1994).The epidemiological transition: From material scarcity to social disadvantage? Daedalus, 123, no. 4, pp. 61–77.
R. G. WILKINSON, K. E. PICKETT(2006). Income inequality and population health: A review and explanation of the evidence. Social Science & Medicine, 62, no. 7, pp. 1768–1784.
WORLDBANK(2015). IBRD-IDA mortality rate, neonatal (per 1,000 live births). URL http://data.worldbank.org/indicator/SH.DYN.NMRT. Available online. WORLDHEALTHORGANIZATION(2009). Global health risks: Mortality and burden
of disease attributable to selected major risks. URLhttps://www.who.int/water_ sanitation_health/publications/envsanfactsheets/en/index1.html. Available online.
WORLDHEALTHORGANIZATION(2016).Fact sheet number 292. URLhttp://www. who.int/mediacentre/factsheets/fs292/en. Available online.
J. ZHANG, K. R. SMITH(2007). Household air pollution from coal and biomass fuels in china: Measurements, health impacts, and interventions. Environmental Health Per-spectives, 115, no. 6, pp. 848–855.
Z. ZHANG(2016).Multiple imputation for time series data with Amelia package. Annals of Translational Medicine, 4, no. 3, pp. 1–10.
SUMMARY
While socioeconomic determinants of infant mortality have received substantial attention in the literature, determinants of neonatal and post-neonatal mortality have rarely been analysed and compared. By making use of World Bank data, this country-level study aims to highlight different patterns of association of poverty and income inequality with mortality occurring in the neonatal and post-neonatal periods, controlling for other socioeconomic variables. Poverty is found to be the major determinant of both mortality outcomes, while economic inequality is not a predictor of early-age mortality. This is perhaps because this analysis considers only countries where many households may lack resources for an adequate living standard; in such a context, the absolute level of poverty, rather than its distribution, has an effect on infant health. Moreover, a non-monetary manifestation of poverty, namely access to clean water, is a predictor of both mortality outcomes, probably due to its association with water-borne diseases. By identifying the socioeconomic fac-tors associated with early-age mortality, this study has implications for social policies designed to tackle neonatal and post-neonatal mortality and can partly explain the stagnation in neonatal mortality rates observed over the last decades.