1
A
N EMPIRICAL EVALUATION OF THE EFFECTS OF
E
UROPEAN PUBLIC POLICIES ON ISLAND AIRFARES
Abstract
In this paper we estimate a pricing equation using data, at route and airline levels, for five European countries where a significant proportion of the territory is located on islands; France, Greece, Italy, Portugal and Spain. By using two complementary empirical strategies, instrumental variables and matching procedures, we find that the imposition of Public Service Obligations does not seem to be effective in reducing prices. Furthermore, we find that prices are higher on routes where only island residents enjoy subsidies, but not on routes where subsidies do not discriminate between residents and non-residents. Finally, prices seem to be higher on routes with flat rates in contrast to routes where subsidies to residents are made through fare discounts. Overall, the results of our analysis suggest the need to change policies in order to support air services to islands and to avoid distortions in the market fares offered by airlines.
Keywords: Airline, Subsidies, Resident passenger JEL Classification: L93, H25, L13
2 1. Introduction
The link between air transportation and regional economic growth is well established in the literature. In this regard, several studies have shown a strong relationship between air traffic and different measures of urban or regional economic performance (Brueckner, 2003; Green, 2007; Bel and Fageda, 2008; Percoco, 2010; Sheard, 2014; Bilotkach, 2015; Albalate and Fageda, 2016; Fageda, forthcoming).
The role of air transportation in supporting the mobility of people is particularly relevant on islands where surface transportation is only available within the islands, and maritime transportation is only a reasonable choice for short-haul distances (usually on trips between islands). Furthermore, governments may be interested in protecting air services to islands to spur tourism or promote national cohesion (Williams, 2010).
Hence, governments in European countries where a significant part of the territory is located on islands have implemented policies to subsidize air services on domestic routes from the islands to the mainland (or viceversa). This is the case of France on routes to Corsica, Greece on routes from the main cities to several small islands, Italy on routes to Sardinia, Sicily and Lampedusa, Portugal on routes to Madeira and Azores and Spain on routes to the Canary and Balearic Islands.
These policies may be associated with the imposition of Public Service Obligations (PSO) where governments set restrictions on entry, prices and frequencies, and grant subsidies through a competitive tender to an airline that meet these requirements. Furthermore, governments may provide subsidies only to residents on islands by imposing a flat rate on the prices that they must pay or establishing discounts that are computed as a percentage of market fares. These subsidies to residents may be embedded in the PSO or may be separate to it. In this regard, France and Italy have imposed PSO on several routes and these PSO include in some cases subsidies to residents in the form of flat rates. In Greece, some routes are subject to PSO but residents do not enjoy subsidies from them. Finally, Portugal and Spain specifically subsidize island residents on routes to the mainland without imposing PSO through discounts on market fares.
This paper draws on route-level fares for domestic links from the mainland to the islands for these five countries. With these data, we exploit the variability in the policies implemented in those countries to examine their impact on market fares. Our interest here is to examine the effectiveness of PSO that are associated with a price-cap and whether we
3
can find differences between routes with subsidies that do not discriminate between residents and non-residents and routes with subsidies only to residents.
In this regard, several studies have analyzed the design and effects of the PSO applied in different European countries. Williams and Pagliari (2004), Williams (2010), Merkert and O’Fee (2013) and Wittman et al. (2016) show the high heterogeneity in the PSO programs across various European countries. Such heterogeneity includes the criteria for defining an eligible route or the determination of service levels, fares and subsidies.
Other studies analyze the execution of the program in specific countries. Lian (2010) and Lian and Ronnevik (2011) assess the weaknesses of the PSO regulation implemented in Norway. In particular, they show that competition is weak and there is a high variation in the fares and subsidies per passenger. Di Francesco and Pagliari (2012) analyze the potential negative impact on airfares of eliminating PSOs on the routes connecting the Italian mainland to the island of Sardinia. Calzada and Fageda (2012) find that prices on routes subject to PSO are lower than on unprotected routes with similar characteristics. Finally, Angelopoulos et al. (2013) find inconsistencies in the designation of PSO routes and the average amount of subsidies per passenger on Greek routes.
Studies also include econometric analysis with cross-country datasets. Calzada and Fageda (2014), for example, find that PSOs reduce competition on protected routes, while their effect on the number of flights differs depending on national regulations. Santana (2009) finds that PSOs increase the operation costs of European carriers, but she does not observe a similar effect in the US system. Merkert and Williams (2013) show that European operators perform better in the early months of the PSO contracts than when the contract is approaching termination, suggesting that airlines have fewer incentives to increase efficiency before the tender finishes due to the absence of competition. Finally, some other papers have examined the design of PSOs in European air markets. Pita et al. (2013) propose an operational planning model to examine the design of subsidized air transportation, and apply this methodology to assess the Azores PSO system; while Pita et al. (2014) extended this model and apply it to an analysis of the PSO network in Norway.
Regarding discounts to residents, econometric studies have focused on the case of Spain. Calzada and Fageda (2012) show that routes benefiting from price discounts are priced more highly than the remainder of the domestic routes. Fageda et al. (2012) draws on data of routes departing from Gran Canaria airport, including national and international destinations. They compare prices on subsidized routes (domestic flights from Gran
4
Canaria) with those that are unsubsidized (international flights from Gran Canaria), and find that non-resident passengers pay higher prices than international passengers. Fageda et al. (2016) did not find changes in fares following an increase in the percentage of discounts for residents of market fares.
Valido et al. (2014) compare the different effects of ad-valorem and specific subsidies for resident passengers in air transport markets in a 'market power context'. They show that non-resident passengers may be expelled from the market if the proportion of resident passengers is high enough. They also analyze the most desirable situation between both types of subsidies, ad-valorem or specific, showing that their effects depend on the passengers' willingness to pay. Next, they apply the model to the Canary Island markets, concluding that the ad-valorem subsidy is not the best for the conditions of this market. Finally, Cabrera et al. (2011) carry out a comparative description of these kinds of subsidies in Europe's outermost regions (they also analyzed PSO declarations in these regions).
This paper contributes to the literature on PSO and subsidies to residents by examining the impact on prices of the different policies applied in European countries with islands. We draw on a large sample of domestic routes that link the mainland with islands for the winter and summer seasons of 2016 to estimate a pricing equation that controls for different factors, capacity on the route, distance, competition or the presence of low-cost airlines. Furthermore, we apply two different estimation strategies. First, we use an instrumental variables procedure that takes into account the potential endogeneity of the variable for the size of the route. Second, we use a matching procedure with data at the route-airline level that focuses on observations that have similar observed attributes.
We find that PSO do not seem to be effective in reducing prices in comparison to routes that are operated on a free subsidy basis. Furthermore, we find that prices are higher on routes where only island residents enjoy subsidies but not on routes where subsidies do not discriminate between residents and non-residents. Finally, prices seem to be higher on routes with flat rates in contrast to the routes where subsidies to residents are made through discounts of market fares.
In the following section, we provide some details on the policies applied in European countries to ensure air services to islands. Next, we explain the data used, and some descriptive statistics are given. In the last section, the empirical strategy is developed and the results of the econometric analysis are explained. Finally, the paper concludes with some policy recommendations.
5 2. Subsidy scheme in Europe
From the period of airline liberalization to date there have been many cases of PSO implemented in Europe. However, each country's government has applied this policy in different ways “In order to maintain appropriate scheduled air services on routes which are vital for the economic development of the region they serve…”1
The legislation that allows member states to impose PSO on air transport markets is Regulation (EC) No 1008/2008 of the European Parliament and the Council of 24 September of 2008, on common rules for the operation of air services in the Community (CEC, 2008). This legislation was modified by the Council Regulation (ECC) No 2408/92 of 23 July 1992, on access for Community air carriers to intra-Community air routes (CEC, 1992).2 From the first declaration until now (the very first tenders were issued in the Irish
Republic), the number of declarations have been multiplied: in 1994 there were 64 routes (Williams and Pagliari, 2004) but at December 2015, the number of PSO declarations were for 238 routes (CEC 2015).
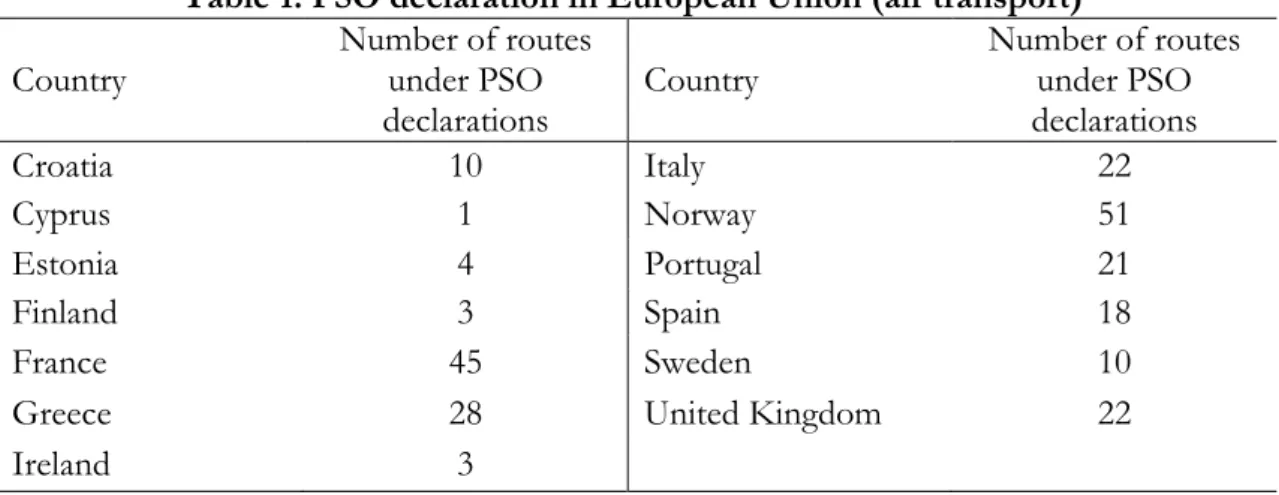
PSO declaration can include a different number of mechanisms in order to guarantee the aforementioned objective. For example, a specific timetable, frequency floors, a minimum seating capacity or even price caps. Table 1 shows the list of European Union countries with PSO declarations (2015).
1 Extracted from the European Commission webpage:
http://ec.europa.eu/transport/modes/air/internal-market/public-service-obligations-psos_en
2 See Williams and Pagliari (2004) and Williams (2010) for a deep analysis of the PSOs implemented in
6
Table 1. PSO declaration in European Union (air transport) Country Number of routes under PSO declarations Country Number of routes under PSO declarations Croatia 10 Italy 22 Cyprus 1 Norway 51 Estonia 4 Portugal 21 Finland 3 Spain 18 France 45 Sweden 10
Greece 28 United Kingdom 22
Ireland 3
Source: CEC 2015
Apart from this mechanism, transport authorities also employ subsidies that are given to resident passengers who are entitled to them because of their resident condition (they could be included in the PSO or not). These types of subsidies are applied in France, Italy, Scotland, Spain and Portugal.
Taking this into account, we focus on domestic routes between an island with significant tourist flows and a large or medium-sized city from the mainland of five European countries: France, Greece, Italy, Spain and Portugal. Hence, we may distinguish between routes subject to PSO obligations and/or price discounts and routes served on a free subsidy basis. Tables A1 to A5 in the appendix provides the list of considered routes in our sample, specifying whether they are affected by subsidies and/or PSO or not.
In routes of our sample where PSO obligations have been imposed, price caps and frequency floors are always in force. Furthermore, capacity, the operation period, and the scheduling (to allow travelers to make a round trip within the same day) are also usually required.
In Spain, there are 18 routes with Public Service Obligation, 13 between the Canary Islands, three between the Balearic Islands, one on the Menorca-Madrid route and one between Almeria-Seville. Apart from this, in Spain there are routes where passengers enjoy resident subsidies, i.e. subsidies given to passengers for resident condition on the Canary Islands, Balearic Islands or the autonomous cities of Ceuta and Melilla. These subsidies are not included in the PSO impositions and they imply a 50% price discount in domestic flights. In our study, all Spanish routes enjoy resident discount, but none of these have PSO declarations (we only have routes that connect the mainland with islands, and they do not have PSO declaration).
7
The remaining countries in our study apply PSO and/or subsidies of some kind. Portugal has a similar situation as Spain, i.e., routes with resident discount but no PSO declaration. Currently, there are 21 routes with Public Service Obligations that link the mainland with the islands of Azores and Madeira or inter-island links. Flat fares are established for residents in the Azores (and students) on domestic flights to Madeira or the mainland. Hence, they enjoy subsidies for the difference between the market price and the flat rate. Note that in Portugal discounts have been separate from PSO contracts since 2015.
France has declared a large number and variety of routes with PSO obligations: from routes that connected the mainland with their outermost territory (French Guiana), to another island (Corsica) or even international links (Amsterdam, Madrid or Prague). Specifically, the number of protected routes is 45. Our database includes routes without PSO nor resident discount and routes with both PSO and resident discount. Moreover, the resident discount through a flat rate is inside the PSO declaration.
In contrast, Greek routes have PSO declarations or not, but none has resident discount (only maximum prices for every passenger, resident or not). PSO declarations here have been imposed on 28 routes including routes connecting the main cities in the mainland (and Rhodes) to small islands, and intra-island routes.
Finally, Italy is a different case. There are 22 routes from the main cities in the mainland to the islands with a PSO declaration. Routes with PSO to Sardinia has resident discount included but there are various ways to make the application. There is a flat rate for Sardinian residents. Moreover, this flat rate is different depending on the period of the year: from 16th September to 14th August there is a flat rate for all passengers, resident or
not. The rest of the year there is a discount only for resident passengers. Hence, this periodic change in public aid allows us to control for potential different effects on prices.
In the next section we elaborate on the data used to compare differences in prices between routes with resident subsidies and/or PSO declarations and unprotected routes, and compare price differences between routes with subsidies to all passengers or only for resident passengers. Note here that this enables us to identify differences between countries with different combinations of policies.
8 3. Data
Our unbalanced database includes 187 routes across two seasons in 2016 (339 pairs route-season) from different European national routes between an island and the mainland.3 We
distinguish between routes with PSO declarations and/or subsidies given to passengers because of their resident condition, and routes without PSO nor subsidies. Route fixed effects cannot be included as the degrees of freedom in the estimation would be too low. This is a limitation of our data that must be taken into account.
Table 2. Airlines-routes and season with PSO and subsidies in the database. All routes have an island as endpoint
Routes Routes with PSO resident discount Routes with
Spain 234 0 234 France 67 24 24 Italy 159 30 18 Portugal 20 0 20 Greece 35 4 0 Total airlines-route-season (observations) 515 58 272
Source: own elaboration.
Table 2 includes the number of observations (airlines operating by routes and season). Regarding air routes specifically, the control group in our database is composed of air routes in Italy (63%), France (22%) and Greece (15%). Regarding the treatment group, our database includes routes from Spain (75%), Italy (10%), France (8%), Portugal (6%) and Greece (1%).
This structure of the data will allow us to use an empirical strategy based on how the treated routes fares (i.e. those that are subsidized and/or with PSO declaration) are in relation to the control group (those routes unaffected by subsidies or PSO). We also distinguish between two seasons (winter and summer), so any observation is identified by route (i) and season (s).
The variables included in the database are:
9
1. LnPriceis: is the natural logarithm of the price corresponding to route i and season s. This is the dependent variable in our model. This variable is constructed as the lowest mean round trip price charged by airlines offering services weighted by their corresponding market share. Information has been obtained manually from airlines' websites for a sample week of the summer and winter season in 2016.
We follow these homogeneous rules in the data collection of prices. Price data refer to the city pair link that has as its origin the mainland and destination on an island. Additionally, it has been collected one month before travelling, the price refers to the first trip of the week, and the return is the last trip of the week. With this procedure, we can exploit the variability of data across routes because we obtain data in homogeneous conditions for all the routes in our sample. Note that we do not have information about the proportion of business and leisure travelers for the routes under consideration. However, as we mention above, all considered routes are domestic links between an island with significant tourist flows and a large or medium-sized city from the mainland. Thus, we can expect that the proportion of business/leisure travelers is similar.4
To explain the corresponding price for each route we take as explanatory variables the following:
2. LnSeatsis: is the natural logarithm of the seats corresponding to route i and season s in the month of travel (March or July). Data are drawn from RDC aviation (Innovata Data).
This variable may be showing an endogenous relationship with the explained variable, so we have implemented instrumental variables in the estimation of equation [1] through the following variable as instrument: the logarithm of the average population between origin and destination (NUTS 3 regions) of route i in 2015, using data from Eurostat.
We have also run regressions using as additional instruments the logarithm of the average arrivals at tourist accommodation establishments between origin and destination, and the logarithm of the average gross domestic product (GDP) per inhabitant at current
4 Having said this, the lack of information about the proportion of business/leisure travelers is a potential
shortcoming of our data to take into account in the interpretation of results. In this regard, we could assume that some routes in the treatment group have lower participation of business travelers. If we do not match those routes with control routes that have similar participation of last-minute business travelers, then the average price of those routes may be lower than other routes simply because on those routes prices increase quickly only a few days before departure. In other words, leisure-related routes may be relatively more expensive than business-related routes if we collect fare data one month before travelling. If treatment routes are more leisure-related routes, then the imposition of PSO may be wrongly associated with higher prices.
10
market prices. However, these additional instruments do not pass the test of over-identifying restrictions.
3. Ln HHI seatsit: logarithm of the Herfindahl–Hirschman index on route i, which is defined as the sum of the squares of the market shares of airlines operating the route through number of seats offered by airlines. Data are drawn from RDC aviation (Innovata Data). The maximum value of the index is 1 (that corresponds to a monopoly, i.e., the greater the index the lower the level of competition) and this index is a standard way to measure the level of concentration in a determined market. In the case that competition reduces prices charged by airlines, the sign of the coefficient associated to this variable should be negative. However, this variable may also work as a proxy for the profitability of operating on the route as it may be correlated with the levels of demand on the route or omitted factors that influence such profitability.
4. Low Costi: binary variable that takes value 1 if a low-cost airline operates a route i. A negative sign is expected for the coefficient associated with this variable. These kinds of airlines usually fix very low charges, thus inducing other route competitors to reduce prices. Indeed, the downward pricing pressure that low-cost airlines exert on the routes they operate is well documented in the literature (e.g., Morrison, 2001; Goolsbee and Syverson, 2008; Hofer et al., 2008; Oliveira and Huse, 2009).
5. Ln distancei: logarithm of the number of kilometers between origin and destination of the route i. Route length is a major determinant of airline costs and its coefficient is expected to be positive and lower than one. This means that the increase in costs is less than proportional to the increase in the number of kilometers flown. Long-haul routes involve higher average speeds, less intense consumption of fuel, and lower airport charges per kilometer. Data for this variable are also drawn from RDC aviation (Innovata Data). 6. Season: binary variable that takes value 0 in winter season and 1 in summer season for route i. Its coefficient is expected to be positive because of the high demand in this period. 7. Seven variables are included in order to control the effect of the varying policies applied by different countries. Route with aid Spain and Route with aid Portugal take value 1 if the route is subsidized. Route with aid Greece takes value 1 if the route is under PSO obligation. Route with aid France and Route with aid Italy take value 1 if the route is under PSO obligation jointly with subsidies.
Moreover, in Model 2 we divided the Italian variable into two: Italy all (that takes value 1 if the route is under discount for every passenger) and Italy only resident (that takes value 1 if
11
the route is under discount only for resident passengers). These variables show us the relative change of these treated routes in relation to the control group (routes without subsidies or PSO declarations). Moreover they also show the differences between countries and hence between different policies.
Firstly, discounts given to island residents may have different effects on prices (without discounts). On the one hand, the discount should increase the amount of traffic on the route (by residents). Second, these discounts make the demand of island residents less elastic and, as a consequence, airlines can set higher mark-ups, so they may increase prices (Calzada and Fageda, 2012). On the other hand, airlines may be forced to incorporate the subsidy to the price (without discount) if they are operating in a competitive context. Indeed, the subsidy may increase the number of airlines offering flights in the route given the increased demand. This effect can be in part captured by the variable of concentration on the route (the HHI index). Overall, the subsidy may have an effect both on demand and supply, so that the expected effect on airlines behavior is not clear a priori.
Following Fageda et al. (2016), there is an effect that only could be captured through variables that distinguish between residents and non-residents, but unfortunately this information is unavailable. We have to take into account that on subsidized routes there are two types of passengers with varying willingness to pay, so regardless of the impact of discounts on demand and supply, prices could be lower with the discounts. As the discount only affects one of the two types of passengers (the island's residents) resident demand increases but at the expense of the non-resident passengers that can be expelled from the market. This may lead to lower demand and prices. However, the comparison between subsidized and non-subsidized routes may indirectly capture such an effect.
In any case, as we mention above, previous studies for Spain suggest that prices on routes subject to resident discounts may be higher (Calzada and Fageda, 2012; Fageda et al., 2012).
Secondly, the effects of PSO declaration are not so clear, because there are different types of regulation depending on the declaration, so predicting the effects is not a straightforward exercise. However, the objective of PSO policies is to prevent prices on protected routes being higher than those on unprotected routes. Hence, the sign and statistical significance of the PSO variables may provide evidence about the effectiveness of these policies. In this regard, Calzada and Fageda (2012) provide evidence for Spain in favor of the hypothesis that PSO declarations have reduced prices in relation to unprotected routes.
12
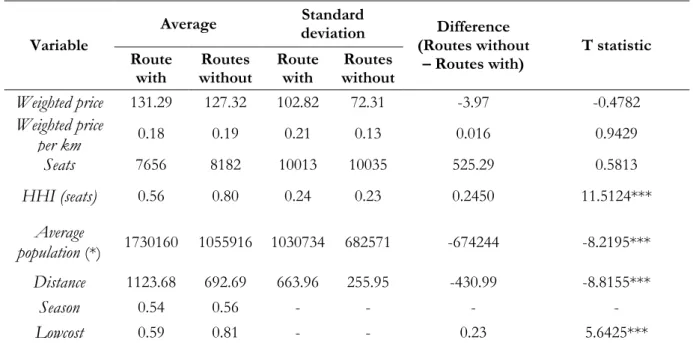
Table 3 includes some descriptive statistics and a T-test of the database at route level. We split each data on both subsidized (treated) and non-subsidized routes (control group).
13
Table 3. T-test analysis and descriptive statistics. Database by route Variable
Average deviation Standard Difference (Routes without
– Routes with) T statistic Route
with without Routes Route with without Routes
Weighted price 131.29 127.32 102.82 72.31 -3.97 -0.4782 Weighted price per km 0.18 0.19 0.21 0.13 0.016 0.9429 Seats 7656 8182 10013 10035 525.29 0.5813 HHI (seats) 0.56 0.80 0.24 0.23 0.2450 11.5124*** Average population (*) 1730160 1055916 1030734 682571 -674244 -8.2195*** Distance 1123.68 692.69 663.96 255.95 -430.99 -8.8155*** Season 0.54 0.56 - - - - Lowcost 0.59 0.81 - - 0.23 5.6425***
Source: own elaboration. Note: Route with= route with some public aid; Route without= route with any public aid. (***) T-test between two groups shows statistical significance.
All average values for the variables included in the database show statistical differences using the T-student test of means, excepting those related to prices (weighted price and weighted price per kilometer) and seats. Thus we have to control all covariates simultaneously in order to test whether prices are different on both routes (with and without public aid).
Our empirical strategy is based on the implementation of two complementary techniques: an instrumental variables procedure and a matching analysis. The instrumental variable procedure allows us to control for the bias related with the simultaneous determination of the dependent variable and endogenous explanatory variables. A key issue here is to find appropriate instruments that meet the exogeneity and strength conditions. In our context, the potential endogenous explanatory variable is the variable of seats, which is a control variable (not the treatment variable), and population of route endpoints, which seems to work well as an instrument.
The main disadvantage of the instrumental variables procedure is that it may not control appropriately for pre-existing differences between treatment and control routes. This is the main advantage of the matching analysis. The disadvantage of the matching analysis is that it implies working with a reduced sample (treated and control routes with comparable characteristics) so that the number of observations is lower than in the analysis with instrumental variables. Another limitation of the matching estimator is that it relies on an
14
assumption of conditional independence of potential outcomes and treatment assignment given observables. This implies that selection into treatment is driven solely by factors observable by the researcher (see Heckman et al, 1997). This is the main reason that it is a complementary analysis to the previous instrumental variable estimations.
4. Instrumental variables estimation
As we mentioned above, we first implement an Instrumental Variables procedure to analyze the effects of each type of subsidy program on prices.
We implement an Instrumental Variables estimator because there may be a simultaneous determination of prices and seats, as we previously mentioned. This strategy requires the use of instruments that must be correlated with the instrumented variable and which should not be endogenous. In this regard, we include the following variable as an instrument; the mean population of both endpoints of the route. Our empirical analysis is based on the estimation of the following pricing equation for the route I in season s:
LnPriceis 0 1LnSeatsis2LnHHIseatsis 3Routewithaid _ Italyis 4Routewithaid _ Francei 5Routewithaid _ Greecei
6Routewithaid _ Spaini 7Routewithaid _ Portugali 8LnDistancei 9Seasons 10Lowcosti is
[1]
We estimate two models. The first is precisely the previous equation. The second splits routes with aid in Italy into two different variables: Itally_All, that takes value 1 if it is a route where public aid is granted for all fliers; and Italy_Only residents, a binary variable that take value 1 if the route received public aid only for residents. These two variables control for potential divergence in prices by airlines depending on which passengers benefit from public aid.
Note that we have run regressions including country-specific effects separately from the policy variables. However, multicollinearity prevents us from identifying the effect on prices of each of the considered countries. Results of this regression are similar to those for the regression that do not include separate country dummies. However, we have preferred to report just the regression without the country binary variables as we cannot identify the effect for all countries.
15
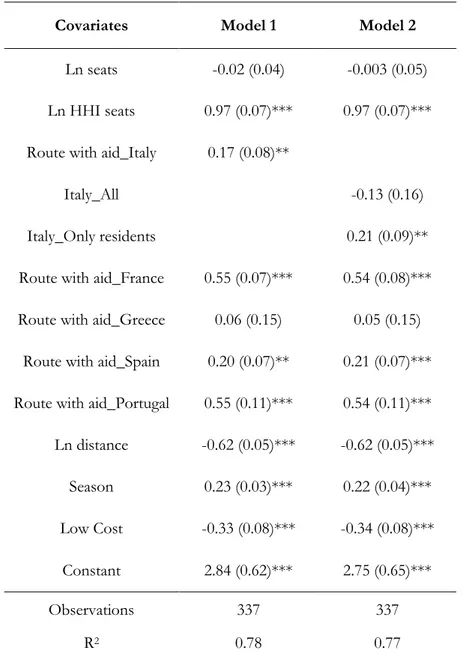
Table 4. Price equation using panel data estimations with instrumental variables Covariates Model 1 Model 2
Ln seats -0.02 (0.04) -0.003 (0.05)
Ln HHI seats 0.97 (0.07)*** 0.97 (0.07)***
Route with aid_Italy 0.17 (0.08)**
Italy_All -0.13 (0.16)
Italy_Only residents 0.21 (0.09)**
Route with aid_France 0.55 (0.07)*** 0.54 (0.08)***
Route with aid_Greece 0.06 (0.15) 0.05 (0.15)
Route with aid_Spain 0.20 (0.07)** 0.21 (0.07)***
Route with aid_Portugal 0.55 (0.11)*** 0.54 (0.11)***
Ln distance -0.62 (0.05)*** -0.62 (0.05)*** Season 0.23 (0.03)*** 0.22 (0.04)*** Low Cost -0.33 (0.08)*** -0.34 (0.08)*** Constant 2.84 (0.62)*** 2.75 (0.65)*** Observations 337 337 R2 0.78 0.77
Note 1: *** 1%, ** 5%, *10% significance test. Standard errors among brackets. Note 2: Seats have been estimated using the following instrument: mean population of both endpoints of the route.
The overall explanatory power is high (R2=0.78). Note that the instrument passes the under-identification test (Kleibergen-Paap rk LM statistics); the test reports 28.901*** in model 1 and 23.565*** respectively in model 2. It also passes the weak identification test (Cragg-Donald Wald F statistic); the test reports 79.72*** in model 1 and 63.30*** in model 2. Moreover we implement the Breusch-Pagan test and it indicates that linear forms of heteroskedasticity are not present and therefore standard errors are not biased. However, errors are robust to heterokedasticity (robust option by Stata is used).
16
Results for the control variables confirm the a priori expectations. In this regard, we find some evidence that airlines may exploit density economics on denser routes. Indeed, the coefficient associated with the variable for the number of seats (which is a proxy of the demand on the route) is negative. However, it is not statistically significant so that density economies in our sample seem to play a modest role. Furthermore, the Herfindahl-Hirschmann index positively affects prices. This outcome implies that the weaker the competition on the route, the higher the price. Another expected result is that the presence of low-cost airlines leads to lower prices, as the dummy variable that identifies it is negative and statistically significant.
We also confirm the existence of strong distance economies; the coefficient of the distance variable is negative and lower than one. Finally, prices are higher in the summer season, which may be interpreted as a greater willingness of travelers to pay in the summer or higher load factors. Recall that routes in our sample include islands with significant flows of tourists, so that it may be expected that demand is higher in the summer.
Regarding the policy variables, we do not find evidence that routes with price caps have lower prices than on the other routes. In fact, in our sample, routes with public aid in France and Italy have higher prices than in the control group routes. Recall that these routes are subject to PSO that put limits on the maximum prices that airlines may charge. Only in the case of Greece is it found that prices on routes with public aid do not seem to differ to those charged on other routes. Note that the magnitude of the coefficients in Spain, where routes with public aid are not restricted by PSO, is even lower than in France and similar than in Italy.
We also find that prices are substantially higher on routes affected by resident discounts. Indeed, the coefficient of the variables that identify routes with public aid in France, Portugal and Spain are positive and statistically significant. This is also the case on Italian routes where only residents enjoy flat rates (see coefficient of the variable Italy_Only residents). In contrast, we do not find a clear impact on the market prices of subsidies that affect all travelers regardless of whether they are residents or not on islands. In this regard, the coefficient of the variable for protected routes in Greece is not statistically significant while the coefficient of the variable for protected routes in Italy where subsidies do not discriminate between residents and non-residents is not statistically significant (variable Italy_All).
17
We also find some evidence that flat rates tend to lead to higher prices than discounts over market fares. In this regard, the magnitude of the coefficient is much higher for France and Portugal (which apply flat rates) in relation to Spain (which applies discounts). However, differences between Italy (that apply flat rates) and Spain are minimal.
18 5. Matching analysis
In this section, we estimate the effect of public aid on prices using matching techniques. Academic literature has been referred to as unconfoundedness, exogeneity, ignorability or selection on observables when regression models have been used. However comparisons made between treated and control groups remove any self-selection bias. Adjusting treatments and control groups for differences in covariates, or pretreatment variables, is the key to obtaining the causal inference of effects, as matching analysis seeks to do (see Rubin, 1974 or Rosenbaum and Rubin, 1983).
Let Y1 represent the outcome (here, price and price per kilometre set by an airline) in the case of a unit (a route) exposed to treatment (some public aid). By analogy, Y0 is the outcome if the unit is not exposed to treatment (D=0).
Our interest is defined by the difference between Y1 and Y0. In our specific case, we are interested in estimating the average effect on prices per kilometre set by airlines of routes affected by public aid, which can be defined as:
E Y
1 Y0 D 1
A set of observable characteristics (Z) affects both treatment status and potential outcomes. Using the conditional independence assumption and a requirement for identification, the Average Treatment effect on the Treated (hereafter, ATT) can be identified as:
ATT E Y
1 Y0 D 1
E E Y
1 Y0 D 1,Z
E E Y
1 D 1,Z
E Y
0 D 0,Z
D 1
In this case, our unit of observation is the pair airline-route (instead of the route, as in previous estimations we have made). For this reason, the use of matching estimator pairs up treatment routes (airlines on routes WITH some public aid) with control routes (airlines on routes WITHOUT public aid) that have similar observed attributes. This is one of the main advantages of this matching analysis in contrast to the former empirical approach.
We estimate the effect of the treated routes on endogenous variable (prices) based on all explanatory observables using a sub-sample where control routes have similar characteristics to treated routes. Hence, the matching analysis controls for pre-existing differences between treated and control routes. In this case, the explanatory variables used
19
were: distance, season, low-cost binary variable, average population and the Herfindahl-Hirschmann index on seats.
The main issue here is whether differences in pre-existing characteristics of treated and control routes may distort our results. In order to work with a sample with comparable treated and control routes, we have calculated the average treatment effect on the treated routes by using the Kernel Matching method.5 The estimation has been done using the
bootstrap option and 1,000 repetitions.
Table 5 summarizes the matching estimator outcome. We consider two general differentiations: firstly, routes with discounts to residents versus the control group. And secondly, routes with aid to all passengers (residents and no-residents) versus the control group.
Moreover, we also estimate by considering all sample, and a subsample of the data that only include firms that operate in both treated and control group routes. The latter seeks to control for potential variations in behaviour of these firms between these two routes.
5 Four of the most widely matching methods are the Nearest Neighbor, Radius, Stratification and Kernel.
20
Table 5. ATT estimation on prices per km. Kernel Matching. Bootstrapped standard errors.
Note 1: ** 5%, *** 1% significance test. T-test in brackets.
Note 2: Covariates used were: distance, season, low-cost binary variable, average population and the Herfindahl-Hirschmann index on seats.
Matching estimations yield to a general outcome: a scheme that affects only residents has a positive effect on prices and prices per km, while those schemes that do not discriminate among consumers do not change those prices, because they (matchings included in row 5 to 7) do not show statistically significant differences between the treatment and control group, and also between the sample and the subsample.
In fact, using both the average price and price per kilometre these results imply that they are on routes with aid to residents close to 38 and 12 per cent higher than on control group routes (see different outcomes depending sample and prices considered).
As we have mentioned above, results for the other routes (those that consider all fliers) are not statistically significant. The difference on outcomes between the two kinds of route results support the general outcome found in the previous estimations.
21 6. Conclusions
In this paper, we have estimated a pricing equation to identify the effects on prices of different policies applied in five European countries on domestic routes that link the mainland with islands.
Results of our analysis provide some evidence that PSO policies are not effective in containing prices, which means that the established price cap does not seem to be lower than airlines would fix in a free market context. Note here that PSO usually implies limiting entry on the route to the airline that meets the service levels and fares imposed in the declaration. Furthermore, regional airlines are usually those that win the tender. In this regard, low-cost airlines are able to operate with lower costs than regional airlines, especially when routes are not very short.
Furthermore, we find that routes subject to price discounts to residents increase market prices so that some cross-subsidization from residents to non-residents seems to take place. In this context, note that most of these routes are highly dependent on tourism, so that higher prices for non-residents could have a negative effective on the economic activity of the islands.
To this point, our data have some limitations as we only have available information for two seasons so that route fixed effects cannot be considered and we only have one instrument for the potential endogenous explanatory variable. Hence, further research with a full panel data set and more instruments may be needed to confirm the results of this paper.
In any case, our analysis draws into question the suitability of these policies. Regarding this point, it is important to mention that many of the routes affected by subsidies are high density routes. This is especially the case in France, Italy and Spain. On these dense routes, airlines may be able to offer services with a reasonable service and affordable prices without the need for subsidies. For this reason low-cost airlines have concentrated a significant part of their business on tourist routes.
Alternative policies that could be applied to ensure air services in domestic routes that link islands with the mainland are to provide funds for investments in airports or active competition policies that avoid the exploitation of market power in routes where alternative transportation modes are not an option. These policies have the advantage that they do not create fare distortions offered by airlines on the route.
22 References
Albalate, D. and X. Fageda, (2016). “High-tech employment and transportation: Evidence from the European regions, Regional Studies, 50 (9), 1564-1578.
Angelopoulos, J., C. Chlomoudis, P. Christofas, and S. Papadimitriou (2013). Cost Assessment of Sea and Air Transport PSO Services: The Case of Greece, International Journal of Maritime, Trade & Economic Issues, I (2), 3-40.
Becker, S. and A. Ichino, (2002), Estimation of average treatment effects based on propensity scores. The Stata Journal 2002, 2, 358-377.
Bel, G. and X. Fageda (2008). Getting there fast, Globalization, intercontinental flights and location of headquarters, Journal of Economic Geography, 8 (4), 471-495.
Bilotkach, V. 2015. Are Airports Engines of Economic Development? A Dynamic Panel Data Approach, Urban Studies 52 (9), 1577-1593.
Brueckner, J. (2003), Airline traffic and urban economic development, Urban Studies, 40 (8), 1455-1469.
Cabrera, M., O. Betancor and J.L. Jiménez (2011). “Subsidies to air transport passengers: efficiency of the European policy practice, Paper presented at the 7th International Forum on Air Transport in Remoter Regions. Newquay (United Kingdom).
Calzada, J. and X. Fageda (2012), Discount and Public Service Obligation in the Airline Market: Lesson from Spain, Review of Industrial Organization, 40, 291-312.
Calzada, J. and X. Fageda (2014), Competition and public service obligations in European aviation markets, Transportation Research Part A: Policy and Practice, 70, 104-116.
CEC, 1992. Regulation. No 2407/92 on Access for Community Air Carriers to Intra-Community Air Routes. Commission of the European Communities, Brussels, Belgium. CEC, 2008. Regulation. No 1008/2008 of the European Parliament and of the Council of
24 September 2008 on Common Rules for the Operation of Air Services in the Community (recast). Commission of the European Communities, Brussels, Belgium. CEC, 2015. List of Routes Concerned Updated on 18/12/2015. Commission of the
European Communities, Brussels, Belgium.
Di Francesco, A. and R. Pagliari (2012), The potential impact of removing public service obligation regulations on air fares between the Italian Mainland and the island of Sardinia, Journal of Transport Geography, 24, 332-339.
Fageda, X. (forthcoming). International air travel and foreign direct investments: Evidence from Barcelona, Journal of Regional Science.
Fageda, X., J.L. Jiménez, and C. Díaz (2012), Fare differences between domestic and international air markets on routes from Gran Canaria, Journal of Air Transport Management, 25, 8-10.
Fageda, X., J.L. Jiménez, and J. Valido (2016). Does an increase in subsidies lead to changes air fares? Empirical evidence from Spain. Transportation Research-A, 94, 235-242.
Green, R. K. (2007), Airports and Economic Development, Real Estate Economics, 35 (1), 91–112.
23
Goldsbee, A., C. Syverson (2008). How do incumbents respond to the threat of entry? Evidence from the major airlines, The Quarterly Journal of Economics, 123, 1611-1633. Heckman, J.J., H. Ichimura, and Todd, P.E. (1997). Matching as an econometric evaluation
estimator: evidence from evaluating a job training programme, Review of Economic Studies, 64, 605-654.
Hofer, C., R. J. Windle, and M. E. Dresner (2008). Price premiums and low cost carrier competition, Transportation Research-E, 44 (5), 864-882.
Lian, J. (2010), Network dependency and airline competition. Consequences for remote areas in Norway, Journal of Air Transport Management, 16, 137-143.
Lian J., and J. Ronnevik (2011), Airport competition. Regional airports losing ground to main airports, Journal of Transport Geography, 19, 85-92.
Merkert, R. and B.O. Fee (2013), Efficient procurement of public air services. Lessons learned from European transport authorities perspectives, Transport Policy, 29, 118-125 Merkert, R. and G. Williams (2013), Determinants of European PSO airline efficiency:
Evidence from a semi-parametric approach, Journal of Air Transport Management, 29, 11-16.
Morrison, S.A (2001). Actual, Adjacent and potential competition: Estimating the full effect of Southwest airlines, Journal of Transport Economics and Policy, 35, 239-256.
Oliveira, A.V.M. and C. Huse (2009). Localized competitive advantage and price reactions to entry: Full-service vs. low-cost airlines in recently liberalized emerging markets, Transportation Research-E, 45, 307–320.
Percoco, M. (2010), Airport Activity and Local Development, Evidence from Italy, Urban Studies, 47 (11), 2427, 2443.
Pita, J.P., N. Adler and A.P. Antunes (2014), Socially-oriented flight scheduling and fleet assignment model with an application to Norway, Transportation Research Part B, 61 17-32. Pita, J.P., A. P. Antunes, C. Barnhart, and A.G. de Menezes (2013), Setting public service obligations in low-demand air transportation networks: Application to the Azores, Transportation Research Part A, 54, 35–48.
Rosenbaum, P., and D. Rubin (1983), The central role of the propensity score in observational studies for causal effects. Biometrika, 70, 41-55.
Rubin, D. (1974), Estimating causal effects of treatments in randomised and non-randomised studies. Journal of Educational Psychology, 66, 688-701
Santana, I. (2009), Do public service obligations hamper the cost competitiveness of regional airlines? Journal of Air Transport Management, 15, 344-349.
Sheard, N. (2014), Airports and urban sectoral employment, Journal of Urban Economics, 80, 133-152.
Valido, J., M.P. Socorro, A. Hernández and O. Betancor (2014), Air transport subsidies for resident passengers when carriers have market power, Transportation Research Part E, 70, 388-399.
Williams, G. (2010). European Experience with Direct Subsidization of Air Services. Public Money and Management, 25, 155–161.
24
Williams, G., and R. Pagliari, (2004). A comparative analysis of the application and use of public service obligations in air transport within the EU. Transport Policy, 11,55–66. Wittman, M.D., F. Allroggen, and R. Malina (2016), Public Service Obligations for Air
Transport in the United States and Europe: Connectivity Effects and Value for Money. Transportation Research-A, 94, 112-126.
25 Appendix
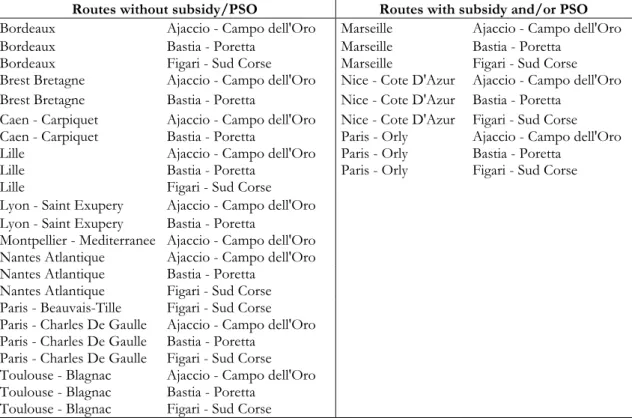
Table A1: List of routes included in the sample (France)
Routes without subsidy/PSO Routes with subsidy and/or PSO
Bordeaux Ajaccio - Campo dell'Oro Marseille Ajaccio - Campo dell'Oro Bordeaux Bastia - Poretta Marseille Bastia - Poretta
Bordeaux Figari - Sud Corse Marseille Figari - Sud Corse Brest Bretagne Ajaccio - Campo dell'Oro Nice - Cote D'Azur Ajaccio - Campo dell'Oro Brest Bretagne Bastia - Poretta Nice - Cote D'Azur Bastia - Poretta
Caen - Carpiquet Ajaccio - Campo dell'Oro Nice - Cote D'Azur Figari - Sud Corse Caen - Carpiquet Bastia - Poretta Paris - Orly Ajaccio - Campo dell'Oro Lille Ajaccio - Campo dell'Oro Paris - Orly Bastia - Poretta
Lille Bastia - Poretta Paris - Orly Figari - Sud Corse Lille Figari - Sud Corse
Lyon - Saint Exupery Ajaccio - Campo dell'Oro Lyon - Saint Exupery Bastia - Poretta
Montpellier - Mediterranee Ajaccio - Campo dell'Oro Nantes Atlantique Ajaccio - Campo dell'Oro Nantes Atlantique Bastia - Poretta
Nantes Atlantique Figari - Sud Corse Paris - Beauvais-Tille Figari - Sud Corse
Paris - Charles De Gaulle Ajaccio - Campo dell'Oro Paris - Charles De Gaulle Bastia - Poretta
Paris - Charles De Gaulle Figari - Sud Corse
Toulouse - Blagnac Ajaccio - Campo dell'Oro Toulouse - Blagnac Bastia - Poretta
Toulouse - Blagnac Figari - Sud Corse
Table A2: List of routes included in the sample (Greece)
Routes without subsidy/PSO Routes with subsidy and/or PSO
Alexandroupolis - Demokritos Sitia Athens - Eleftherios Venizelos International Karpathos Athens - Eleftherios
Venizelos International Chania International
Athens - Eleftherios Venizelos
International Sitia Athens - Eleftherios
Venizelos International Heraklion - N. Kazantzakis Thessaloniki International Kerkyra - I. Kapodistrias Athens - Eleftherios
Venizelos International Kerkyra - I. Kapodistrias Athens - Eleftherios
Venizelos International Mikonos Athens - Eleftherios
Venizelos International Diagoras
Preveza - Aktion Kerkyra - I. Kapodistrias Preveza - Aktion Sitia
Thessaloniki International Chania International Thessaloniki International Heraklion - N. Kazantzakis Thessaloniki International Diagoras
26
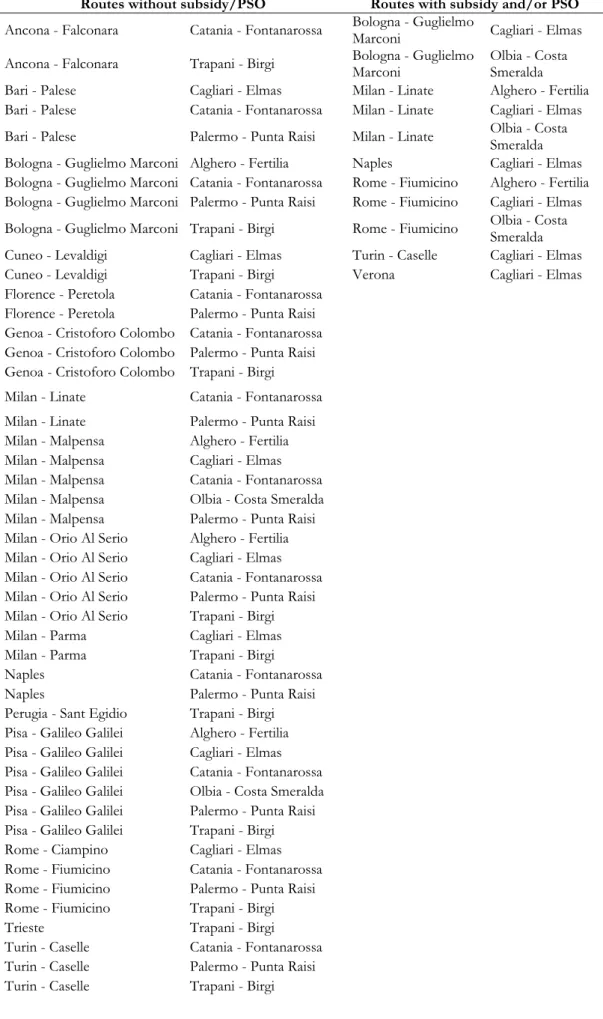
Table A3: List of routes included in the sample (Italy)
Routes without subsidy/PSO Routes with subsidy and/or PSO
Ancona - Falconara Catania - Fontanarossa Bologna - Guglielmo Marconi Cagliari - Elmas Ancona - Falconara Trapani - Birgi Bologna - Guglielmo Marconi Olbia - Costa Smeralda Bari - Palese Cagliari - Elmas Milan - Linate Alghero - Fertilia Bari - Palese Catania - Fontanarossa Milan - Linate Cagliari - Elmas Bari - Palese Palermo - Punta Raisi Milan - Linate Olbia - Costa Smeralda Bologna - Guglielmo Marconi Alghero - Fertilia Naples Cagliari - Elmas Bologna - Guglielmo Marconi Catania - Fontanarossa Rome - Fiumicino Alghero - Fertilia Bologna - Guglielmo Marconi Palermo - Punta Raisi Rome - Fiumicino Cagliari - Elmas Bologna - Guglielmo Marconi Trapani - Birgi Rome - Fiumicino Olbia - Costa Smeralda Cuneo - Levaldigi Cagliari - Elmas Turin - Caselle Cagliari - Elmas Cuneo - Levaldigi Trapani - Birgi Verona Cagliari - Elmas Florence - Peretola Catania - Fontanarossa
Florence - Peretola Palermo - Punta Raisi Genoa - Cristoforo Colombo Catania - Fontanarossa Genoa - Cristoforo Colombo Palermo - Punta Raisi Genoa - Cristoforo Colombo Trapani - Birgi Milan - Linate Catania - Fontanarossa Milan - Linate Palermo - Punta Raisi Milan - Malpensa Alghero - Fertilia Milan - Malpensa Cagliari - Elmas Milan - Malpensa Catania - Fontanarossa Milan - Malpensa Olbia - Costa Smeralda Milan - Malpensa Palermo - Punta Raisi Milan - Orio Al Serio Alghero - Fertilia Milan - Orio Al Serio Cagliari - Elmas Milan - Orio Al Serio Catania - Fontanarossa Milan - Orio Al Serio Palermo - Punta Raisi Milan - Orio Al Serio Trapani - Birgi Milan - Parma Cagliari - Elmas Milan - Parma Trapani - Birgi Naples Catania - Fontanarossa Naples Palermo - Punta Raisi Perugia - Sant Egidio Trapani - Birgi Pisa - Galileo Galilei Alghero - Fertilia Pisa - Galileo Galilei Cagliari - Elmas Pisa - Galileo Galilei Catania - Fontanarossa Pisa - Galileo Galilei Olbia - Costa Smeralda Pisa - Galileo Galilei Palermo - Punta Raisi Pisa - Galileo Galilei Trapani - Birgi Rome - Ciampino Cagliari - Elmas Rome - Fiumicino Catania - Fontanarossa Rome - Fiumicino Palermo - Punta Raisi Rome - Fiumicino Trapani - Birgi
Trieste Trapani - Birgi
Turin - Caselle Catania - Fontanarossa Turin - Caselle Palermo - Punta Raisi Turin - Caselle Trapani - Birgi
27 Venice - Marco Polo Cagliari - Elmas Venice - Marco Polo Catania - Fontanarossa Venice - Marco Polo Olbia - Costa Smeralda Venice - Marco Polo Palermo - Punta Raisi Venice - Treviso Cagliari - Elmas Venice - Treviso Catania - Fontanarossa Venice - Treviso Palermo - Punta Raisi Venice - Treviso Trapani - Birgi Verona Catania - Fontanarossa Verona Palermo - Punta Raisi
Table A4: List of routes included in the sample (Portugal)
Routes with subsidy and/or PSO
Lisbon Madeira
Lisbon Ponta Delgada - João Paulo II
Porto Madeira
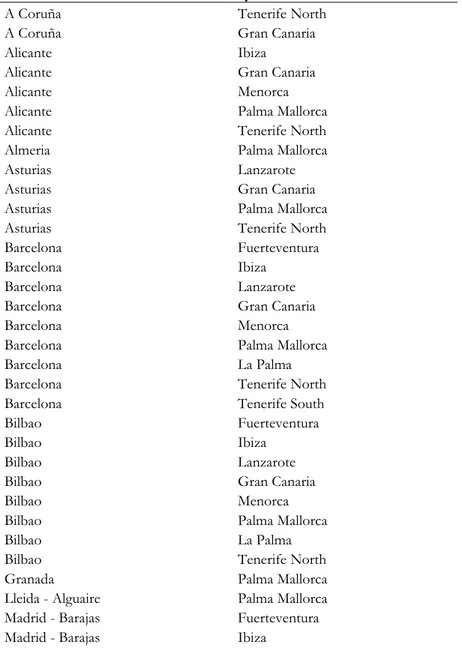
Porto Ponta Delgada - João Paulo II Table A5: List of routes included in the sample (Spain)
Routes with subsidy and/or PSO
A Coruña Tenerife North
A Coruña Gran Canaria
Alicante Ibiza
Alicante Gran Canaria
Alicante Menorca
Alicante Palma Mallorca
Alicante Tenerife North
Almeria Palma Mallorca
Asturias Lanzarote
Asturias Gran Canaria
Asturias Palma Mallorca
Asturias Tenerife North
Barcelona Fuerteventura
Barcelona Ibiza
Barcelona Lanzarote
Barcelona Gran Canaria
Barcelona Menorca
Barcelona Palma Mallorca
Barcelona La Palma
Barcelona Tenerife North
Barcelona Tenerife South
Bilbao Fuerteventura
Bilbao Ibiza
Bilbao Lanzarote
Bilbao Gran Canaria
Bilbao Menorca
Bilbao Palma Mallorca
Bilbao La Palma
Bilbao Tenerife North
Granada Palma Mallorca
Lleida - Alguaire Palma Mallorca Madrid - Barajas Fuerteventura Madrid - Barajas Ibiza
28
Madrid - Barajas Lanzarote Madrid - Barajas Gran Canaria Madrid - Barajas Palma Mallorca Madrid - Barajas La Palma Madrid - Barajas Tenerife North Madrid - Barajas Tenerife South
Malaga Fuerteventura
Malaga Ibiza
Malaga Lanzarote
Malaga Gran Canaria
Malaga Palma Mallorca
Malaga Tenerife North
Malaga Tenerife South
Santander Tenerife South
Santander Tenerife North
Santiago De Compostela Fuerteventura Santiago De Compostela Lanzarote Santiago De Compostela Gran Canaria Santiago De Compostela Palma Mallorca Santiago De Compostela Tenerife North Santiago De Compostela Tenerife South Sevilla - San Pablo Ibiza
Sevilla - San Pablo Lanzarote Sevilla - San Pablo Gran Canaria Sevilla - San Pablo Menorca Sevilla - San Pablo Palma Mallorca Sevilla - San Pablo Tenerife North Sevilla - San Pablo Tenerife South
Valencia Ibiza
Valencia Gran Canaria
Valencia Menorca
Valencia Palma Mallorca
Valencia Tenerife North
Valencia Tenerife South
Vigo Gran Canaria