UNIVERSITY
OF TRENTO
DIPARTIMENTO DI INGEGNERIA E SCIENZA DELL’INFORMAZIONE
38050 Povo – Trento (Italy), Via Sommarive 14
http://www.disi.unitn.it
A LARGE SCALE DATASET FOR THE
EVALUATION OF ONTOLOGY MATCHING SYSTEMS
Fausto Giunchiglia, Mikalai Yatskevich, Paolo Avesani
and Pavel Shvaiko
January 2008
Technical Report # DISI-08-001
DOI: 10.1017/S000000000000000 Printed in the United Kingdom
A Large Scale Dataset for the
Evaluation of Ontology Matching Systems
FAUSTO GIUNCHIGLIA
1, MIKALAI YATSKEVICH
1, PAOLO AVESANI
2and
PAVEL SHVAIKO
11Department of Information Engineering and Computer Science (DISI), University of Trento, Trento, Italy
E-mail:{fausto,yatskevi,pavel}@disi.unitn.it
2Fondazione Bruno Kessler, Trento, Italy
E-mail: [email protected]
Abstract
Recently, the number of ontology matching techniques and systems has increased significantly. This makes the issue of their evaluation and comparison more severe. One of the challenges of the ontology matching evaluation is in building large scale evaluation datasets. In fact, the number of possible correspondences between two ontologies grows quadratically with respect to the numbers of entities in these ontologies. This often makes the manual construction of the evaluation datasets demanding to the point of being infeasible for large scale matching tasks. In this paper we present an ontology matching evaluation dataset composed of thousands of matching tasks, called TaxME2. It was built semi-automatically out of the Google, Yahoo and Looksmart web directories. We evaluatedTaxME2by exploiting the results of almost two dozen of state of the art ontology matching systems. The experiments indicate that the dataset possesses the desired key properties, namely it is error-free, incremental, discriminative, monotonic, and hard for the state of the art ontology matching systems.
1 Introduction
Ontology matching is a critical operation in many applications, including ontology engineering, infor-mation integration, peer-to-peer inforinfor-mation sharing, navigation and query answering on the web [15]. It takes two graph-like structures as input, for instance, lightweight ontologies [20], such as Google1 and Yahoo2 web directories, and produces as output an alignment, that is a set of correspondences between the semantically related nodes of those graphs.
Many diverse solutions of matching have been proposed so far, see [40, 8, 36, 30, 39] for recent surveys, while some examples of individual approaches addressing the matching problem can be found in [26, 48, 46, 38, 28, 32, 18, 10, 37, 17, 5, 9, 7, 33]3. Finally, ontology matching has been given a book account in [15]. The rapid growth of various matching approaches makes the issues of their evaluation and comparison more severe. In order to address these issues, in 2005 the Ontology Alignment Evaluation Initiative - OAEI4was set up, which is a coordinated international initiative that organizes the evaluation of the increasing number of ontology matching systems. The main goal of OAEI is to support the comparison of the systems and algorithms on the same basis and to allow anyone to draw conclusions about the best matching strategies [43].
One of the challenges of the ontology matching evaluation is how to build large scale evaluation datasets; specifically, a large set of reference correspondences or reference alignments against which the
1http://www.google.com/Top/
2http://dir.yahoo.com/
3
See http://www.ontologymatching.org for a complete information on the topic.
4
results produced by ontology matching systems are to be compared. Notice that the number of possible correspondences grows quadratically with the number of entities to be compared. This often makes the manual construction of the reference correspondences demanding to the point of being infeasible for large scale matching tasks.
The contributions of this paper are:
• a method for building semi-automatically large datasets enabling the assessment of quality results produced by ontology matching systems,
• the TaxME2 dataset composed of 4.639 matching tasks, which have been built out of the Google,
Yahoo and Looksmart web directories,
• an evaluation of the dataset within the OAEI campaigns of 2005, 2006 and 2007 with encouraging results, thus demonstrating empirically its strength.
This paper is an expanded and updated version of an earlier conference paper [2], which originally provided theTaxMEmethod, the corresponding dataset and its preliminary evaluation. The key limitation
ofTaxMEwas that it allowed for assessing the Recall indicator only, which is a completeness measure.
The most important extensions of this paper over the previous work in [2] include: (i)TaxME2, that is a new method and the corresponding dataset, which allows for assessing not only Recall, but also Precision, which is a correctness measure; (ii) the new property of the dataset, i.e., monotonicity; (iii) extensive evaluation of theTaxME2dataset within the OAEI campaigns of 2005, 2006 and 2007.
The empirical evaluation highlighted that theTaxME2dataset possesses five key properties: complexity, namely that it is hard for state of the art matching systems, incrementality, namely that it is effective in revealing weaknesses of the state of the art matching systems, discrimination capability, namely that it discriminates sufficiently among the various matching solutions, monotonicity, namely that the matching quality measures calculated on the subsets of the dataset do not differ substantially from the measures calculated on the whole dataset, and correctness, namely that it can be considered as a correct tool to support the improvement and research on the matching solutions.
The rest of the paper is organized as follows. Section 2 provides a brief introduction to the problems of ontology matching and ontology matching evaluation. Section 3 discusses our approach to building semi-automatically the dataset for assessing Recall, called TaxME. Section 4 presents an extension of
TaxMEtoTaxME2, which allows for an assessment of Precision, beside Recall. Section 5 introduces the
five key properties of the dataset. Section 6 presents the results of our experiments and shows thatTaxME2
possesses the desired properties. Section 7 overviews the related work. Finally, Section 8 summarizes the major findings of the paper and outlines future work.
2 Basics
In this section we briefly introduce the basic concepts at work by discussing first the ontology matching problem (§2.1) and then the ontology matching evaluation problem (§2.2).
2.1 The ontology matching problem
An ontology typically provides a vocabulary that describes a domain of interest and a specification of the meaning of terms used in the vocabulary. Depending on the precision of this specification, the notion of ontology encompasses several data and conceptual models, including classifications or web directories, database schemas and fully axiomatized theories.
Given two ontologies, a correspondence is a 5-tuple: hid, e1, e2, n, Ri, such that:
• id is a unique identifier of the given correspondence;
• e1and e2are entities (e.g., classes, properties) of the first and the second ontology, respectively; • n is a confidence measure (typically in [0 1]) holding for the correspondence between e1and e2;
• R is a relation (e.g., equivalence (=), more general (w)) holding between e1and e2.
The correspondence hid, e1, e2, n, Ri asserts that the relation R holds between the ontology entities e1 and e2with confidence n. The higher the confidence, the higher the likelihood of the relation holding.
Matchingis the process of finding correspondences between entities of different ontologies. Alignment is a set of correspondences between two (or more) ontologies. The alignment is the output of the matching process [15].
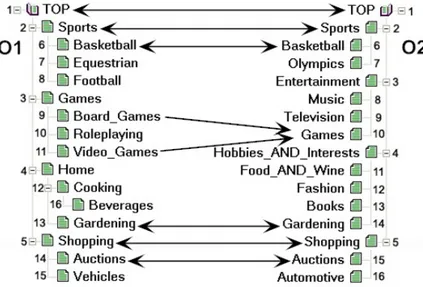
Figure 1 Fragments of Google and Looksmart web directories and some correspondences. The latter are expressed by arrows with single arrowheads standing for the more general relation (w) and with double arrowheads standing for the equivalence relation (=).
We view ontologies as graph-like structures [21]. Let us exemplify the matching problem with the help of fragments of two tree-like structures, such as Google and Looksmart, see Figure 1. Notice that in the general case the relation holding between the nodes of these directories is not the specialization relation, but the so-called classification or parent-child relation [20]. Let us suppose that the task is to merge these directories. Such situations occur, for example, when one e-commerce company is to acquire another one. A first step here is usually to identify the matching candidates or correspondences. For example,
BasketballinO1can be found equivalent toBasketballinO2, whileGamesinO2is more general than
Board GamesinO1. Then, based on the obtained correspondences articulation axioms can be generated
in order to create a new directory covering the matched directories.
As discussed above, heterogeneity can be reduced in two steps: (i) match entities of different ontologies to determine alignments and (ii) process the alignments according to the application needs. In this paper we focus on the evaluation of quality results in the first step.
2.2 The ontology matching evaluation problem
The ontology matching evaluation problem can be viewed as the problem of acquiring the reference correspondences that hold between entities of the ontologies. Given such reference correspondences it would be straightforward to evaluate the quality of the results of a matching solution.
The commonly accepted measures for qualitative matching evaluation are based on the well known information retrieval measures of relevance, such as Precision and Recall [47]. Let us consider Figure 2. The calculation of these measures is based on the comparison between the correspondences produced by a matching system (denoted S) and a complete set of reference correspondences (denoted H) considered to be correct. H is represented by the area inside the dotted circle. It is usually produced by humans. Finally, we denote as M the set of all possible correspondences, namely the cross product of the entities of two input ontologies.
Figure 2 Basic sets of correspondences.
The correct correspondences found by a matching system are called the true positives (T P ) and computed as follows:
T P = S ∩ H (1)
The incorrect correspondences found by a matching system are called the false positives (F P ) and computed as follows:
F P = S − S ∩ H (2)
The correct correspondences missed by a matching system are called the false negatives (F N ) and computed as follows:
F N = H − S ∩ H (3)
The incorrect correspondences not returned by a matching system are called the true negatives (T N ) and computed as follows:
T N = M − S ∩ H (4)
We call the correspondences in H the positive correspondences, and the correspondences in N as defined in Eq. 5, the negative correspondences.
N = M − H = T N + F P (5)
Precision is a correctness measure. It varies in the [0 1] range, the higher the value, the smaller the set of wrong correspondences (false positives) which have been computed. It is calculated as follows:
P recision = |T P | |T P + F P |=
H ∩ S
S (6)
Recall is a completeness measure. It varies in the [0 1] range, the higher the value, the smaller the set of correct correspondences (true positives) which have not been found. It is calculated as follows:
Recall = |T P | |T P + F N | =
H ∩ S
Ontology matching systems are often not comparable based only on Precision or Recall. In fact, Recall can be maximized at the expense of Precision by returning all possible correspondences, i.e., the cross product of the entities from two input ontologies. At the same time, higher Precision can be achieved at the expense of lower Recall by returning only few (correct) correspondences. Therefore, it is useful to consider both measures simultaneously or a combined measure, such as the F-measure.
In particular, F-measure is a global measure of the matching quality. It varies in the [0 1] range. It allows for comparison of the systems by their Precision and Recall at the point where their F-measure is maximal. Here, we use F-measure, which is a harmonic mean of Precision and Recall; that is, each of these measures is given equal importance. It is calculated as follows:
F-measure=2 ∗ Recall ∗ P recision
Recall + P recision (8)
In order to calculate Precision, Recall and F-measure, the complete reference alignment H must be known in advance. This opens up a problem of the reference alignments acqusition. The problem is that the construction of H is usually a manual process which, in the case of matching, is quadratic with respect to the size of the ontologies to be matched. This manual process often turns out to be unfeasible for large datasets. For instance, each of the web directories, such as Google, Yahoo and Looksmart, has in the order of 105 entities. This means that construction of H would require the manual evaluation of 1010 correspondences.
3 A dataset for evaluating Recall
In this section we first outline the key idea behind theTaxMEapproach (§3.1). Then, we present the details of how theTaxMEdataset has been built (§3.2).
3.1 The TaxME approach
We propose a semi-automatic method, called TaxME5, for an approximation of a reference alignment for tree-like structures, such as web directories. The key idea is to rely on a reference interpretation for entities (nodes), constructed by analyzing which documents have been classified in which nodes. The assumption is that the semantics of nodes can be derived from their pragmatics, namely from analyzing the documents that are classified under the given nodes. The working hypothesis is that the meaning of two nodes is equivalent if the sets of documents classified under those nodes have a meaningful overlap. The basic idea is therefore to compute the relationship measures based on the co-occurrence of documents.
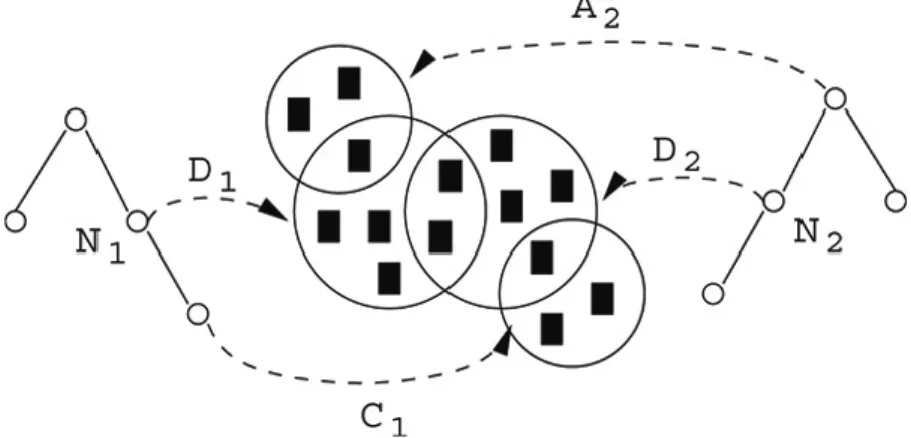
Figure 3 TaxME. Illustration of a document-driven similarity assessment.
Let us consider the example presented in Figure 3. Let N1be a node in the first ontology and N2be a node in the second ontology. D1and D2stand for the sets of documents classified under the nodes N1
5The abbreviation TaxME stands for “TAXonomy Mapping Evaluation”, though in this paper we use the terminology
and N2, respectively. A2 denotes the documents classified in the ancestor node of N2; C1 denotes the documents classified in the children nodes of N1.
The equivalence measure, Eq, is defined as follows:
Eq(N1, N2) =
|D1∩ D2| |D1∪ D2| − |D1∩ D2|
(9) Notice that the range of Eq(N1, N2) is [0 ∞]. The intuition is that the more D1 and D2 overlap, the bigger Eq(N1, N2); with Eq(N1, N2) becoming infinite when D1= D2. Eq(N1, N2) is normalized within [0 1]. The special case of D1= D2is approximated to 1.
Let us now discuss the generalization relation. Given two nodes N1and N2and the related document sets D1and D2, we use two additional sets: (i) the set of documents classified in the ancestor node of N2, denoted as A2, and (ii) the set of documents classified in the children nodes of N1, denoted as C1. The generalization relationship holds when the first node has to be considered more general than the second node. Intuitively, this happens when the documents classified under the first node occur in the ancestor of the second node, or the documents classified under the second node occur in the subtree of the first node. Following this intuition we can formalize the generalization measure, M g (where M g stands for more general), as follows:
M g(N1, N2) =
|(A2∩ D1) ∪ (C1∩ D2)| |D1∪ D2|
(10) The specialization relationship measure Lg(N1, N2), where Lg stands for less general, can be easily formulated by exploiting “symmetry” of the problem. In particular, the first node is more specific than the second node when the meaning associated to the first node can be subsumed by the meaning of the second node. Intuitively, this happens when the documents classified under the first nodes occur in the subtree of the second node, or the documents classified under the second node occur in the ancestor of the first node. The definitions above allow us to compute a relationship measure between two nodes of two different ontologies. Such a measure relies on the assumption that if two nodes classify the same set of documents, the meaning associated to the nodes is reasonably the same. Of course this assumption is true for a virtually infinite set of documents. In a real world we have to deal with a finite set of documents, and therefore, this way of proceeding is error-prone. Nevertheless, our claim is that the approximation introduced by our assumption is balanced by the benefit of scaling with the annotation of large directories.
3.2 The TaxME dataset
The reference alignment for the TaxMEdataset is computed based on Google, Yahoo and Looksmart. These web directories possess many useful properties: (i) they are widely known, (ii) they cover overlapping topics, (iii) they are heterogeneous, (iv) they incorporate typical real world modelling and terminological errors, (v) they are large, and (vi) they address the same space of contents. Therefore, the working hypothesis of document co-occurrence is sustainable. Naturally, different web directories do not cover the same portion of the web but the overlap is meaningful.
The nodes are considered as categories denoted by lexical labels. The tree structures are considered as hierarchical relations. The URLs classified under a given node are taken to denote documents. Table 1 summarizes the total amount of the processed data.
Table 1 Number of nodes and documents processed during the TaxME construction process.
Google Looksmart Yahoo
Number of nodes 335.902 884.406 321.585
Number of URLs 2.425.215 8.498.157 872.410
Let us discuss the process used to build theTaxMEreference alignment. In particular, it is organized in five steps.
Step 1. We crawled all three web directories, both the hierarchical structure and the web contents. Then we computed the subset of URLs classified by all of them.
Step 2. We pruned the downloaded web directories by removing all the URLs that were not referred by all the three web directories.
Step 3. We performed an additional pruning by removing all the nodes with a number of URLs under a given threshold for obvious reasons. We used the threshold of 10.
Step 4. We manually recognized potential overlaps between two branches of two different web directo-ries. Examples here include:
Google: Top > Science > Biology
Looksmart: Top > Science-and-Health > Biology Yahoo: Top > Computers-and-Internet > Internet Looksmart: Top > Computing > Internet
Google: Top > Reference > Education Yahoo: Top > Education
We recognized 50 potential overlaps as exemplified above and for each of them we ran an exhaustive assessment on all the possible pairs between the two related subtrees. Such a heuristic allowed us to reduce the search space and do not consider all the possible correspondences coming from the cross product of the entities of two input directories. Specifically, we focussed the analysis only on smaller subtrees where the overlaps were the most evident.
Step 5. For each of the subtree pairs selected, an exhaustive assessment of the correspondences holding between nodes was performed. This is done by exploiting the equivalence measure and the corresponding generalization and specialization measures. These are normalized within [0 1]. The finalTaxMEsimilarity measure is computed as the maximum out of these three measures, namely as follows:
SimTaxME= max(Eq(N1, N2), Lg(N1, N2), M g(N1, N2)) (11)
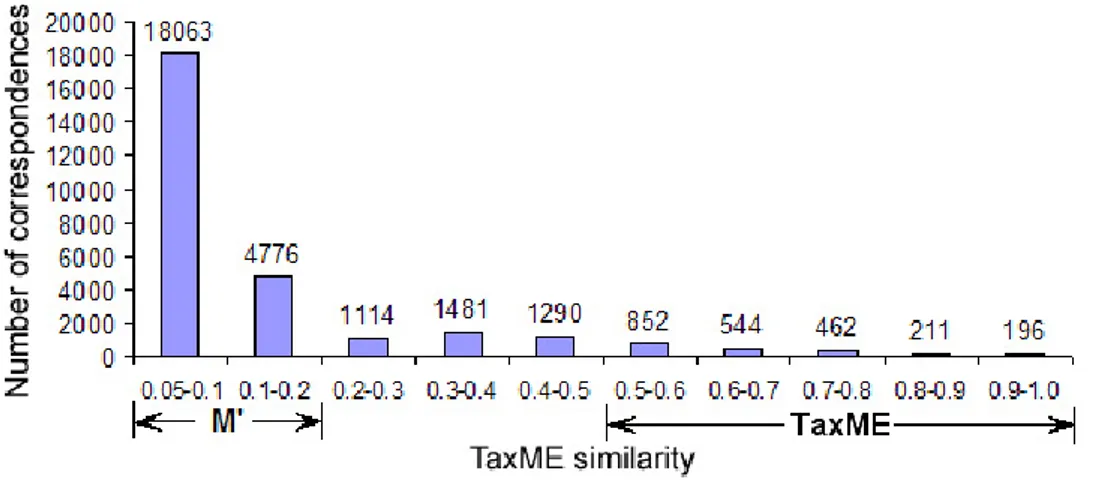
We discarded all the pairs where none of the three relationships were detected. The distribution of the correspondences constructed using SimTaxMEis shown in Figure 4.
Figure 4 indicates that the number of correspondences is stable and grows substantially, of two orders of magnitude, only with a value of the measure less than 0.1. As a pragmatic decision, the correspondences with SimTaxME above 0.5 were taken to constitute the reference alignment of TaxME. This process allowed us to obtain 2.265 pairwise relationships defined using the document-driven interpretation. Half are equivalence relationships and half are generalization relationships (notice that by definition the generalization and specialization measures are symmetric).
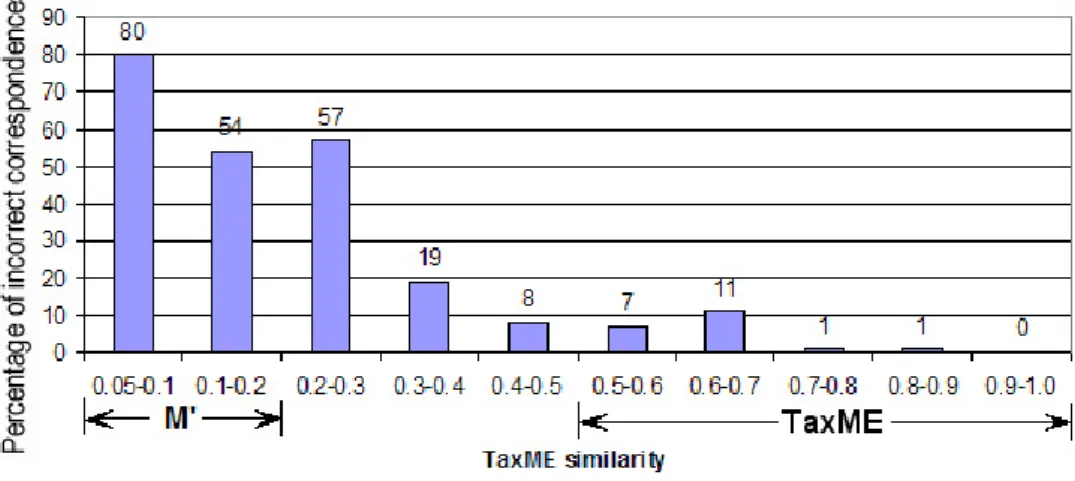
The final observation is that SimTaxMEis robust. By robustness we mean here the fact that the number of incorrect correspondences is high only for very low values of SimTaxMEand decreases very sharply as soon as these values increase. We need robustness as it shows dependencies between the values of
SimTaxMEand the human observed similarity. We randomly selected 100 correspondences in 9 intervals
of range 0.1 and in one interval of range 0.05 and manually evaluated their correctness. This resulted in a reasonable amount of manual work (2 months by 1 person): we analyzed around one thousand correspondences. The results are presented in Figure 5 and show that SimTaxMEis robust, namely: • It is stable with a small percentage of the incorrect correspondences for the [0.3 1] range;
• The number of incorrect correspondences becomes substantial for very small values of SimTaxME, namely those less than 0.1.
Figure 5 Distribution of the incorrect correspondences.
4 A dataset for evaluating Precision
Following Eq. 6 in order to evaluate Precision, we need to know the false positives (F P ). This in turn, as from Figure 2 requires to know the reference alignment (H). However, computing H in the case of a large scale matching task often requires an unfeasible human effort. We cannot use the reference alignment composed from positive correspondences, i.e.,TaxME. In this case, as shown in Figure 6, F P cannot be computed, because F Punknown= S ∩ (H −TaxME), marked as gray area, is not known.
Our proposal here is to construct a reference alignment for the evaluation of both Recall and Precision, let us call itTaxME2, defined as follows:
TaxME2=TaxME∪ NT 2 (12)
NT 2is an incomplete reference alignment containing only negative correspondences, i.e., NT 2⊂ M − H, see Figure 6.TaxME2must be a good representative of M . Thus, NT 2must be big enough in order to be the source of meaningful results. Therefore, we require NT 2to be at least the same size asTaxME, namely |NT 2| ≥ |TaxME|.
NT 2is computed from the complete alignment set M in two macro steps. Let us first introduce them briefly and then discuss them in detail.
Figure 6 Alignment comparison using TaxME. T P , F N and F P stand for true positives, false negatives and false positives, respectively.
• Step 1: Candidate correspondence selection. The goal of this step is to select a set M0, such that M0⊆ M , and which contains a big number of “hard” negative correspondences.
• Step 2: Negative correspondence selection. The goal of this step is to filter all the positive corre-spondences from M0. In order to achieve this goal, M0is first pruned to the size that allows manual evaluation of the correspondences. Finally, the negative correspondences are manually selected from the remaining set of correspondences.
4.1 Candidate correspondence selection
The candidate set of correspondences M0 is selected from M , see Figure 7. The goal of this step is to ensure that M0contains a big number of “hard” negative correspondences. Intuitively a “hard” negative correspondence is the correspondence with relatively high value of similarity measure, which is incorrect according to manual annotation. Given the robustness of SimTaxME we have decided to exploit it as a similarity measure for M0 construction. Let us revisit Figure 4 and Figure 5. However, a big enough number of the negative correspondences can be obtained only for the values of SimTaxMEin the [0 0.2]
Figure 7 Alignment sets in TaxME2. Gray area stands for F Pi, which is a set of F P produced by the i − th
range. As a pragmatic decision we have selected M0 as correspondences having SimTaxME values in the [0.05 0.2] range. As from Figure 4, this allowed us to obtain 18.063 + 4.776 = 22.836 candidate correspondences.
4.2 Negative correspondence selection
The negative correspondence selection step is devoted to the computation of NT 2. The process is organized in two phases as follows:
Matching system selection. The goal of this phase is to select a set of matching systems whose results are exploited for constructing NT 2. The set of the selected systems should be heterogeneous, i.e., the selected systems should make different mistakes. Thus, the selected systems have to be the representatives of the different classes of the existing matching approaches. This also prevents NT 2 from being biased towards a particular class of matching solutions.
As the result of this phase, based on the classifications of matching approaches in [21, 40] we have selected three different matching systems, namelyCOMA[7],Similarity Flooding(SF) [34] and
S-Match(SM) [22]; see also Section 7 for a brief comparison of these. Notice that these systems were
used in the versions reported according to the above mentioned references.
Computation of negative correspondences. The goal of this phase is to compute NT 2 exploiting the results obtained by running the selected matching systems on M0. In particular, NT 2is computed based on the false positives as NT 2=SiF Pi, where F Pi stands for the false positives produced by running the i − th matching system on M0. The result of this exercise is depicted in Figure 7, where the gray area stands for F Pi. This construction schema ensures that NT 2will be hard for the existing systems, given that the set of matching systems evaluated on M0is representative and heterogeneous. An implicit constraint is that the number of false positives produced by each of the systems should be comparable. This prevents the existence of a bias towards a particular class of matching solutions. Notice that the computation of false positives requires the human annotation of the system results.
As the result of this phase, we have executedCOMA,SFandSMon M0. We manually evaluated the correspondences found by the systems and selected the false positives from them. Notice that we did not distinguish among different semantic relations while evaluating the matching quality. Therefore, for example, the correspondence A v B produced bySMand A1= B1 produced by
COMAwere considered as true positives if A = B and A1v B1are so based on human judgment. Finally, we computed NT 2as the union of the false positives produced by the matching systems. Table 2 provides a quantitative description of the content of NT 2. As from the first row of Table 2 the total number of annotated correspondences was 2.553 + 2.163 + 2.151 = 6.867. Notice that this is 6 orders of magnitude less than the number of correspondences to be considered in the case of the complete reference alignment, which involves considering about 1010correspondences (see §2.2). Notice also that the number of correspondences per system is balanced.
Table 2 Total number of correspondences and the size of false positives as computed by COMA, SF and SM on M0.
COMA SF SM
Found (S) 2.553 2.163 2.151
Incorrect (FP) 870 776 781
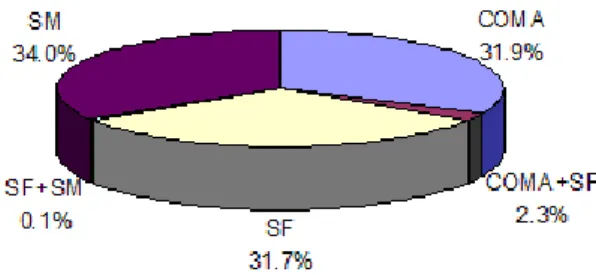
Figure 8 shows how the false positives produced by the systems are partitioned. In particular, there are no false positives found bySM,COMAandSF, or even bySMandCOMAtogether. There are small intersections between the false positives produced by SMandSF(0.1%) or byCOMAandSF(2.3%). These results justify our assumption that all three systems belong to the distinct classes.
Figure 8 Partition of the false positives as computed by COMA, SF and SM on M0.
The final result is that NT 2 consists of 2.374 correspondences. Notice that the size of NT 2 is not equal to the sum of the false positives reported in the second row of Table 2 since, as from Figure 8, there are intersections among these sets. The union of NT 2withTaxMEresulted in theTaxME2reference alignment. This, in turn, allowed for the evaluation of both Recall and Precision of 2.265 + 2.374 = 4.639 correspondences.
5 The TaxME2 dataset properties
The dataset developed provides an incomplete reference alignment since it contains only part of the correspondences in H, see, for example, Figure 6. The key difference between Figure 6 and Figure 2 is the fact that a complete reference alignment (the area inside the dotted circle in Figure 6) is simulated by exploiting an incomplete one (the area inside the dashed circle in Figure 6). However, if we assume
thatTaxMEis a good representative of H we can use the definitions of Recall and Precision as defined,
respectively, in Eq. 7 and Eq. 6 for their estimate. In order to ensure that this assumption holds a set of requirements have to be satisfied:
1. Correctness, namely the fact thatTaxME⊂ H, modulo annotation errors.
2. Complexity, namely the fact that state of the art matching systems experience difficulties when run
onTaxME2.
3. Incrementality, namely the fact thatTaxME2allows for the incremental discovery of the weaknesses of the tested systems.
4. Discrimination capability, namely the fact that different sets of correspondences taken fromTaxME2
are hard for the different systems.
5. Monotonicity, namely the fact that the matching quality measures calculated on the subsets of the dataset do not differ substantially from the measures calculated on the whole dataset.
In the next section we argue that the above mentioned properties hold for the dataset developed. Notice that these five properties in general are essential (though not exhaustive, but good enough) for any plausible ontology matching evaluation dataset.
6 Evaluation
The evaluation was designed in order to assess the major dataset properties discussed previously. In overall, we exploit the results of around two dozen of matching systems. Specifically, the results for the following 7 matching systems:oMAP,CMS,Dublin20,Falcon,FOAM,OLA, andctxMatch2, were taken from OAEI-2005, see [16, 1]. In turn, the results for the following 7 matching systems:HMatch,Falcon,
AUTOMS,RiMOM,OCM,COMA++, and Priorwere taken from OAEI-2006, see [14, 42]. The results
for the following 9 matching systems:Falcon,ASMOV,DSSim,Lily,OLA2,OntoDNA,Prior+,RiMOM,
andX-SOMwere taken from OAEI-2007, see [13, 41]. Only theFalconsystem participated in all three
evaluations, while theRiMOMandPriorteams participated only in 2006 and 2007; theOLAteam, in turn, participated in 2005 and 2007. Finally, we also use the results of the matching systems exploited during the dataset construction process (see Section 4), namelyCOMA[7],SF[34] andSM[22]. For the systems
we used the default settings or, if applicable, the settings provided by the authors for the OAEI-2005, OAEI-2006, OAEI-2007 evaluations, see [1, 42, 41].
In the rest of this section we provide the evaluation of five key dataset properties, namely: correctness (§6.1), complexity (§6.2), incrementality (§6.3), discrimination capability (§6.4) and monotonicity (§6.5). For the sake of the presentation we do not report the complete results6but only for the selected systems, whose results we found the most interesting.
6.1 Correctness
We have manually analyzed correctness of the correspondences provided byTaxME2. Notice that part of the dataset for evaluating Precision is 100% correct by construction (modulo annotation errors). In turn, manually checking the part of the dataset for evaluating Recall revealed only around 3% of the incorrect correspondences. Taking into account the notion of idiosyncratic classification [27], namely the fact that human annotators on the sufficiently big and complex datasets tend to have resemblance of up to 20% in comparison with their own results, such a mismatch can be considered as marginal.
6.2 Complexity
Precision, Recall and measure of the system results in OAEI-2007 are shown in Figure 9. The highest F-measure of 0.71 was demonstrated by theOLA2system. The highest Precision of 0.62 was demonstrated by both theOLA2system andX-SOM. The highest Recall of 0.84 was demonstrated by theOLA2system. In turn, the average Precision, Recall and F-measure were respectively, 0.57, 0.5 and 0.49.
Figure 9 OAEI-2007: matching quality results.
Figure 9 indicates the complexity of TaxME2. The dataset is quite hard for the state of the art matching systems. For example, the best F-measure in 2007 of 0.71 is significantly lower than the results demonstrated by the same systems on the other OAEI datasets, such as the benchmarks [13], where the best F-measure was 0.97. The other interesting observation is that the systems exploited during the dataset
6The complete results can be found as follows:
OAEI-2005: http://oaei.ontologymatching.org/2005/results/ OAEI-2006: http://oaei.ontologymatching.org/2006/results/ OAEI-2007: http://oaei.ontologymatching.org/2007/results/
construction process (e.g., the F-measure ofCOMAwas 0.45) demonstrate comparable performance with the other systems that participated in the OAEI campaigns, see Figure 9.
6.3 Incrementality
In 2007, the systems demonstrated substantially higher quality results than in previous two years. In particular, the average F-measure of the systems increased from approximately 29% in 2006 to 49% in 2007. The average Precision of the systems increased from approximately 35% in 2006 to 57% in 2007. The average Recall of the systems increased from approximately 22% in 2005 to 26% in 2006 and to 50% in 2007. Notice that in 2005 this dataset allowed for estimating only Recall (as described in Section 3), therefore in the above observations there are no values of Precision and F-measure for 2005.
A comparison of the results in 2006 and 2007 for the top-3 systems of each of the years based on the highest values of the F-measure indicator is shown in Figure 10. The key observation here is that quality of the best F-measure result of 2006 demonstrated byFalconhas almost doubled (increased by ∼1.7 times) in 2007 byOLA2. The best Precision result of 2006 demonstrated byFalconwas increased by ∼1.5 times in 2007 by bothOLA2andX-SOM. Finally, for what concerns Recall, the best result of 2005 demonstrated byOLAwas increased by ∼1.4 times in 2006 byFalconand further increased by ∼1.8 times in 2007 by
OLA2. Thus, theOLAteam managed to improve by ∼2.6 times its Recall result of 2005 in 2007. Similar, improvements were also demonstrated by the systems exploited during the dataset construction process, e.g., Recall ofSM was 0.29 in 2005 and improved by employing an iterative version of the semantic matching algorithm in 2006 [23] up to 0.46.
Figure 10 Comparison of matching quality results in 2006 and 2007.
The summative observation here is that the ontology matching community has made a substantial progress in 2007. Thus, the system designers managed to recognize major weaknesses in their approaches and provided plausible improvements. Notice that these improvements are generic, since the OAEI evaluation of this dataset was blind in 2005, 2006 and 2007, i.e., participants did not know the reference alignment. Moreover, they had to run their systems in a fixed configuration for all the OAEI test cases they decided to address. As Figure 10 indicates, quality of the results is almost doubled from 2006 to 2007. This suggests that the systems experience fewer difficulties on the test case, although there still exists large room for further improvements.
6.4 Discrimination capability
Partitions of positive and negative correspondences according to the system results in OAEI-2007 are presented in Figure 11 and Figure 12, respectively.
Figure 11 Partition of the system results on the positive correspondences.
Figure 11 shows that the systems managed to discover all the positive correspondences (the “Nobody” category is 0%). Only 15% of the positive correspondences were found by almost all (8) matching systems. Figure 12 shows that almost all (8) systems found 11% of the negative correspondences, i.e., mistakenly returned them as positive. The last two observations suggest that the discrimination capability of the data set is still high.
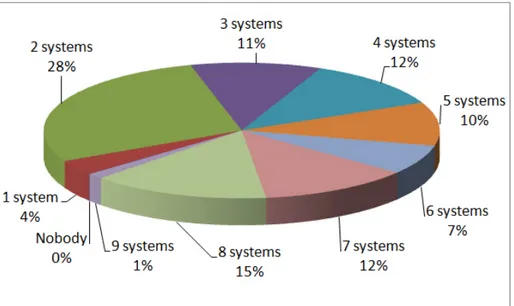
Figure 12 Partition of the system results on the negative correspondences.
Let us now compare partitions of the system results in 2006 and 2007 on the positive and negative correspondences, see Figure 13 and Figure 14, respectively.
Figure 13 Comparison of partitions of the system results on the positive correspondences in 2006 and 2007.
Figure 13 shows that 43% of the positive correspondences have not been found by any of the matching systems in 2006, while in 2007 all the positive correspondences have been collectively found; see also how the selected regions (e.g., for 2 systems) consequently enlarge from 2006 to 2007.
Figure 14 Comparison of partitions of the system results on the negative correspondences in 2006 and 2007.
Figure 14 shows that in 2006 in overall the systems have correctly not returned 26% of the negative correspondences, while in 2007, this indicator decreased to 2%. In turn in 2006, 22% of the negative correspondences were mistakenly found by all (7) the matching systems, while in 2007, this indicator decreased to 5%. An interpretation of these observations could be that systems keep trying various combinations of both “brave” and “cautious” strategies in discovering correspondences with a convergence towards better quality, since average Precision increased from 2006 to 2007.
Finally, as partitions of the positive and negative correspondences indicate the dataset retains good discrimination capability, i.e., different sets of correspondences are still hard for the different systems.
6.5 Monotonicity
The dataset is said to demonstrate a monotonous behavior if the matching quality measures calculated on its subsets of gradually increasing size converge to the values obtained on the whole dataset. This property illustrates the fact that the dataset as a whole and its parts are not biased to the particular matching solution(s). It also shows how the gradual increase in the dataset size influence the results of the matching systems in terms of the matching quality and gives a clue of whether a further increase in the dataset size may significantly influence the values of the matching quality measures.
In order to evaluate the monotonicity property we randomly sampled 50, 100, 200, 500, 1000 correspondences from TaxME2. For example, in order to obtain a 100 correspondences sample, 50 correspondences were randomly selected and added to the previously selected 50 correspondences sample. Then the matching quality measures for the matching systems were calculated on the samples of various sizes. An error was computed as follows:
ErrorM easure=
M easuresample− M easuredataset M easuredataset
(13) M easuresample stands for a matching quality measure calculated on the sample. M easuredataset denotes a matching quality measure calculated on the whole dataset. Thus, for example, if a matching system had onTaxME2dataset Precision of 0.2 and on the 100 correspondences sample randomly selected from the dataset its Precision is 0.21, the error of the system is as follows:
ErrorP recision=
|0.21 − 0.2|
0.2 = 0.05
ErrorP recision, ErrorRecalland ErrorF −measurefor the various sample sizes averaged for 10 sample selections are summarized in Figure 15, Figure 16 and Figure 17, respectively. The results of the selected systems were taken from OAEI-2005 [16, 1] and OAEI-2006 [14, 42].
Figure 15 ErrorP recisiondepending on the sample size.
Notice that in Figure 15, Figure 16 and Figure 17 the errors drop very quickly as the sample size increases. Therefore, the matching quality measures obtained on the randomly selected samples of the various sizes converge quickly to their values on the whole dataset. In particular, given 500 correspondences sample, ErrorP recision and ErrorRecall is less than 10% what, given the results depicted in Figure 9, corresponds to 0.02-0.05 difference in absolute values. Considering this difference as marginal we conclude thatTaxME2is monotonous.
Figure 16 ErrorRecalldepending on the sample size.
Figure 17 ErrorF −measuredepending on the sample size.
7 Related work
In this section we discuss the related work along the two dimensions, namely: ontology matching systems (§7.1) and ontology matching evaluation (§7.2).
7.1 Ontology matching systems
There exists a line of semi-automated schema matching systems, see, for instance [3, 6, 17, 31, 33, 34, 35, 18, 49, 28, 44]7. A good survey and a classification of matching approaches up to 2001 is provided in [39],
7
an extension of its schema-based part and a user-centric classification of matching systems is provided in [40], while the work in [15] considers both [40, 39] as well as some other classifications.
In particular, [40] discusses how the systems can be distinguished in the matter of considering the correspondences and the matching task, thus representing the end-user perspective. In this respect, the following criteria were proposed: (i) alignments as solutions (these systems consider the matching problem as an optimization problem and the alignment is a solution to it, see, for instance, Similarity
Flooding[34]); (ii) alignments as theorems (these systems rely on semantics and require the alignments
to satisfy it, see, for instance,S-Match [22, 24, 25]); (iii) alignments as likeness clues (these systems produce only reasonable indications to a user for selecting the correspondences, see, for instance,COMA
[7]). This justifies the choice ofSimilarity Flooding,S-MatchandCOMAas representatives of three distinct classes of matching systems used for theTaxME2dataset construction.
7.2 Ontology matching evaluation
Untill very recently there was no comparative evaluations and it was quite difficult to find two systems evaluated on the same dataset. Early evaluation efforts, such as in [45], focused on artificially produced and quite simple examples rather than on real world matching tasks. Also many works, see, for example, [33, 7], used for evaluation the schemas with dozen of nodes, though from real world applications, such as purchase orders. At the same time industrial size schemas, such asUNSPSC8 andeCl@ss9, contain thousands of nodes.
In order to improve the performances of the ontology matching field through the comparison of algorithms on various test cases the Ontology Alignment Evaluation Initiative - OAEI10 has been established. The main goal of OAEI is to be able to compare systems and algorithms on the same basis and to allow anyone for drawing conclusions about the best matching strategies [43]. OAEI campaigns have been run in 2005 [16], 2006 [14] and 2007 [13]. For example in OAEI-2007, 7 various datasets were used and different evaluation modalities. The most similar and to the best of our knowledge unique effort in constructing semi-automatically large reference alignment was in the anatomy test case. It involved a fragment of the NCI Thesaurus (3.304 classes) describing the human anatomy, published by the National Cancer Institute (NCI)11, and the Adult Mouse Anatomical Dictionary12(2.744 classes), which has been developed as part of the Mouse Gene Expression Database project. An early work describing the construction of the reference alignment for these test cases can be found in [4], but final results are still to be appear.
Among the manually constructed datasets it is worth mentioning the work in [11]. This dataset is composed of several hundreds of reference correspondences and was used in the first evaluation event of 200413, which was a predecessor of the OAEI campaigns. The real world part of systematic tests of OAEI designed in [16] contains dozen of them. The reference alignments in these datasets are composed of the positive correspondences, namely the correspondences that hold among the graph structures (for instance, caris equivalent to auto). All the other correspondences are assumed to be negative (for instance, car is not related to tree).
Let us now look at several works related to the ideas used during theTaxME2 dataset construction process. Similar to the annotated corpora for information retrieval or information extraction, we need to annotate a corpus of pairwise relationships. Of course such an approach prevents the opportunity of having large corpora. The number of correspondences between two ontologies is quadratic with respect to the size of ontologies, which makes it hardly possible to manually acquire the reference alignments for large scale ontologies. Certain heuristics, as used inTaxME2, can help in reducing the search space but the human effort is still too demanding. This approach has been followed by other researchers. For example,
8 http://www.unspsc.org 9http://www.eclass.de 10http://oaei.ontologymatching.org/ 11http://www.cancer.gov/cancerinfo/terminologyresources/ 12 http://www.informatics.jax.org/searches/AMA_form.shtml 13 http://www.atl.external.lmco.com/projects/ontology/i3con.html
in [29] the interpretation of a node is approximated by a model computed through statistical learning. Of course the accuracy of the interpretation is affected by the error of the learning model. We follow a similar approach but without the statistical approximation. The working hypothesis is that the meaning of two nodes is equivalent if the sets of documents classified under those nodes have a meaningful overlap. Naturally, this can already be considered as an instance-based matching technique in itself. Notice that we use it only for the evaluation of schema-based systems and it cannot be used for the evaluation of instance-based systems, since the dataset does not provide instances.
The monotonicity principle for alignment evaluation was proposed in [18]. Notice that it differs significantly from the monotonicity property presented in this paper since the former is concerned with aggregation of confidence measures of the correspondences while the latter applies to the matching quality measures, such as Precision and Recall, calculated for the samples of the dataset of various sizes.
Finally, it is worth noting that the ontology matching evaluation theme has been given a chapter account in [15], where a more detailed discussion of the available evaluation datasets is given as well as of the other issues related to the evaluation of matching systems, including evaluation methodology [19], evaluation measures [12], etc.
8 Conclusions and future work
In this paper we have presented a large scale ontology matching evaluation dataset, calledTaxME2, which was constructed out of the Google, Yahoo and Looksmart web directories. The dataset is composed of 4.639 one-to-one matching tasks. It has the reference alignment. This allows for qualitative evaluation of matching systems by estimating both Precision and Recall. Around of two dozen of state of the art matching solutions have been evaluated on the dataset during the OAEI campaigns of 2005, 2006 and 2007. The experimental results indicate that the dataset possesses the key properties of (i) correctness, (ii) complexity, (iii) incrementality, (iv) discrimination capability and (v) monotonicity, thereby justifying the strength of the approach.
The five properties mentioned above are essential (though not exhaustive, but good enough) for any plausible ontology matching evaluation dataset. Specifically, they can be used as a ground for devising the notion of test hardness, which is one of the directions of our future work. Another direction of future work includes investigation of an evaluation dataset construction process in the case of expressive ontologies, such as those available in the biomedical domain. Finally, we are going to elaborate on further automation of the ontology matching evaluation dataset construction process in general. The ultimate goal in this direction is to minimize the human effort while increasing the dataset size.
Acknowledgements
We appreciate support from the Knowledge Web14European Network of Excellence (IST-2004-507482) and the OpenKnowledge15European STREP (FP6-027253). We are grateful to J´erˆome Euzenat for many fruitful discussions on the topic of this paper.
References
[1] Benjamin Ashpole, Marc Ehrig, J´erˆome Euzenat, and Heiner Stuckenschmidt, editors. Proceedings of the Workshop on Integrating Ontologies at the International Conference on Knowledge Capture (K-CAP), 2005.
[2] Paolo Avesani, Fausto Giunchiglia, and Mikalai Yatskevich. A large scale taxonomy mapping evaluation. In Proceedings of the International Semantic Web Conference (ISWC), pages 67–81, 2005.
[3] Sonia Bergamaschi, Silvana Castano, and Maurizio Vincini. Semantic integration of semistructured and structured data sources. SIGMOD Record, 28(1):54–59, 1999.
14
http://www.knowledgeweb.semanticweb.org
15
[4] Oliver Bodenreider, Terry F. Hayamizu, Martin Ringwald, Sherri De Coronado, and Songmao Zhang. Of mice and men: Aligning mouse and human anatomies. In Proceedings of the American Medical Informatics Association (AIMA) Annual Symposium, pages 61–65, 2005.
[5] Paolo Bouquet, Luciano Serafini, and Stefano Zanobini. Semantic coordination: A new approach and an application. In Proceedings of the International Semantic Web Conference (ISWC), pages 130–145, 2003.
[6] Robin Dhamankar, Yoonkyong Lee, An-Hai Doan, Alon Halevy, and Pedro Domingos. iMAP: Dis-covering complex semantic matches between database schemas. In Proceedings of the International Conference on Management of Data (SIGMOD), pages 383–394, 2004.
[7] Hong-Hai Do and Erhard Rahm. COMA – a system for flexible combination of schema matching approaches. In Proceedings of the International Conference on Very Large Databases, pages 610– 621, 2002.
[8] An-Hai Doan and Alon Halevy. Semantic integration research in the database community: A brief survey. AI Magazine, Special Issue on Semantic Integration, 26(1):83–94, 2005.
[9] An-Hai Doan, Jayant Madhavan, Robin Dhamankar, Pedro Domingos, and Alon Halevy. Learning to map ontologies on the semantic web. The VLDB Journal, pages 303–319, 2003.
[10] Marc Ehrig, Staab Staab, and York Sure. Bootstrapping ontology alignment methods with APFEL. In Proceedings of the International Semantic Web Conference (ISWC), pages 186–200, 2005. [11] Marc Ehrig and York Sure. Ontology mapping – an integrated approach. In Proceedings of the
European Semantic Web Symposium (ESWS), pages 76–91, 2004.
[12] J´erˆome Euzenat. Semantic precision and recall for ontology alignment evaluation. In Proceedings of the International Joint Conference on Artificial Intelligence (IJCAI), pages 348–353, 2007. [13] J´erˆome Euzenat, Antoine Isaac, Christian Meilicke, Pavel Shvaiko, Heiner Stuckenschmidt, Ondˇrej
ˇSv´ab, Vojtˇech Sv´atek, Willem Robert van Hage, and Mikalai Yatskevich. Results of the ontology alignment evaluation initiative 2007. In Proceedings of the International Workshop on Ontology Matching (OM) at the International Semantic Web Conference (ISWC) + Asian Semantic Web Conference (ASWC), 2007.
[14] J´erˆome Euzenat, Malgorzata Mochol Pavel Shvaiko, Heiner Stuckenschmidt, Ondˇrej ˇSv´ab, Vojtˇech Sv´atek, Willem Robert van Hage, and Mikalai Yatskevich. Results of the ontology alignment evaluation initiative 2006. In Proceedings of the International Workshop on Ontology Matching (OM) at the International Semantic Web Conference (ISWC), 2006.
[15] J´erˆome Euzenat and Pavel Shvaiko. Ontology matching. Springer-Verlag, 2007.
[16] J´erˆome Euzenat, Heiner Stuckenschmidt, and Mikalai Yatskevich. Introduction to the ontology alignment evaluation 2005. In Proceedings of the Workshop on Integrating Ontologies at the International Conference on Knowledge Capture (K-CAP), 2005.
[17] J´erˆome Euzenat and Petko Valtchev. Similarity-based ontology alignment in OWL-lite. In Proceedings of the European Conference on Artificial Intelligence (ECAI), pages 333–337, 2004. [18] Avigdor Gal, Ateret Anaby-Tavor, Alberto Trombetta, and Danilo Montesi. A framework for
modeling and evaluating automatic semantic reconciliation. The VLDB Journal, 14:50–67, 2005. [19] Raul Garc´ıa-Castro and Asunci´on G´omez-P´erez. Guidelines for benchmarking the performance of
ontology management APIs. In Proceedings of the International Semantic Web Conference (ISWC), pages 277–292, 2005.
[20] Fausto Giunchiglia, Maurizio Marchese, and Ilya Zaihrayeu. Encoding classifications into lightweight ontologies. Journal on Data Semantics, VIII:57–81, 2007.
[21] Fausto Giunchiglia and Pavel Shvaiko. Semantic matching. The Knowledge Engineering Review, 18(3):265–280, 2003.
[22] Fausto Giunchiglia, Pavel Shvaiko, and Mikalai Yatskevich. S-Match: an algorithm and an implementation of semantic matching. In Proceedings of the European Semantic Web Symposium (ESWS), pages 61–75, 2004.
[23] Fausto Giunchiglia, Pavel Shvaiko, and Mikalai Yatskevich. Discovering missing background knowledge in ontology matching. In Proceedings of the European Conference on Artificial Intelligence (ECAI), pages 382–386, 2006.
[24] Fausto Giunchiglia and Mikalai Yatskevich. Element level semantic matching. In Proceedings of the Meaning Coordination and Negotiation Workshop at the International Semantic Web Conference (ISWC), 2004.
[25] Fausto Giunchiglia, Mikalai Yatskevich, and Enrico Giunchiglia. Efficient semantic matching. In Proceedings of the European Semantic Web Conference (ESWC), pages 272–289, 2005.
[26] Fausto Giunchiglia, Mikalai Yatskevich, and Pavel Shvaiko. Semantic matching: algorithms and implementation. Journal on Data Semantics, IX:1–38, 2007.
[27] Dina Goren-Bar and Tsvi Kuflik. Supporting user-subjective categorization with self-organizing maps and learning vector quantization. Journal of the American Society for Information Science and Technology, 56(4):345–355, 2005.
[28] Bin He and Kevin Chang. Automatic complex schema matching across web query interfaces: A correlation mining approach. ACM Transactions on Database Systems, 31(1):1–45, 2006.
[29] Ryutaro Ichise, Hideaki Takeda, and Shinichi Honiden. Integrating multiple internet directories by instance-based learning. In Proceedings of the International Joint Conference on Artificial Intelligence (IJCAI), pages 22–30, 2003.
[30] Yannis Kalfoglou and Marco Schorlemmer. Ontology mapping: the state of the art. The Knowledge Engineering Review, 18(1):1–31, 2003.
[31] Jaewoo Kang and Jeffrey Naughton. On schema matching with opaque column names and data values. In Proceedings of the International Conference on Management of Data (SIGMOD), pages 205–216, 2003.
[32] Patrick Lambrix and He Tan. SAMBO - a system for aligning and merging biomedical ontologies. Journal of Web Semantics, 4(3):196–206, 2006.
[33] Jayant Madhavan, Philip Bernstein, and Erhard Rahm. Generic schema matching using Cupid. In Proceedings of the International Conference on Very Large Data Bases (VLDB), pages 48–58, 2001. [34] Sergey Melnik, Hector Garcia-Molina, and Erhard Rahm. Similarity flooding: a versatile graph matching algorithm. In Proceedings of the International Conference on Data Engineering (ICDE), pages 117–128, 2002.
[35] Giovanni Modica, Avigdor Gal, and Hasan Jamil. The use of machine-generated ontologies in dynamic information seeking. In Proceedings of the International Conference on Cooperative Information Systems (CoopIS), pages 433–448, 2001.
[36] Natalya Noy. Semantic integration: A survey of ontology-based approaches. SIGMOD Record, 33(4):65–70, 2004.
[37] Natalya Noy and Marc Musen. The PROMPT suite: interactive tools for ontology merging and mapping. International Journal of Human-Computer Studies, 59(6):983–1024, 2003.
[38] Yuzhong Qu, Wei Hu, and Gong Chen. Constructing virtual documents for ontology matching. In Proceedings of the World Wide Web Conference (WWW), pages 23–31, 2006.
[39] Erhard Rahm and Philip Bernstein. A survey of approaches to automatic schema matching. The VLDB Journal, 10(4):334–350, 2001.
[40] Pavel Shvaiko and J´erˆome Euzenat. A survey of schema-based matching approaches. Journal on Data Semantics, IV:146–171, 2005.
[41] Pavel Shvaiko, J´erˆome Euzenat, Fausto Giunchiglia, and Bin He, editors. Proceedings of the International Workshop on Ontology Matching (OM) at the International Semantic Web Conference (ISWC) + Asian Semantic Web Conference (ASWC), 2007.
[42] Pavel Shvaiko, J´erˆome Euzenat, Natalya Noy, Heiner Stuckenschmidt, Richard Benjamins, and Michael Uschold, editors. Proceedings of the International Workshop on Ontology Matching (OM) at the International Semantic Web Conference (ISWC), 2006.
[43] Pavel Shvaiko, J´erˆome Euzenat, Heiner Stuckenschmidt, Malgorzata Mochol, Fausto Giunchiglia, Mikalai Yatskevich, Paolo Avesani, Willem Robert van Hage, Ondˇrej ˇSv´ab, and Vojtˇech Sv´atek. KnowledgeWeb Deliverable 2.2.9: Description of alignment evaluation and benchmarking results. http://exmo.inrialpes.fr/cooperation/kweb/heterogeneity/deli/ kweb-229.pdf, 2007.
[44] Weifeng Su, Jiying Wang, and Frederick H. Lochovsky. Holistic schema matching for web query interfaces. In Proccedings of the International Conference on Extending Database Technology (EDBT), pages 77–94, 2006.
[45] York Sure, Oscar Corcho, J´erˆome Euzenat, and Todd Hughes, editors. Proceedings of the Workshop on Evaluation of Ontology-based tools (EON) at the International Semantic Web Conference (ISWC), 2004.
[46] Jie Tang, Juanzi Li, Bangyong Liang, Xiaotong Huang, Yi Li, and Kehong Wang. Using Bayesian decision for ontology mapping. Journal of Web Semantics, 4(1):243–262, 2006.
[47] Cornelis Joost (Keith) van Rijsbergen. Information Retrieval. Butterworths, 2nd edition, 1979. [48] Songmao Zhang and Olivier Bodenreider. Experience in aligning anatomical ontologies.
Interna-tional Journal on Semantic Web and Information Systems, 3(2):1–26, 2007.
[49] Patrick Ziegler, Christoph Kiefer, Christoph Sturm, Klaus Dittrich, and Abraham Bernstein. Detect-ing similarities in ontologies with the SOQA-SimPack toolkit. In ProccedDetect-ings of the International Conference on Extending Database Technology (EDBT), pages 59–76, 2006.