^ “ “4Üm î l
1
■3
f v Ÿ X o
M
!
A h
EUROPEAN UNIVERSITY INSTITUTE Department o f Economics
An Analysis of the Euro Area
Business Cycle
Alberto MUSSO
Thesis submitted fo r assessment with a view to obtaining the degree o f Doctor o f the European University Institute
Florence November 2005
European University Institute
ISTITUTO UNIVERSITARIO EUROPEO
0 9 NOV. 2005
BIBLIOTECA
EUROPEAN UNIVERSITY INSTITUTE Department of Economics
An Analysis of the Euro Area
Business Cycle
Alberto MUSSO
The Thesis Committee consists of: Prof. Mike Artis, supervisor
" Anindya Banerjee
" Denise Osborn, University of Manchester
iii
© by Alberto Musso All rights reserved
Table of contents
ACKNOWLEDGEMENTS...5
PREFACE... 7
INTRODUCTION... 11
I. What is the business cycle?... 11
1. 1. General definitions o f the business cycle...11
I. 2. A basic distinction: classical business cycles versus deviation cycles... 12
II. Is the business cycle of economic interest?...15
11 1. The welfare costs of business cycles and the benefits o f stabilisation policies... 15
II. 2. On the relevance o f the different concepts o f the business cycle... 17
III. How should the business cycle be measured?... 18
III. 1. Alternative approaches to trend-cycle decomposition... 18
III. 2. The basic structural time seriest or unobserved components, model...21
CHAPTER 1 - EVIDENCE ON THE EXISTENCE OF THE EURO AREA BUSINESS CYCLE... 25
I. Introduction...27
II. The related literature: results and shortcomings... 29
II. 1. An overview of the related literature...29
II. 2. Shortcomings o f the literature...31
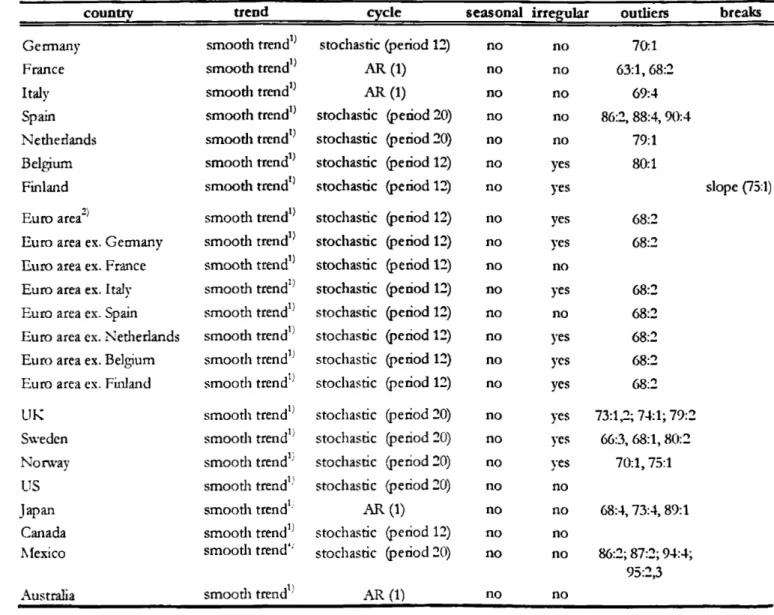
III. Data and M ethods... 35
III. 1. Data...35
III. 2. Estimation o f the deviation cycles... 37
III. 3. Measures o f association...40
III. 4. Breaks... 43
IV. R esults... 44
I I '. 1. What is the degree o f association among euro area cycles oier the whole sample period?... 44
11'. 2. How does the degree o f association among euro area cycles compare with that among all European and OECD countries over the whole sample period?... 47
I I 3. How does the degree o f association o f euro area cycles nith the euro area aggregate (or Germany) compare to that nith the US over the whole sample period?... 48
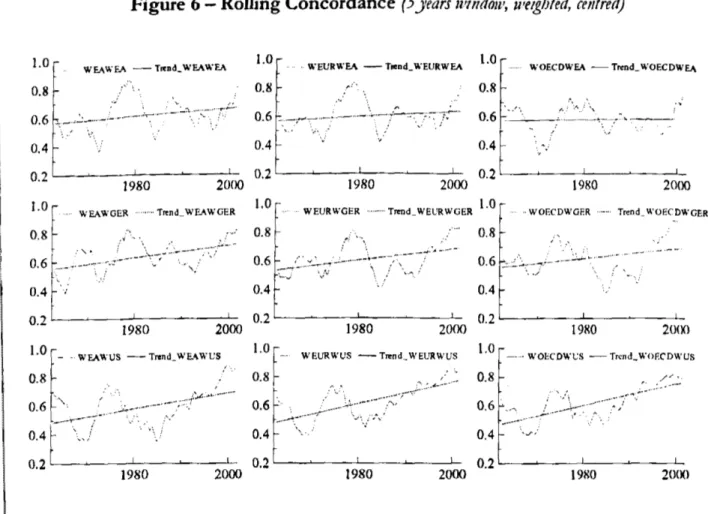
11'.4. Did the degree o f association among euro area cycles increase over time?... 50
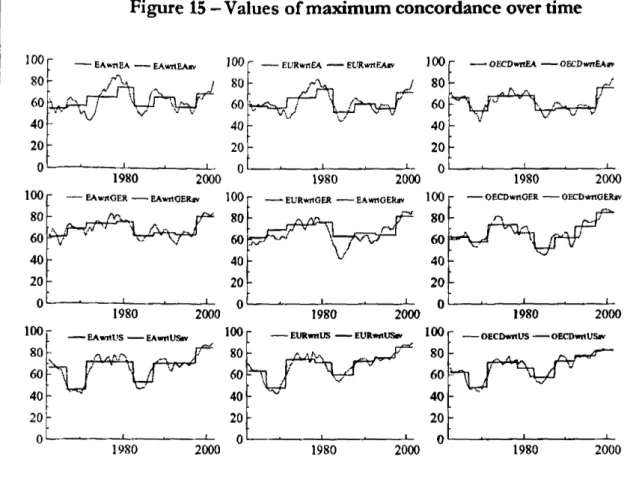
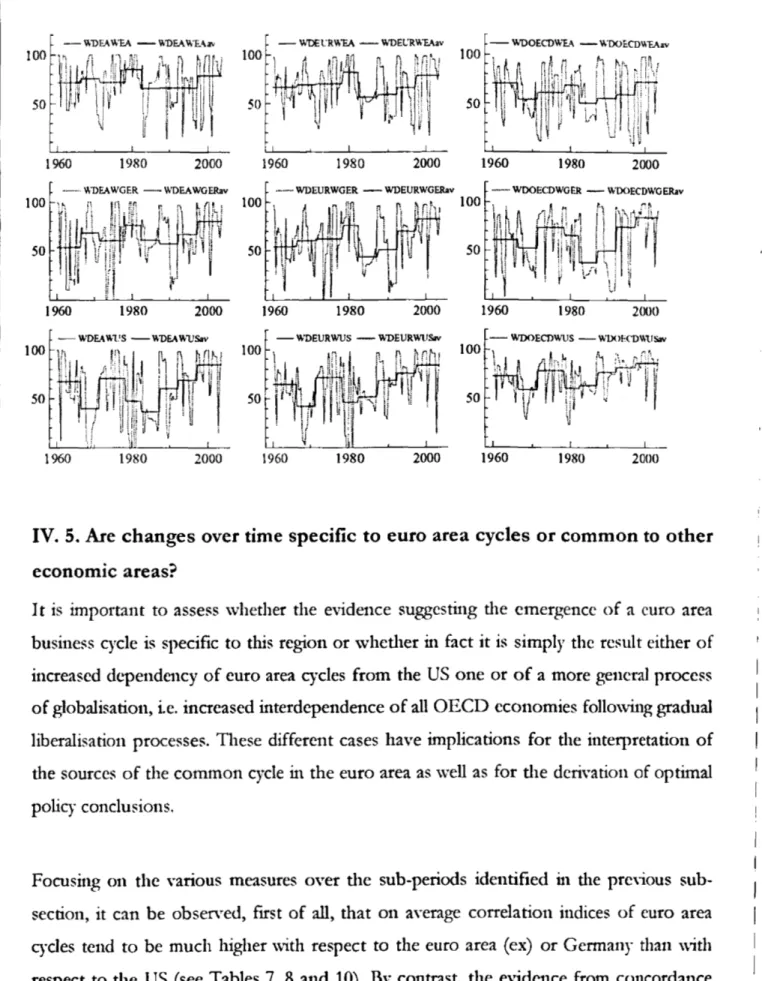
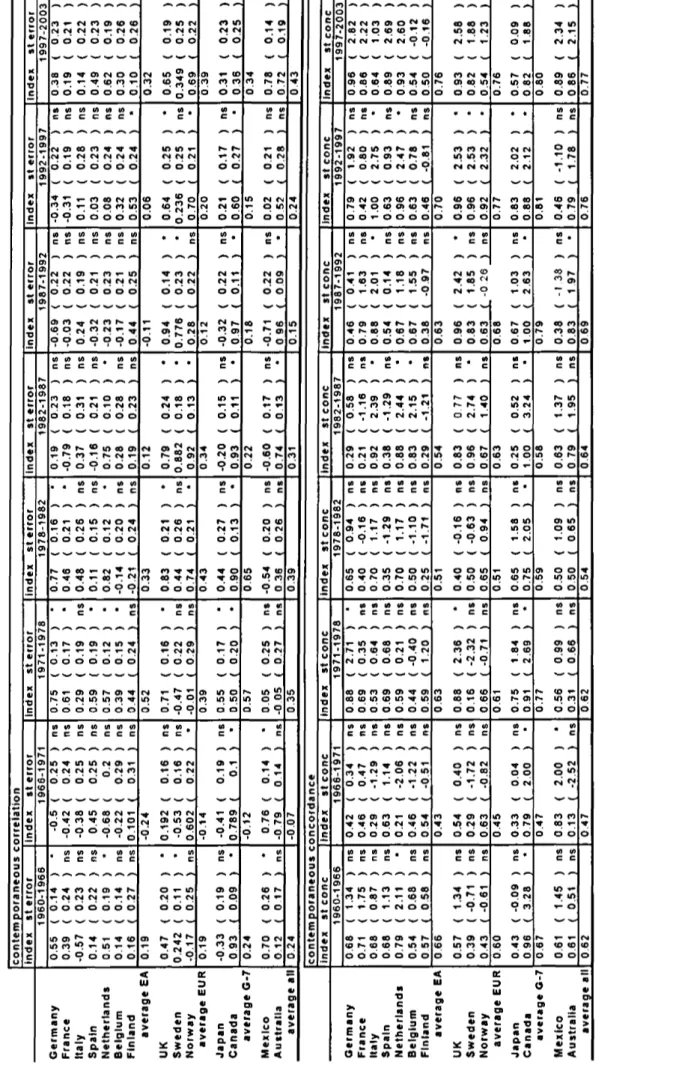
11'. 5. Are changes overtime specific to euro area cycles or common to other economic areas?... 66
V. Conclusions... 68
Appendix 1 — Overview of literature on euro area business cycles co-movement and convergence... 71
Appendix 2 - Further Results...79
CHAPTER 2- EURO AREA BUSINESS CYCLE STYLISED FACTS... 85
I. Introduction... 87
II. Basic characteristics of the euro area deviation cycle... 87
II. 1. Introduction... 87
II. 2. Data and methods... 89
II. 3. Average basic characteristics o f the denation cycle...94
iiÉUU ÚuáMMIuiittbitiiitMtii M IM ttl> M M I^lllhiytM M ÍlÍiÍÍt«> ÍÍÍ¿É É «áA
II. 4. Evolution o f the basic characteristics over tim e... 96
II. 5. Contplementary aspects o f the deviation cycle...100
III. Statistical cyclical properties o f macroeconomic variab les... 102
III. 1. Introduction...102 \
III. 2. Data and methods...103
III 3. Stylisedfacts... ...107
III 4. Stability o f relationships...109
IV. Conclusions...111
Appendix 1 — Turning points chronologies... 113
Appendix 2 — Results for the alternative euro area chronology... 114
Appendix 3 — Detailed stylised facts... 116
CHAPTER 3 - INFERENCE ON THE SOURCES OF THE EURO AREA BUSINESS CYCLE. A STRUCTURAL VAR AN ALYSIS...119
I. Introduction... 121
II. Methods... 125
II. 1. Economic framework... 125
II. 2. Econometric method...129
III. Results... ...131
III 1. What causes business gcles?... 133
III 2. Small frequent shocks or large infrequent shocks? ... 135
III 3. A case study: the early 1990s recessions...138
IV. Conclusions...142
Appendix 1 — A taxonom y of m acroeconom ic shocks...145
Appendix 2 — A m acro AS/AD m o d el... 148
Appendix 3 — The econometric m eth o d ...162
Appendix 4 — D ata sources and definitions... 167
Appendix 5 — Im pulse response functions and structural shocks series... 170
CONCLUSIONS... ..173
Acknowledgements
Several people deserve my gratitude in relation to the preparation of this doctoral dissertation. First o f all, I am greatly indebted to my supervisor Mike Artis, whose expert advice and continuous encouragement have been essential. I thank Tommaso Proictti, Siem Jan Koopman and Andrew Harvey for having introduced me to the econometrics of unobserved components models, starting from the European University Institute (EUI) Summer School on “State Space Modelling with Applications to Business Cycle Analysis”, held at the EUI in September 2000, but also during several subsequent conversations. My gratitude also goes to Fabio Canova for several conversations, especially regarding structural VAR analysis based on sign restrictions, both on methodological and computational issues.
I am grateful to the EUI for several reasons. First, during the years from 1996 to 2000, when I was full time resident, the EUI has offered a unique intellectual atmosphere, thanks to the seminars, courses and tutoring conversations with the members of the Department of Economics and the enriching -intellectually and personally- interactions with several other brilliant researchers from all Europe. Also ex post I do not regret to have chosen the EUI, among the places I had applied for to pursue a PhD (all o f which offered me a place, including the USE, Cambridge University and The University of Manchester). I thank the EUI also for having allowed me to spend the period August to December 1998 as visiting researcher at the University o f California at Berkeley. I am indebted to Brad De Long, my local advisor during my stance in Berkeley, for several useful conversations. My gratitude to the EUI is also due for having permitted me to spend the period Ju ly to October 1999 in Washington DC as intent at the IMF.
Special thanks to the people whose presence made my years at the EUI more interesting and pleasant, from those who started the PhD in Economics with me and with whom I have spent several hours trying to solve (both solvable and unsolvable) problems and discussing narrow and broad questions (Delphine, Rebeca, Leonor, Michael, Fragiskos, Jo ao ,...), to the others which reminded me that there is something else beyond
economics (Noura, Giovanni, A lex,...). The summer o f 2000, spent between San Domenico di Fiesole and La Querciola, was among the best periods o f my life, thanks to Noura.
I have been lucky to be able to work in the Euro Area Macroeconomic Developments division o f the Directorate General Economics o f the ECB during the past five years, among other reasons because one o f my main professional tasks has been to analyse the euro area business cycle. Not only have I been able to work on a topic which ranks high among m y interests, but I have also learned the practical aspects and policy implications of the work I had started at die EUI. The interactions with several o f my colleagues in EAM, which I thank, have been useful and stimulating.
Socrates seems to have once remarked that it is surprising diat the majority o f people, when asked, can immediately make a list of all their possessions, but arc not able to reply prompdy when asked how many friends they have and who they are (Xenophon,
Memorabilia, 11-4,4), Well, I am proud to be able to react in the exact opposite way
(independendy o f the fact that my possessions arc very limited). I should like to thank especially my true, old friends, who supported m e during those years (sometimes not knowing it) and still do so with their friendship: Alex, Cla and Vasco in Barcelona, and Filippo and M ario in Florence.
I am very much grateful to m y family, from my parents to my sister Livia and brodiers Leo and Fede, as well as m y deceased grandmother nonna Maria, all o f whom had occasionally to bear the costs of my sometimes crazy rhythms o f work during the preparation of diis diesis, but still supported me unconditionally during all those years, as well as during all my years on this planet iti die current life.
I hope the completion of the PhD dissertation will not mark the end of m y time as a researcher, but only the beginning. After all, I tend to agree widi the wise man who once said that “A life without investigation is not worth living” (Plato, A pology, 38a). The challenge, from now' on, will be to broaden the questions addressed.
Preface
Analyzing business cycles means neither more nor less than analyzing the economic process o f the capitalist era. (...) Cycles are not like tonsils, separate things that might be treated by themselves, but are, like the beat o f the heart, o f the essence o f the organism that displays them.
Schumpeter (1939, Preface, p.Y)
Economic crises arc recurrent phenomena in most if not all countries o f the world and, although at varying degree, affect negatively the majority of families and individuals. Even richer, capitalist, economies are not immune from at least some type of recurrent economic crises: recessions, which, if particularly severe, can lead to depressions. The negative material and psychological consequences of recessions, ranging from an increase of unemployment, rising poverty especially among the more vulnerable groups o f people and a general impoverishment of the whole population, cannot but lead to the conclusion that society would greatly benefit if these crises could be avoided or at least their impact reduced. For this purpose, it is necessary first to understand the determinants and intrinsic dynamics of business cycles, such that die most appropriate measures and economic policies can be adopted to minimize its negative consequences.
The process of European economic integration, which started in the 1950s, is an essential part of the more general process of political integration, aimed at ensuring lasting peace and cooperation in Europe. Important steps in the economic integration path were the progressive dismandement of barriers to trade of goods and capital and the movement of labour within Europe starting from the Rome Treaty’ of 1957 which led to the creation of a single market, the adoption of a common European Monetary System in 1979, the creation of European Economic and Monetary Union (EMU) along the path designed in die Maastricht Treaty in 1991 leading to die adoption o f a common currency, the euro, and the creation of the European System of Central Banks headed by the European Central Bank (ECB), with die task o f conducting a single monetary policy for the whole euro area. These factors have gradually made possible the emergence o f an economic area with some common fundamental economic features, such diat it has already become
ttdtiiMiUutiteeeeUiii
Ut t t i liu i& lit u u u m i^ J ki*.-./n _ -m m>i i i « i m i'im a^M i ■ \ i j Ui.iWriMMMf
common to refer to the economies which adopted die euro as a single economic entity, the euro area or euro zone.
Until recently, it was largely agreed that the only natural economic reference areas in Europe were the single states. However, particularly since the delegation o f a common monetary policy to a super-national entity in the euro area, it can be argued that for at least some analytical purposes, it is useful to adopt a euro area aggregate perspective. For business cycle analysis, closely linked to monetary policy analysis, there are some very good reasons, which will be discussed at length in chapter 1 o f this dissertation, to assume such a perspective. Thus, it becomes necessary to undertake a broad and thorough analysis o f die euro area business cycle from a new point o f Hew. Despite the publication of a several studies on euro area aggregate fluctuations1 since the pioneering w ork of Mike Artis and Wenda Zhang on the European business cycle in the mid-1990s and more recendy also thanks to the creation o f the Euro Area Business Cycle Network in 2002, a systematic and satisfactory analysis of the main characteristics of the euro area cycle is still missing. The present investigation aims at contributing to fill this gap by carrying out a broad analysis o f euro area fluctuations over the past four decades combining statistical, econometric, historical and economic information and methods.
A number of preliminary conceptual and measurement issues need to be addressed before undertaking a detailed analysis o f any business cycle. First, a discussion of what is meant by business c y c l e must be clarified, in order to avoid confusion. Second, the abstract concept o f the cycle must be translated into practical measures which can become the object o f analysis. Third, it is necessary to identify which specific concepts and measures of the business cycle are of interest from a macroeconomic perspective. These diree questions will be addressed shortly in the introductory chapter.
A general question which is specific to the analysis o f the present study is to which extent it makes sense to refer to an aggregate euro area business cycle. This issue will be discussed in chapter 1. It is shown that there are some good economic reasons to adopt
1 In the remainder o f die dissertation we will refer to "the business cycle”, “macroeconomic fluctuations” and “aggregate fluctuations” as synonyms.
an aggregate perspective when analyzing business cycles of the euro area and robust empirical evidence that supports such an approach. More precisely, chapter 1 provides evidence on the existence of a common cycle among euro area countries by adopting an analytical approach which tries to overcome some basic limitations which characterise the existing literature. The findings suggest that there is clear evidence o f a region-specific euro area business cycle, which started to emerge more forcefully since the 1980s.
Once the above-mentioned questions have been addressed, investigators can undertake what is more properly the analysis o f the business cycle. A thorough understanding of the business cycle requires a detailed analysis along several dimensions, both from a theoretical and empirical perspective. Despite the importance (but also die complexity) of die phenomenon under study, as synthesised by Schumpeter in the quotation reported above, and the fact that several theories have been proposed to explain business cycle fluctuations, it still presents several unexplained features such that most analysts in the profession still regard it largely as a puzzle.2 Nevertheless, the profession seems to have reached a broad agreement from a methodological point of view on how to proceed to the analysis of business cycles. The mainstream research strategy* starts from the identification of the facts that characterize business cycles, and that therefore need to be explained, and dien moves to testing the alternative theories. If a theory is found to outperform the alternatives and reaches a minimum set o f criteria, varyingly defined, then it is used as a framework for policy* analysis. The present study follows this strategy by- first identifying a broad set o f stylised facts characterising the euro area business cycle (chapter 2) and subsequently by drawing some inference on the relative importance of various sources o f the cycle (chapter 3). In particular, the purpose of chapter 2 is to identify and discuss the main stylised facts of euro area fluctuations since 1960. These include the basic stylised facts about the cycle such as average duration and amplitude, structural breaks and turning points, and the main properties (variability*, persistence, correlation with GDP, etc.) o f a set o f key* macroeconomic variables, from expenditure components to labour market variables and prices. All these properties are compared to the corresponding ones for the US cy*cle. Chapter 3 identifies the main sources of euro
: This view is summarised in the title o f the recent note by Christiano and Fitzgerald (1999): “The business cycle: it’s still a puzzle”.
jrUlKAiatewl. !■« m r^; ^ t/i; j ^ tl.;UUIUUiUHMMa
area fluctuations since 1980 using structural VAR analysis and compares them to the corresponding one for the US. Identification is achieved by imposing sign restrictions on impulse responses based on basic aggregate demand-aggregate supply models. The results of chapter 3, in additions to be interesting for policy purposes, can also provide some key indications on the explanatory power o f the main theories for euro area fluctuations.
It is important to stress that the current investigation represents only a starting point for a more comprehensive analysis o f the euro area business cycle. Most aspects mentioned in this study deserve a more detailed analysis, and no attempt is made to construct a theoretical m odel o f euro area fluctuations, tasks which can only be undertaken in a long term research program. Nevertheless, the results o f the present study can represent a reference point on various important issues which can b e useful to guide further efforts to analyse the euro area business cycle.
Introduction
This introductor)' chapter provides a discussion of a number of preliminar)- conceptual and measurement issues which need to be addressed before undertaking a detailed analysis o f the euro area business cycle: first, what is the business cycle; second, which concept of the business cycle is more relevant for different analytical purposes; and, third, how the business cycle should be measured. This chapter also introduces the main modelling approach used to extract the cycle used in the subsequent chapters o f the thesis, i.e. the structural time series, or unobserved components model, approach.
I . W h a t is t h e b u s i n e s s c y c l e ?
I. 1. General definitions o f the business cycle
Before analysing any phenomenon, it is necessary to state at least a general definition o f it as a starting point, in order to avoid confusion and misunderstandings o f different types. In the case under discussion this initial step is even more important because different concepts of the business cycle have been proposed, each one leading to a different measurement method, with the risk that different analysts disagree on the assessment of fluctuations simply because they refer to alternative concepts of the cycle.
It is worth starting our discussion by reporting and dissecting the most widely quoted definition o f the business cycle, which is the one provided by Bums and Mitchell (1946):3
“Business cycles are a type o f fluctuations found in the aggregate economic activity o f nations that organise their work mainly in business enterprises: a cycle consists o f expansions occurring at about the same time in many economic activities, follow ed by similarly gen eral recessions, contractions, and revivals which merge into the expansion phase o f the next cycle; this sequence o f changes is recurrent but not periodic; in duration business cycles vary from more than one y e a r to ten or twelve yea rs; t h y are not divisible into shorter y cle s o f similar character with amplitudes approximating their own.” (p. 3)
3 A very similar definition can be found in Mitchell (1927).
l. >-.. . - i n . ; . . „ ... ... ^ ---— ~
This general definition, which encompasses various more precise concepts o f the business cycle which w ill be discussed below,4 represents a useful starting point as it highlights the fundamental aspects of business cycles. Essential elements in this definition are:
■ diffusion o r pervasiveness: the co-movement of several sectors and economic activities, i.e. production, employment, income and trade;
■ the alternation o f different phases, separated by turning points, in a recurring order; ■ delimitation o f duration: between one and twelve years. Thus, implicidy also
persistence is assumed to be an important feature o f cyclical phases.
It can be noted that, in contrast to the delimitation of duration of cycles, no mention is made o f a m inim um or a maximum amplitude that should characterise the different phases.5 This fact can be explained by die fact that for example both production and employment w ere implicidy assumed to be relevant, but these are measured in different units, thus m aking it difficult to delimit quantitatively amplitude. In addition, diere was a perception that the average amplitude of cycles was changing over time, and that dierefore a m inim um amplitude limit (for example, one for each reference series in terms of percentage) could become soon obsolete.6 However, the same criticism applies to the delimitation o f th e duration. Moreover, a reference specification is necessary’ in order to differentiate contiguous regimes such as recessions and contractions or revivals and expansions. In addition, there is no reason why fixed rules should be adopted, bodi in terms o f duration and amplitude. For the latter, a criterion based on some multiple or fraction of standard deviations, even if changing over time, could be useful not only to classify regimes but also to identify cycles (by setting minimum standards). It should also be observed that the upper and lower bounds which Bums and Mitchell establish to identify business cycles duration are derived from the observation of several US
4 Hi is definition has been refined by the same and other authors and, for example, the cycle has been dissected into several (up to nine) phases. See for example Niemira and Klein (1994).
5 At the same time it should be recognised that while Bums and Mitchell do not mention amplitude limits in their definition o f the cycle, they discuss this aspect o f cycles at length in their monograph.
6 Mintz in 1972 for example noted that “should not a minimum amplitude be stipulated in some fashion? The reason for not setting such rule [is] ... mainly the difficult}' o f setting standards suitable for a future different from die past. With the declining trend of amplitudes ...a lower limit set today may easily be obsolete tomorrow (quotation from Haywood, 1973, p.32).
macroeconomic time series over the previous decades but there is no reason for this limits to be the constant over time or the same across countries.
The complexity of the definition of Bums and Mitchell emerges from the fact that the broad delimitation o f the duration o f cycles allows for different fluctuations to contribute to the phenomenon under study, including Kitchin (or inventor)) cycles, lasting about 40 months on average, and Juglar (or fixed investment) cycles, of duration between seven and eleven years. By contrast, seasonal cycles, lasting less than one year; agricultural (or cobweb) cycles, also o f relatively short but variable duration; Kuznets (or building) cycles of 16 years or more duration; and Kondraticff (or long waves) cycles lasting between 45 and 60 years, arc assumed to be different phenomena which require a separate explanation. An alternative view was advanced by Schumpeter in his 1939 monumental investigation on the business cycle, based on the idea that all (or most of) these cycles should be analysed in conjunction with one another in order to derive a complete explanation of the dynamic evolution o f capitalist systems. Other economists subscribed to dais view, but the resulting complexity of the problem convinced most people in die profession that a more viable approach is to separate at least in the initial stage o f research the medium-term concept of the business cycle from the short-term seasonal fluctuations and die long-term growth dynamics.
Overall, the definition of Bums and Mitchell (excluding die part proposing a quantitative delimitation of duration of cy cles) can be accepted as a starting point. However, from an operational point of view a set of more detailed criteria is necessary in order to identify and classify cycles. The latter aspect will be discussed at length in the following sections.
I. 2. A basic distinction: classical business cycles versus deviation cycles Within the empirical literature on the business cycle, there exists a basic distinction between two different, although related, concepts o f the cycle. The first, which was the concept of the business cycle initially introduced and was the main focus of the studies in the National Bureau of Economic Research (NBER) tradition, refers to absolute declines and increases in economic activity and is known as the “classical business cycle”, or
; f ¿/ai t j» lil'mi iill t- a l i l i J
simply ‘‘business cycle.”7 This was also the concept Bums and Mitchell had in mind, as becomes clear when they define a contraction as an “absolute fall in aggregate economic activity”. W ithin tliis framework, the analysis of the cycle proceeds by first identifying a set o f turning points for the different regimes and then by reporting and discussing the statistical properties of the resulting isolated different phases, including average duration and am plitude, and comparing the turning points across series, by computing leads and lags in timing. The general approach o f the NBER was heavily criticised by Koopmans (1947) in a review of Bums and M itchell’s book M easuring Business Cycles, still considered die main methodological contribution of the NBER tradition. Koopmans argued that this approach was “measurement without theory”, in the sense that the choice o f variables examined and die facts or properties to be reported were not guided by economic theory. In addition, he also stressed diat explicit assumptions about die probability distributions of die variables were missing, while a structural system of equations is needed as an organising principle. Thus, he concluded, the NBER approach was an “enormously wasteful undertaking”. The Koopmans criticisms were very influential in die profession and as a consequence the approach advocated by the NBER, starting from the collection of data and computation of what Kaldor called “stylised facts” to be explained b y economic theory, wras largely abandoned for direc decades (until it wTas advocated again by real business cycle researchers, starting from Prescott (1986) in the 1980s as a useful starting point for business cycle analysis).
The second concept of macroeconomic fluctuations, which has become the main reference in the academic literature since Lucas’ definition of the cycle as recurrent movements o f output about trend, is the “growth cycle” or “deviation cycle” notion.8 Lucas (1977) defined the business cycle as “repeated fluctuations about trend, all o f essentially the same character” (p.7), specifying that the latter qualification refers to the “regularities w hich are observed (...) in the co-movements among different aggregate 7 See for example Niemira and Klein (1994, p4): “When business activity declines in absolute levels and then rebounds, this is called a “classical business cycle”, more frequently it is simply referred to as a “business cycle”“.
8 See Lucas (1977). It should be noted that the concept of growth cycles was introduced much earlier. The first systematic study o f deviations cycles wras carried out by Mintz (1969) in her study o f German post- WWII cycles, as she didn’t find evidence o f a classical business cycle in West German data over the 1950s and 1960s. However, the concept was popularised in the academic world by Lucas in 1977.
time series (p.9)”9. The subsequent work of Kydland and Prescott (1982, 1990), which has been no less influential in shaping the path o f large part of business q cle research over the last two decades starts from the same definition. As a matter of fact, Kydland and Prescott (1990) explicitly state that they “follow Lucas in defining business cycles as the deviations o f aggregate real output from trend” (p.4) and “in viewing the business cycle facts as the statistical properties of the comovements of deviations from trend of various economic aggregates with those of real output” (p.9). Hence, most business cy c le researchers started again the analysis o f fluctuations by computing stylised facts but with reference to the deviation cycle rather than the classical cycle as was done mainly before. Another related definition is that by Sargent (1987), who defined and identified the cycle on the basis of spectral analysis,10 but his definition of the cycle in the frequency domain largely corresponds to Lucas’ definition in the time domain, with particular stress on the co-movements (or coherences, in spectral analysis terms) among variables.
I I . I s t h e b u s i n e s s c y c l e o f e c o n o m i c i n t e r e s t ?
II. 1. The welfare costs o f business cycles and the benefits of stabilization policies
There is no doubt that recessions are costly: employment falls, production stagnates and typically also poverty increases at least among the more vulnerable segments o f society. However, recessions may also have a positive role. Tor example, Schumpeter identified in the process of “creative destruction” one of the main forces of capitalist dynamics, including business cycles.11 Within his theory recessions are the natural consequence of die recurrent waves of innovations which force the most unproductive techniques and less profitable products out o f the market making resources free for more productive
9 It is worth noting that Lucas (1977) refers, among other sources, to the work o f Bums and Mitchell (1946) for the identification o f these regularities and lists as the first one the feature that “output movements across broadly defined sectors move together” (p.9).
10 “The business cycle is the phenomenon o f a number of important economic aggregates (such as GXP, unemployment, and layoffs) being characterized by high pair wise coherences at the low business cycle frequencies, the same frequencies at which most aggregates have most o f their spectral power if they have “typical” spectral shapes” (p.282).
UMtMMMMHiWiiUUltfaaia
uses. Thus, recessions are a time o f cleansing.12 Unfortunately the quantitative relevance of this phenomenon has not yet been established empirically and therefore it is difficult to conclude whether from this perspective recessions should be fully eliminated.
That macroeconomic fluctuations, and in particular recessions, imply a significant cost to society7 was for a long time taken for granted. However, traditional macroeconomic analysis of this issue was not rigorous, at least not according to the criteria widely adopted nowadays. In particular, traditional macroeconomic models, which were not based o n optimizing economic principles, did not allow for a formal welfare analysis to be carried out.
That business cycles were cosdy was questioned forcefully by Lucas (1987). On the basis of simple but rigorous theoretical considerations, he derived some estimates o f fraction o f total consumption that optimizing agents would be walling to give up in order to avoid fluctuations. Since his estimates suggested that this fraction was not more than one tenth of one percent of private consumption, he concluded that the welfare costs of business q x le are negligible. Subsequent studies addressed the same question using similar frameworks (that is, dynamic stochastic general equilibrium models) but relaxing in turn the various restricting assumptions made by Lucas. W hile the results often point in different directions and there is no generally agreed upon conclusion, most recent investigations suggest that welfare costs of fluctuations are much larger than suggested b y Lucas and are in fact often quite significant.13 Moreover, even if some studies find that on average the welfare costs o f fluctuations are modest, m ajor slowdowns m ay imply large welfare losses, thus proriding some support for the desirability of stabilisation policies.14
Even if die case for stabilisation policy' is, at least under certain conditions, accepted, the question emerges to what extent the various stabilisation policies may be effective. The rational expectations revolution seemed to question the possibility7 o f undertaking effective stabilisation policy.15 However, once macroeconomic imperfections are taken 12 See also Caballero and Hammour (1994).
13 For a recent review of h is large and growing literature see Barlcvy (2005). 14 See for example Gali et al. (2003).
15 See for example Lucas and Sargent (1979).
into account, and even under rational expectations, it has been shown that both monetary policy and fiscal policy can be effective to some extent for stabilisation purposes.16 At the same time, it has been recognized that both the desirability and the efficacy of stabilisation policy depends on the nature of the shock that give rise to fluctuations. In particular, in the presence o f permanent supply shocks (such as long-lasting oil price increases) the scope of stabilisation policy seems to be limited.
Thus, the most recent literature on the cost of fluctuations and the desirability and effectiveness of stabilisation policy seems to provide a strong justification for a thorough analysis of the business cycle to be undertaken.
II. 2. On the relevance o f the different concepts of the business cycle
While traditional analysis tended to focus on classical business cycles, modem macroeconomics has been mainly directed to analyse deviation cycles. Thus, the discussion in the previous section provides a strong case for the importance o f deviation cycles, while the question of the relevance of classical cycles remains open. It is true that classical recessions, which imply a contraction of production and most often a significant increase in the unemployment rate, are more costly than the average deviation cycle slowdown. However, the former can be seen as a subset of the latter. Thus, analysing deviation cycles does not imply that recessions are disregarded. Other arguments which have been advanced to support the relevance of the classical business cycle concept arc also not convincing, l'or example, it has sometimes been pointed out that the classical business cycle is the concept of the cycle historically introduced, that it is what people have in mind and it is what politicians are interested in:17 these considerations are, of course, irrelevant from an economic perspective. In our view, there is some support for the view that the concept of the classical cycle is relevant if it is recognized that there is no fundamental reason that indicates that long-run growth and medium-run fluctuations are determined by entirely different forces.18 Thus, the analysis of the business cycle may
16 For a recent perspective on die role of monetary policy and fiscal policy see Yellcn and Akerlof (2004) and Gali (2004) respectively.
17 Sec for example Harding and Pagan (2000).
18 To state it in Hicks (1965) words: ‘T he distinction between trend and fluctuation is a statistical distinction; it is an unquestionably useful device for statistical summarizing. (...) We have no right to
be more fruitful if the focus is on classical cycles, and also long-run growth is taken into account. However, a widely accepted all-encompassing framework is not yet available.19 Thus, given die current state o f macroeconomics, w e follow’ the approach typically adopted in d ie profession and focus on die analysis o f the deviation cycle.
I I I . H o w s h o u l d t h e b u s i n e s s c y c l e b e m e a s u r e d ?
“The essential idea o f trend is that it should be smooth.
Kendall (1973)
“ There is n o fundam ental reasony thoughy why a trend should be smooth.
Harvey (2001)
III. 1. Alternative approaches to trend-cycle decomposition
Given the general definitions o f the business cycle and die discussion o f die reasons supporting an interest in die business cycle discussed in the previous sections, the question emerges of how to operationalyse the business cycle, and more precisely the deviation cycle. In other wTords, howr should deviation cycles be measured or estimated? This step is a necessary phase for the empirical analysis and assessment of the cycle.
Deviation cycles are defined as deviations from trend. Typically, it is also assumed implicidy that die reference series has been seasonally adjusted and purged o f irregular movements. Thus, the identification of the deviation cycle is equivalent to isolating the cyclical component from the other components. The question of which empirical method ; should be applied to estimate the cyclical component o f a macroeconomic time series is controversial and no conclusion universally agreed upon has been reached in the literature. The most controversial step is probably the estimation of the trend, as no general operational definition of trend has been generally accepted in die literature largely due to die fact diat economic theory does not provide practical indications on how die ---
|
conclude, from the mere existence o f die statistical device, that the economic forces making for trend and for fluctuation are any different, so that they have to be analysed in different ways” (p. 4).
19 Models of the growth cycle have been proposed, including Evans et al (1998) or Matsuyama (1999). However, these frameworks rely on some restrictive assumptions such that their general explanatory power seems to be rather limited.
8B?
trend should be computed. For example, contrasting views such as those of Kendall and Harvey in the quotation reported above still are present in the profession. This controversy is rather unfortunate because it has been shown, for example by Canova (1994, 1998, 1999), that business cycle stylised facts vary significantly across detrending method.
The empirical methods applied to decompose macroeconomic time series range from non-parametric methods, or ad hoc filters, to model-based approaches (i.e. parametric methods). The former include deterministic detrending, the Whittaker-1 lenders on filter advocated by Hod rick and Prescott (1997), frequency domain-based filters such as the band-pass filters suggested by Baxter and King (1999) and Christiano and Fitzgerald (1998), moving average detrending, and phase trend averaging among others. All these ad hoc methods tend to exhibit a fundamental limitation: they may produce spurious cycles, in the sense that they may extract a cycle from series which de facto have none (this is die so-called Yule-Slutsky effect). These distortionary effects are documented by Nelson and Kang (1981) for linear detrending, by King and Rebelo (1993), Harvey and Jager (1993) and Cogley and Nason (1995) for the Ilodrick-Prescott filter20, by Bcnati (2002) and Murray (2003) for the band-pass filter, by Osbom (1995) for moving average detrending. As a result, it has been argued that stylised facts identified with these filters may de facto be largely “ stylised artifacts'’, i.e. properties induced by die filter rather than present in the data. It has to be recognized that the danger of creating distortions arises mainly from the mechanical application of these filters, while ways to adapt somewhat the filters to the series have been proposed.21 However, it can be argued that only within a mod el-based framework can the dangers of extracting spurious cycles be avoided.
Thus, wfe choose to estimate the cyclical component of the reference macroeconomic series within a model-based framew’ork, and more precisely the unobserved components (UC), or structural time series, model advocated by Harvey (1989) and, more specifically 20 Despite the claim o f Prescott (1998) that the filter lie advocates provides an operational definition of
the business cycle, and therefore cannot be qualified as either right or wrong it cannot be ignored that this filter distorts the evidence on co-movements among detrended scries, a fundamental characteristic of fluctuations even in the definition of the cycle he adopts.
21 For example, Ravn and Uhlig (2002) and Marcet and Ravn (2001) propose ways to adjust the Hodrick- Prcscott filter to different frequencies o f data and for cross-country comparisons, respectively.
19
L ii
for the purpose o f business cycle stylised facts identification, by Harvey and Jager (1993). It should be observed that UC models are not the only alternative parametric approach. Alternatives are represented by structural VAR models a la Blanchard and Quah (1989), cointegrated-VAR based methods and the Beveridge-Nelson approach.22 However, as regards the former it should be recognized that the identification scheme, although having the advantage o f being rooted in economic theory, is not unique atid despite recent advances there is still no general agreement on which identification restrictions arc m ore acceptable in the literature.23 M oreover, it has been shown that long-run restrictions are rarely robust with the relatively short sample sizes available.24 Cointegrated V A R approaches are more difficult to compare to the UC model approach, due to the v ery different underlying modelling philosophies involved. However, cointegration analysis is based on the presence of unit roots in macroeconomic time series. This represents a drawback as available tests have low power in discriminating this hypothesis with respect to the alternative of deterministic trends subject to breaks.25 By contrast, UC models d o not depend on the presence o f unit roots for the purpose of business cycle identification.26 As regards the Beveridge-Nelson decomposition, it has the counterintuitive implication that often the estimated trend component is more volatile than the actual series itself. Overall, UC models are formulated in terms o f components which have a natural interpretation in terms o f business cycle analysis and are immune from some important drawbacks which affect alternative model-based approaches. Thus, the UC approach will be the one adopted for the purpose of extracting and analysing business cycles in the present study.
One approach which sometimes has been advocated to reduce the specific impact o f detrending methods and check the robustness o f stylised facts is to take an “agnostic” position and to apply several alternative detrending methods, and testing then whether results are significantly different across method. Such an approach is flawed if it is taken to an extreme: there is no point in comparing stylised facts obtained with methods which
22 See Proietti (1997).
23 See for example the overview by Stock and Watson (2001).
24 See Faust and Leeper (1997) and Cooley and Dwyer (1998).
25 For a discussion o f this issue see Maddala and Rim (1998).
26 On the relative merits o f UC models and VAR models see also Harvey and Roopman (1997), including
the comments that follow, especially by Liitkepohl, and the reply.
may produce spurious cycles to those derived from (well-specified) model-based approaches. Such an extreme attitude is likely to lead to the fake conclusion that results should be classified as “non-robust”. However, it is a valid approach if only model-based approaches and plausible specifications are considered.
The previous discussion refers to the analysis of the cycle which proceeds by identifying stylised facts which then wall need to be explained. Different considerations concern forecasting, which will not be discussed in this dissertation. If for example, the objective is to find the measure of the cycle with best predictive ability for inflation, then it is probably worthwhile to consider a wider set of measures and simply compare them empirically, without necessarily excluding methods such as ad hoc filters which are less appropriate for causation studies.
III. 2. The basic structural time series, or unobserved components, model UC models have a long history in econometric analysis, as they can be rooted in the conceptualisation o f Persons (1919).27 In general, structural time scries models are set up in terms of components which have a direct interpretation. For example, it is often assumed diat the time series o f interest is composed o f a trend, a seasonal component and an irregular term. We will consider the more general form which also includes a cycle as reference framework. Thus, structural time scries models, rather than being aimed mainly at representing the underlying data generating process of the data, as in the case of the typical users of the cointegrated VAR methodology, can be interpreted as being instrumental in identifying a set o f stylised facts of a time series in terms of its components, which can be attributed a direct intuitive economic interpretation in terms o f long-run growth, business cycle, seasonal movements and irregular changes.
The statistical formulation is as follows. The macroeconomic time series of interest, y t, is assumed to be composed of a trend, //,, a cycle, , a seasonal component, y t , and an irregular term, s ,:
y, =M,+V,+Y,+e, s,~ NID(0,a;) (1)
27 See Nerlove et al. (1995) and Harvey (1989) for a historical overview o f these models.
I1 M It H M W W jP P W W m iffW jfjEPMj** !M<HJUUUIJ» Hill 1
21
All four components are stochastic and the disturbances driving them are assumed to b e mutually uncorrelated. The stochastic trend is modelled as a local linear trend.
M, +/?,-! +t], (2)
+
T
II i,~ N / D (0 ,cr;) (3)
where /?, is the slope, and the error terms 77, and are mutually uncorrelated. T h e
stochastic cycle is specified as
f cos sin A, f = P * + * "*r"* / ~ NJD C o )A ? ° l i I v 'f -i j L * JKt [_*, J \ V 0 (4) -s in A c cosA c
where A{ is the angular frequency measured in radiants (0< At <it) and p is a dam ping factor (0 < p < l). As shown by Harvey (1989), the stochastic cycle becomes a first-order autoregressive process if the frequency is 0 or 7t. Finally, the seasonal component can b e modelled as a stochastic trigonometric seasonal:
s / 2 r, = ' L r J J* « f j j . cos Aj sin Aj - sin Aj cos Aj~ ~ r j f + * * 3 1
___
~ NIDv os[ a l ° i i J b v iJ L®7VJ L JJ J0) \w . 0 < r il (5)where s is the number o f seasons in the year and the seasonal frequencies Aj = I n j l s , with j- 1 , . . (s/2). Note that both y/*and y* appear as a result of the construction of th e processes and have no particularly important interpretation.
The statistical treatment o f UC models is based on the corresponding state space form and die application of the Kalman filter and associated smoothing algorithms, which allow the likelihood function to be recovered and thus permit estimation of the parameters (T ,and/?), the variances and the various unobserved components.28
The main advantages of the UC model-based approach to estimate the deviation cycle is that it is possible to estimate the various components o f the reference time scries in a unified coherent statistical framework, which allows a set o f statistical tests to be carried out to assess the goodness of specification. As a result, if these tests are used rigorously spurious cycles can be avoided. Moreover, it offers a general and flexible framewTork, 28 See for example Proietti (2002) and references therein for the details of the statistical treatment. Except
for few cases specified, all computations have been carried out with STAMP 6.01 (see Koopman et al., 2000) and Ox 2.00 (see Doomik, 1998).
which for example also encompasses the Hodrick-Prescott filter. \\ lthin UC models it is also relatively easy to detect and deal with structural breaks and outliers, advantages which are not always present in alternative approaches.
23
á i i i i .
Chapter 1 - Evidence
on the existence of the
euro area business
cycle
26
I . I n t r o d u c t i o n
The European countries which in the aftermath of the Second Wrirld W ar decided to undertake a process of economic integration, as part of a more general plan o f political integration, chose from the start a gradualist approach. Although slow and not always smooth, the process of European economic integration, started in die 1950s, has reached a remarkably advanced stage. The progressive dismantlement of barriers to trade of goods, sendees and capital and to the movement of labour was initiated by six member countries in 1957 with the ratification o f the Treaty7 of Rome and has given rise to a single market within the European Union (EU), achieved in 1993 during Stage I of Economic and Monetary Union (EMU). Monetary cooperation, started with the creation of a European Payments Union in 1950, made substantial progress after 1979 with the introduction of the European Monetary System and culminated in 1999 with die adoption of a common currency, the euro, and the transfer of the responsibility of a common monctarv policy to a supranational institution, the European Central Bank. National fiscal policies of most EMU member countries have significantly converged during the 1990s, largely as a result of die budgetary convergence criteria o f the Maastricht Treaty which came into effect in 1993, and are now7 disciplined by a set of common rules and regulations contained in the Stability and Gnnvtli Pact approved in 1997. These events have gradually made possible the emergence of an economic area in Europe with some common fundamental economic features, normally referred to as the euro area (or, sometimes, as euro zone or Euroland).
Despite the progress in economic integration and the increased economic policy convergence recorded among euro area countries in the past five decades, the question emerges as to wrhether a common euro area business cycle exists, and if it does since wdicn. In other words, over which period do the common features prevail over the idiosyncratic characteristics such that it makes sense to refer to a common euro area business cycle? To w'hat extent docs it makes sense to refer to an aggregate euro area cycle prior to the creation of EMU or the incqition of the EMS? These questions are important for institutions such as the ECB, wdiich, for the purpose of maintaining price stability in the euro area, has necessarily to focus its attention on medium term developments at aggregate level. Thus, the ECB monitors constantly a wide range o f euro
27
arca business cycle indicators, but in analyzing them it is necessary to know to what extent they depart from the historical regularities of euro area fluctuations. These questions are also important for national governments, which in setting fiscal policies (intended in the most general terms to include the determination of the characteristics of automatic stabilizers) need to know to what extent the business cycle dynamics conform to those of the other member countries.
Several studies have appeared in recent years which, directly or indirectly, attempt to identify the common features among euro area business cycles, with mixed results. As a result several analysts are still sceptical about the adequacy of adopting a euro area aggregate perspective in analyzing fluctuations in the euro area and, therefore, the existence o f the euro area business cycle is still an open question. The literature will be discussed in the next section, but we anticipate that in our opinion most studies suffer from some important limitation such that most results are not fully reliable for the purpose of establishing whether a euro area business cycle exists.
This chapter attempts to provide an answer to the question o f the existence o f euro area aggregate fluctuations by adopting an analytical approach which does not suffer from the limitations of most o f the studies in the literature. W e proceed by applying those methods which w e think are most adequate and robust to analyse cross-country cyclical comovements and convergence, with more attention to statistical inference than typically is done in the literature.
Overall, it is found that the business cycle association am ong euro area countries from 1960 to 2003 is positive and highly significant. Moreover, affiliations o f business cycles within the euro area have become stronger, relatively more than those with other economies, notably the US economy, especially since the late 1980s, While euro area cycles are clearly also associated with those of other OECD countries, the evidence suggests that the common cyclical developments in the euro area can hardly be described as resulting from a world cycle led by the US or more generally deriving from the process of globalization, other than for very limited sub-periods and for few specific episodes and
countries. In sum, these findings suggest that there is clear evidence of a region-specific euro area business cycle, which started to emerge more forcefully since the late 1980s.
The chapter is organized as follows. Section 2 summarises and discusses the existing related literature. Section 3 describes the methods and data used in the empirical analysis, the results o f which are reported section 4. Section 5 draws the conclusions from the whole analysis.
I I . T h e r e l a t e d l i t e r a t u r e : r e s u l t s a n d s h o r t c o m i n g s II. 1. An overview o f the related literature
The Delors Report of 1989, which proposed a set of concrete stages that would lead to EMU and that were largely adopted in the Maastricht Treaty, provoked a debate among economists on the desirability of EMU from an economic point of view. The main theoretical framework which represented the background for most analytical contributions was the Optimum Currency Area (OCA) theory, formulated by Mundell (1961) and later refined among others by McKinnon (1963) and Kenen (1969). In a nutshell, the basic OCA theory suggests that two countries should form a currency union if the savings in transaction costs, which are higher the higher the degree of openness, exceed the rise in adjustment costs, which result from relinquishing the national monetary and exchange rate policy and which are higher the more frequent are large asymmetric shocks and the lower is labour flexibility*. Operationalisations of the OCA theory and applications to the case of EMU often focused on the symmetry of shocks criterion. In this respect, an influential contribution was that of Bayoumi and Eichengreen (1993), who used structural VAR analysis and the Blanchard-Quah identification scheme to examine whether aggregate supply and aggregate demand shocks were asymmetric among the EU countries. They found some evidence o f a “core” subset o f EU countries with higlily correlated disturbances with those o f Germany (Austria, Belgium, Denmark, France, Luxembourg and the Netherlands), taken as the centre country, while the other EU countries constituted a periphery set o f countries from this point of view. Subsequent studies, which also took into consideration the other criteria suggested by OCA theory,
generally confirmed the evidence for a core and a periphery among EU countries.29 However, the assessment of EMU on the basis of the empirical implementation of the OCA approach is not immune from problems. First, it is very difficult to quantify all criteria suggested, needed to establish whether the net benefit in forming a monetary union is positive or negative. Second, for each single OCA criterion such as the symmetry of shocks one it is difficult to select a method which is not arbitrary and there is no obvious metric on the basis o f which to conclude when the quantifications are “close enough” to some ideal reference point.30 This problem explains why studies aimed at answering the question as to whether Europe is an OCA have not always led to the same conclusions.31
A parallel literature emerged on the degree of business cycle synchronisation among European countries, more directly related to our analysis. The basic motivation of these studies was to establish whether cycles were sufficiently synchronised to ensure that the adoption o f a com m on monetary policy would not be destabilising for some countries. The idea is similar to the symmetry o f shocks criterion o f OCA theory’, assuming that short-run dynamics (i.e. business cycles) are mainly related to demand shocks and that monetary policy is more relevant in the short-run. However, this alternative perspective does not attempt to disentangle shocks and propagation mechanisms, a task which is very difficult and not strictly needed as both impulse and propagation mechanisms are relevant. The conclusion most often reached by the studies on co-movement and convergence am ong euro area business cycles was that, while euro area business cycles are less synchronised than US states or regions, there is some evidence o f an increase in cyclical convergence among euro area countries, especially since the adoption of the ERM. M ore precisely, among those studies which examine cyclical co-movements among euro area cycles (either deviation cycles or classical cycles) in the various sub-periods o f
29 See for example Artis (2003) and Mongelli (2002) and the literature cited therein.
30 This problem seems to concern also the US, as some recent studies concluded that also in the US asymmetric shocks are significant and that the US does not meet the requirements o f an Optimum Currency Area, see for example Kouparitsas (2001) and Del Negro (2002).
31 Examples are Eichengreen (1990), Caporale (1993), de Grauwe and Vanhaverbeke (1993) and Boftnger (1994).
the post-war era a majority found that it has increased,32 while some found that is has remained broadly stable33 and few that is has decreased.34 These contrasting conclusions largely reflect the different methodologies used. Appendix 1 provides schematic summaries of the main published relevant studies.
II. 2. Shortcomings of the literature
While it is difficult to assess which approach is more credible in all respects, in our opinion most studies suffer from some important limitation which undermine the reliability of the conclusions that can be drawn in relation to the main question addressed: whether it can be concluded that a common euro area business cycle exists (and if so, since when). These shortcomings could be classified into three groups:
1) Data used:
A) Frequency: several studies adopt as reference series to summarise the cycle some series (typically real GDP or total employment) at annual frequency. The problem of this approach is of course that using annual data implies that much of the business cycle dynamics is lost;35
B) Sectoral data: most often industrial (or manufacturing) production series are used as reference series to summarise the cycle. This approach has the advantages that these data is available for longer time period compared to other time series such as real GDP or employment and it is relatively highly harmonised across country. However, the industrial sector not only represents just about a fourth (or, for some countries, about a third) of total value added but it is also particularly affected by international developments (the industrial sector being mostly formed by tradable sectors) such that the evidence on interdependence is likely to be distorted upwards
32 See for example Artis and Zhang (1997), Fatas (1997), .Artis and Zhang (1999), Wynne and Koo (2000), Krolzig (2001), Vijselaar and Albers (2001) and Artis (2004).
33 See for example Dopke (1999), Q ark and van W’incoop (2001) and Artis (2004, Siebert ed). 34 See for example Mills and Holmes (1999) and Inklaar and den Haan (2001).
35 In relation to this point we agree with die view o f Cooper (1998) that “it was agreed long agp that the causal dynamics o f business cycles could not be discerned by inspecting annual data, however carefully. Quarterly and preferably monthly data are needed.” (p. 118).
(or, in fact, the evidence should be interpreted as relating to so-called industrial cycles rather than economy-wide business cycles);36
C) Sample size: in some studies the data set tends to be too small, either in terms of number o f economies considered (with relatively fewT euro area countries, or a lack o f other European or OECD economies which should be used as reference to assess euro area specificities) or in terms of time period, such that it is difficult to reach conclusions on die existence o f a common euro area (or European) business cycle and not all relevant questions can be addressed.
2) Methods:
A) Cycle extraction: in most studies business cycles are extracted with methods which include one or more am ong deterministic detrending, the Whittaker-Henderson filter advocated by Hodrick and Prescott (1997), frequenqT domain-based filters such as the band-pass filters suggested by Baxter and King (1999) and Christiano and Fitzgerald (1998), m oving average detrending, and phase trend averaging among others. All these ad hoc methods tend to exhibit a fundamental limitation: they may produce spurious cycles, in the sense that they may extract a cycle from series which de facto have none (this is the so-called Yule-Slutsky effect).37 While the danger o f creating distortions arises mainly from the mechanical application o f these filters, it can be argued that only within a model-based framewrork can the dangers o f extracting spurious cycles be avoided.38
B) Measures o f association: the assessment of co-movement is often carried out only on the basis o f correlation indices. However, this index prorides a measure only for linear relationships, while non-linear relationships can also be relevant. Moreover, not only synchronisation m easures such as the correlation index are of interest, but also measures of the degree o f dispersion, which however are often ignored. To 36 In addition to the studies summarised in Appendix 1, other studies, such as Camacho et al (2005), use
industrial production.
37 These distortionary effects are documented by Nelson and Kang (1981) for linear detrending, by King and Rebelo (1993), Harvey and Jagcr (1993) and Cogley and Nason (1995) for the Hodrick-Prescott filter37, by Benati (2002) and Murray (2003) for the band-pass filter, by Osborn (1995) for moving average detrending.
38 In addition to the studies summarised in Appendix 1, other studies, such as Perez et al (2003), use filters such as the Baxter and King band pass filter and the Hodrick and Prescott filter.
illustrate in a simple fashion how both measures are relevant, Figure 1 below shows different possible combinations o f synchronisation and dispersion. Both measures are clearly relevant: for example, from a stabilisation policy point of view, it is important to know whether the cycles of the economies for which a common policy measure is chosen move in the same direction and are all above or below trend, but also whether the distance from the trend is similar or varies to a large extent.
C) Standard errors: most often no standard errors to the measures of association are reported, and even more rarely are robust, or heteroskedasticity and autocorrelation consistent (HAC), standard errors computed, which are particularly important for macroeconomic time series. Thus, most often it is not possible to conclude whether synchronisation or dispersion is significant, whether it significantly increased over time or whether the association within the euro area are significantly higher than for example with respect to the US.39
Figure 1 - Combinations of synchronisation and dispersion
HIGH SYNCHRONISATION LOW SYNCHRONISATION
L 0 W 3] 2 ■ 1 ■ ■1 *2
v
7\ J
J -y v y v39 The danger of spurious cycles and the need o f standard errors in relation to business cycle stylised facts identification were forcefully shown by H an e y and jager (1993), who conclude that “the danger of finding large sample cross-correlations between independent but spurious HP cycles is not negligible” and that “research on stylised business cycle facts should report standard errors in addition to point estimates of cross-correlations.” (p. 245). 33 K: I; l i Hi I : I ; lii; «I;. (£):i feii