HYDRAULIC OIL FINGERPRINT CONTAMINATION DETECTION FOR
AIRCRAFT CFRP MAINTENANCE BY ELECTRONIC NOSE
M.Salvato, S.De Vito, M.Miglietta, E.Massera, E.Esposito, F.Formisano, G.Di Francia
ENEA- Italian National Agency for New Technologies, Energy and Sustainable Economic
Development. C.R. Portici, P.le E. Fermi, 1, 80055 Portici (NA)
ABSTRACT
The full-scale adoption of light-weighted carbon fiber reinforced plastics (CFRP) in the primary aircraft structures cannot be safely achieved without a reliable quality assurance protocol. A pre-bond cleaning state inspection of adherents surfaces by means of Non-Destructive Tests (NDTs) is absolutely necessary in order to guarantee the strength of bonded joints and so the structural aircraft integrity. Hydraulic-oil fingerprint contamination mainly occurs during aircraft maintenance operations, due to wrong handling by workers. It may severely affect the mechanical properties of bonded joints. Here, an ENEA customized electronic nose solution and a suitable measurement methodology are proposed as NDT tool for pre-bond detection of the Skydrol contamination state of the involved surfaces, at least at high concentration level. The protocol provides a reliable and efficient strategy to uplift and extend the technology readiness level (TRL) of NDTs allowing to overcome existing limitations in adhesive bonding for CFRP materials.
Index Terms— E-nose technology, Aerospace industry,
hybrid e-nose, surface contaminations, NDT. 1. INTRODUCTION
The use of light-weight composite materials based on CFRP in the modern aircraft structure succeeds in reducing CO2 emissions and transport fuel costs (up to 15% on a per-mile-passenger basis). CFRP panels assembly occurs mainly through adhesive bonding instead of riveting. The cleaning state of adhesion zones to be bonded is of great concern because of its influence on mechanical properties of the bonded joints, such as Mode-I (opening) and II (in plane shear) fracture toughness (GIC [1] and GIIC). Panels contamination, unfortunately, may occur frequently during production and maintenance stage causing weak bonds.
These are obviously perceived as unacceptable for their potential risks to aircraft structural integrity and, hence, for passengers safety. Hence, an assessment protocol, based on NDTs, able to evaluate the contamination state of the panels is essential for the safety. During the last decade, some NDTs technologies, among which an e-nose based one, have shown to be suitable for pre- and post-bond inspection of adherent surfaces and adhesively bonded joints [2]. These assessments, produced during previous EU funded research projects (FP7-ENCOMB), have been mainly carried out in laboratories in controlled environments with CFRP samples subjected to significant contamination levels. These conditions were far from what it can be expected to be found in real assembly or maintenance scenarios. As such the TRL of these techniques was found to stay in the low (1-3) end of its scale. A new project (H2020-COMBONDT) is now aimed to raise the TRL of such extended NDT. For this reason, contaminated test samples are adapted in a way to be much more similar to real contamination scenarios. This work presents the architecture of SNIFFI, an ad-hoc developed open sourced e-nose [3] and the preliminary results obtained by its use as a contamination detector in the high TRL scenario characterized by the new batch of CFRP samples.
2. EXPERIMENTAL SETUP
The main relevant scenarios for CFRP panels bonding quality assurance are assembly, when panel are firstly bonded during aircraft construction, and maintenance, when panels are repaired after operative duties. This work is focused on the latter scenario. After the detection of a damage, the panel is locally scarfed to remove the outer damaged layers. These are then substituted with a patch that is bonded over the scarfed area. In this scenario, CFRP panels have been contaminated by a project partner with specific expertise in the application field, at three different
concentration levels, by means of several contaminants including artificial fingerprints of hydraulic oil and potassium formiate based de-icer fluids.A separate surface damage has been induced by panel or exposure to high temperatures so to generate thermal degradation of its structure. Each contamination level has been determined in a way to yield a loss of bond strength of up to 30% of the initial strength. In particular, artificial hydraulic oil fingerprint (marked as FP) contamination consists in causing marks by gloved finger simulator. The glove was previously dipped in Skydrol®500-B aviation hydraulic fluid. De-icer contamination levels have been characterized by XRF as producing a percentage increase of potassium remaining at surface from 6.4 to 12 at% K. Thermal degradation has been achieved by heat treatment of panels, for 2 hours, at three different temperatures (220°C;260°C;280°C). Here, a customized implementation ENEA e-nose (Fig.1), has been proposed for pre-bond surface contamination state inspection. It is a chemical multisensory device with 6 metal-oxide (MOX) and 1 photo-ionization detector (PID). Additional 6 custom graphene sensors slots are present, but we didn’t resort to them in this experimental setting. It operates with an IR emission based desorption helper conceived to raise the sample temperature and stimulate the emissions of residual volatiles from the contaminated surface.
Figure1. Block design of the our e-nose prototype.
On average, the target temperature was 35 °C. The e-nose measurement protocol foresees the coupling of the inlet of e-nose with the sample under measurement. The measurement process encompasses a baseline acquisition phase in which the e-nose is exposed to filtered air followed by an acquisition phase in which the sensor array is exposed to the volatiles coming off the surface of the samples. During this phase, the IR emitter is kept on. After the switching off of the IR emitter the sensors reach a steady state phase after which the sensor chamber is again exposed to filtered air to perform sensor washing process. The resulting signal is a smoothed square wave (Fig.2). Two different sampling methods have been implemented in order to detect contaminants preventing any negative impact on the CFRP sample. The first one is the standard measurement
method, named as “0-Method”. It makes use of no additional treatment (with the exception of the IR irradiation) on the sample. The second one, named “PC-method”, enhances the extraction of volatiles by treating the surfaces with a suitable low-boiling solvent. The process is performed spraying few millilitres of ethanol with an airbrush over the surface of the sample. The adoption of PC-method was motivated by the need to improve the desorption of the volatiles. In addition, this treatment allows
Figure2. MOX sensors response to Skydrol (highest contamination). to differentiate between surfaces also on the basis on their capability to retain and desorb the solvent as a function of the surface contamination. Whatever adopted method, from each sampled signal, several features have been extracted in order to describe the variability of e-nose response with a limited set of values. For this scenario, we take in account the six MOX sensors and the PID sensor, in Table 1 their correspondent features.
# Feature Description
Feature1 (x7) Steady State Response (wrt avg baseline)
Feature2(x7) Steady State Response – IROff (wrt avg baseline)
Feature3(x7) Desorption Status (wrt avg baseline)
Feature4(x7) Uptake Derivative
Feature5(x7) Desorption Derivative
Feature 6 Temperature
Feature 7 RH
Table 1: Description of the extracted features for each single sensor.
3. RESULTS
Here, we show capability to detect and discriminate Skydrol contamination at least at the highest concentration level (FP-3). In Table 2, we report the total amount of sampled measurements, for each method and each Skydrol concentration level (FP-1,-2,-3). The obtained measurement data have been processed to extract the previous mentioned features.
0-Method PC-Method FP-1 -- 3 FP-2 1 3 FP-3 6 7 All (interferents) 18 28 Total 25 41
Table 2: Total number of measurement for each method. The two resulting datasets contain respectively a total of 37x25 features, for the 0-method, and 37x41 features, for PC-method. Data have been normalized per column (sensor) to zero mean and unitary variance. Then, a principal component analysis has been performed to extract the most of the signals variance on the first components. Figure 3 reports the scattering in the plane of the PCA scores in the first two variance significant components. Centres of the clusters, computed as mean of scores related to each class, are highlighted as well as their standard deviation (1-sigma) ellipses. This representation aims to show a preliminary qualitative evaluation of the variance distribution (inner and outer) for contamination classes through the clusters localization and spatialization. In Figure 3(left), the 2D scatterplot of PCA scores, from data sampled by 0-method, shows that FP-3 cluster is partially overlapped to interferents cluster. Skydrol scores appear to be so sparsely displaced along these first principal components that their variance does not even allow for a sufficient 1–sigma level of separability. It gives a reason to believe that a classifier hardly could discriminate Skydrol from its interferents, even when it presents at the highest concentration level. Of course, discriminant information could be embedded on lower variance principal components.
Figure 3. PCA plot (2D) along the first two components of data sampled by 0-method and PC-Method,respectively
In order to ameliorate the potential discrimination capability of the overall system, a different protocol of measurement, probe chemical based, has been adopted because it is seems more able to emphasize the Skydrol contamination status. As we can see in Figure 3(right), FP-3 is clearly distinguishable from the cloud of remaining data scores. Moreover, a consistent, more than 1-sigma, separation distance appears between FP-3 and the other samples including Skydrol at the lower concentrations. Finally, further preliminary analysis by means of classical machine learning algorithms clarified e-nose capability to detect and discriminate FP contaminated panels (at all three
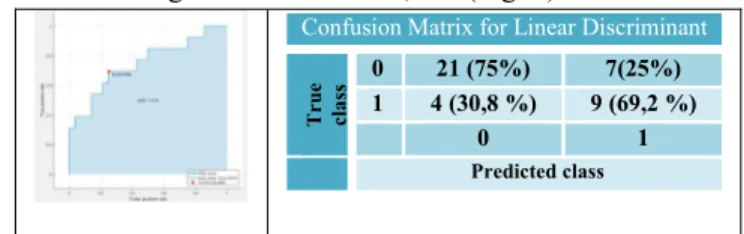
concentrations) when sampled by PC-method. Leave one out validation technique has been used to adequately evaluate the performances in terms of correct classification rate. Among the different ML techniques, a simple linear classifier provided for a correct classification rate of 73,2% with a false negative rate set to 30,8 % (Fig. 5).
Confusion Matrix for Linear Discriminant
Tru e cl ass 0 21 (75%) 7(25%) 1 4 (30,8 %) 9 (69,2 %) 0 1 Predicted class
Figure5. ROC curve and Confusion Matrix for a Linear Discriminant. 0 and 1 are, respectively, the class of uncontaminated and
contaminated class
Moreover, the value of area under ROC curve (Fig. 5) was evaluated to 0.74. This is a promising result if we take in account that the problem, as shown by the PCA analysis, was definitely a hard one, especially when dealing with lowest concentration levels. Summarizing, PC sampling method enhances cluster contaminants separation mitigating our e-nose limitations and allowing to detect Skydrol at least at the highest contamination level.
3. CONCLUSIONS
An ad-hoc e-nose solution and a suitable measurement protocol have been customized to provide pre-bond NDT inspection of cleaning surfaces state of CFRP panels, in aircraft maintenance scenarios. Although the results presented herein are still preliminary, the proposed chemical probe method seems to enhance detection and discrimination capabilities of hydraulic-oil artificial fingerprint contamination for the open source prototype SNIFFI.
4. ACKNOWLEDGEMENTS
This work has received funding from the European Union’s Horizon 2020 research and innovation programme under grant agreement No 636494, Project name COMBONDT.
5. REFERENCES
[1] D.N. Markatos et al., “Effects of manufacturing-induced and in-service related bonding quality reduction on mode-I fracture toughness of composite bonded joints for aeronautical use”,
Composites B: Eng., Vol. 45, 556–564.
[2] M. Salvato et al., "An Holistic Approach to e-Nose Response Patterns Analysis—An Application to Non-destructive Tests," in
IEEE Sensors Journal, vol. 16, no. 8, pp. 2617-2626, April15,
2016.
[3] E. Massera et al., "SNIFFI," 2015 XVIII AISEM Annual
Conference,Trento,2015,pp.1-4. 2 P ri nc ip a l C o m pon en t -16. 80 % 3 Principal Com ponent -16.12%