Contents lists available atScienceDirect
Environmental Research
journal homepage:www.elsevier.com/locate/envresLegionella and legionellosis in touristic-recreational facilities: Influence of
climate factors and geostatistical analysis in Southern Italy (2001–2017)
Osvalda De Giglio
a, Fabrizio Fasano
a, Giusy Diella
a, Marco Lopuzzo
a, Christian Napoli
b,
Francesca Apollonio
a, Silvia Brigida
c, Carla Calia
a, Carmen Campanale
a, Angelo Marzella
a,
Chrysovalentinos Pousis
a, Serafina Rutigliano
a, Francesco Triggiano
a, Giuseppina Caggiano
a,
Maria Teresa Montagna
a,∗aDepartment of Biomedical Science and Human Oncology, University of Bari “Aldo Moro”, Piazza G. Cesare 11, 70124, Bari, Italy
bDepartment of Medical Surgical Sciences and Translational Medicine, “Sapienza” University of Rome, Via di Grottarossa 1035/1039, 00189, Rome, Italy
cWater Research Institute-Italian National Research Council, Bari, Italy
A R T I C L E I N F O Keywords: Legionella Geostatistical analysis Climate Touristic facilities A B S T R A C T
Legionella is the causative agent of Legionnaires' disease, a flu-like illness normally acquired following inhalation or aspiration of contaminated water aerosols. Our recent studies revealed that climatic parameters can increase the number of reported cases of community-acquired Legionnaires' disease. Here, we evaluated the presence of Legionella in water networks and the distribution of Legionnaires' disease cases associated with touristic-re-creational facilities in the Apulia region (southern Italy) during the period 2001–2017 using geostatistical and climatic analyses. Geostatistical analysis data revealed that the area with the highest concentration of Legionella in water systems also had the greatest number of cases of Legionnaires' disease associated with touristic-re-creational facilities. Climatic analysis showed that higher daily temperature excursion (difference between maximum and minimum temperature) on the day of sampling was more often associated with Legionella-positive samples than Legionella-negative samples. In addition, our data highlighted an increased risk of Legionnaires’ disease with increases in precipitation and average temperature and with decreases in daily temperature ex-cursion (difference between maximum and minimum temperature over the course of 24 h in the days of in-cubation period of disease) and minimum temperature.
Healthcare professionals should be aware of this phenomenon and be particularly vigilant for cases of community-acquired pneumonia during such climatic conditions and among the tourist population. The in-novative geo-statistical approach used in this study could be applied in other contexts when evaluating the effects of climatic conditions on the incidence of Legionella infections.
1. Introduction
Legionella is a facultative intracellular Gram-negative micro-organism responsible of infectious disease commonly called legio-nellosis. The different clinical forms of legionellosis range from severe pneumonia known as Legionnaires’ disease (LD), to a flu-like illness, Pontiac fever. Legionellosis is usually acquired by inhalation or as-piration of aerosols originating from water sources containing
Legionella. This microorganism is ubiquitous in natural and artificial water systems (Costa et al., 2010; Graells et al., 2018; Haupt et al., 2012; Montagna et al., 2012, 2016; 2017a, 2017b; 2018; De Giglio et al., 2019) sediments and soils as individual cells, but is most com-monly found colonising amoeba or within biofilms (Fields, 1996). Le-gionella grows at temperatures between 25 °C and 45 °C (Garrity et al., 2005), but can survive at temperatures ranging from 5.7 °C to 63 °C, especially if the water is stagnant (Borella et al., 2005; Napoli et al.,
https://doi.org/10.1016/j.envres.2019.108721
Received 21 May 2019; Received in revised form 2 September 2019; Accepted 3 September 2019 Abbreviations: (LD), Legionnaire's disease; (sg), serogroup; (IQR), interquartile range
∗Corresponding author.
E-mail addresses:[email protected](O. De Giglio),[email protected](F. Fasano),[email protected](G. Diella),
[email protected](M. Lopuzzo),[email protected](C. Napoli),[email protected](F. Apollonio),[email protected](S. Brigida), [email protected](C. Calia),[email protected](C. Campanale),[email protected](A. Marzella),[email protected](C. Pousis),
[email protected](S. Rutigliano),[email protected](F. Triggiano),[email protected](G. Caggiano), [email protected](M.T. Montagna).
Environmental Research 178 (2019) 108721
Available online 06 September 2019
0013-9351/ © 2019 The Authors. Published by Elsevier Inc. This is an open access article under the CC BY-NC-ND license (http://creativecommons.org/licenses/BY-NC-ND/4.0/).
2010). Several studies on the ecology of the Legionella genus have highlighted the limitations of detection system reliant on culture-based methods and the importance of taking the life cycle of the pathogen into account. For example, significant numbers of Legionella isolates have been recovered from cold waters sources (Wullings and van der Kooij, 2006; Wadowsky et al., 1985), including Antarctic lakes (~0 °C) (Carvalho et al., 2008) using cultivation-independent techniques. For this reason, it is important to investigate all environmental parameters influencing the presence of Legionella (Graells et al., 2018).
The susceptibility of different individuals to the same source of in-fection depends on individual host factors and on concomitant diseases (Montagna et al., 2006;Napoli et al., 2010). To date, 61 species and more than 70 serogroups (sg) of Legionella have been reported (Euzéby, 2019, http://www.bacterio.net/legionella.html). In particular, the species Legionella pneumophila, which is most frequently associated with human disease, includes 16 serogroups. However, the number of Le-gionella species is constantly changing due to recent isolated species (Palmer et al., 2016; Relich et al., 2018). Although previous studies have shown that Legionella pneumophila sg 1 strains are the most cause of disease in humans, an increasing number of cases are being attrib-uted to other species and serogroups (ECDC, 2018;Napoli et al., 2010; Palmer et al., 2016;Relich et al., 2018).
The surveillance of legionellosis in Europe is coordinated by the European Centre for Disease Prevention and Control (ECDC), and in Italy by the Italian National Institute of Health. Since 2010, the ECDC has coordinated European Legionnaires’ Disease Surveillance Network (ELDSNet) an international surveillance of travel-associated LD. According to national data (ISS, 2018), in 2017, a total of 2014 legio-nellosis cases were reported in Italy (33.2 cases per 1 million in-habitants), corresponding to a slight increase with the previous year (28.2/1,000,000). After community-associated cases (n = 1,580, 78.5%), the largest number of cases was associated with travel (n = 239, 11.9%; Italian citizen diagnosed in Italy), followed by healthcare facility-associated cases (n = 124, 6.2%) and other cases (n = 71, 3.5%). If foreign tourists who likely acquired the infection in Italy but were diagnosed elsewhere were also considered, the number of travels-associated legionellosis cases in 2017 increased to 436 (ISS, 2018; European Centre for Disease Prevention and Control (ECDC), 2018). Overall, the case fatality rate in Italy ranges from 10.1% for community-associated cases to 51.1% for nosocomial cases (ISS, 2018). In 2015, all of the national recommendations for the prevention and control of legionellosis, including those for touristic-recreational facil-ities, were incorporated into a single updated document (Linee, 2015; Regione 2015). These instructions list risk assessment evaluation as one of the most effective prevention measures for managing Legionella contamination of water systems. This is particularly relevant in tour-istic-recreational facilities because they often have complex water sys-tems with a large number of outlets (e.g., showers) (Ricketts et al., 2010). In the absence of regular flushing, such as in unoccupied rooms or during annual closure, water may stagnate in pipes, favouring the growth of Legionella. In addition, it can be difficult to maintain adequate temperature control of hot and cold water within long pipe systems (Phin et al., 2014).
In 1998, the government of Apulia region (southern Italy) estab-lished a regional epidemiological observatory (OER-Apulia) at the Department of Biomedical Science and Human Oncology, University of Bari Aldo Moro. The observatory is tasked with monitoring and per-forming surveillance of sanitary events, including all clinical forms of legionellosis. Since 2000, ongoing environmental and clinical mon-itoring of Legionella has been conducted throughout all of the regional territories (Montagna et al., 2006, 2012;Napoli et al., 2007, 2009a, 2009b), with all environmental and clinical isolates being stored in a stock archive for further studies (Iatta et al., 2013a,2013b;Montagna et al., 2016). Data are regularly entered into an informatic and in-tegrated platform that allows for the delivery of real-time information concerning notified cases and the distribution and degree of
contamination in public and private water systems.
One of the main activities of the Apulia region is tourism thanks to its geographical and climatic characteristics, well as its popularity as a pilgrimage destination (Castellani Pastoris et al., 2002). The official tourism observatory of the Apulia region, Puglia Promozione, publishes data regarding tourism in Apulia compared with other regions in Italy in collaboration with the Italian National Institute of Statistics. Apulia is among the top 10 Italian tourism regions in terms of the number of overnight stays (Portale dell'Agenzia REgionale del Turismo
PUGLIA-PROMOZIONE, Report data 2017, https://www.
agenziapugliapromozione.it/portal/web/guest/osservatorio-del-turismo). Over the last 17 years, the Apulia region recorded 519 cases of LD, amongst which 230 cases (44.3%) were contracted from tour-istic-recreational facilities (Portale dell'Osservatorio Epidemiologico regionale, https://www.sanita.puglia.it/osservatorio-epidemiologico-regionale). Currently, Italian and regional guidelines (Linee, 2015; Regione Puglia 2015) on the control and prevention of legionellosis at touristic-recreational facilities are considered reference documents only and are not enforced. As such, very little is known about the im-plementation rates of these guidelines (Montagna et al., 2018).
Several studies have reported that climate change leading to in-creased water temperature, drought, higher rainfall, rising sea levels and flooding could play an important role in the transmission of wa-terborne diseases, including legionellosis (Beautè et al., 2016; Brandsema et al., 2014;Conza et al., 2014;Garcia-Vidal et al., 2013; Karagiannis et al., 2009;Walker, 2018). Therefore, combining classical statistical analysis methods with georeferencing analyses may be of particular use in understanding the sources of contamination (Laganà et al., 2015).
The aim of the current study was to evaluate the presence of Legionella in water networks and the distribution of legionellosis cases associated with touristic-recreational facilities in the Apulia region of southern Italy during the period 2001–2017, using geostatistical and climatic analyses.
2. Materials and methods
2.1. Geographical area of study
Apulia, in south-eastern Italy, is a region between the Adriatic and Ionian seas. With a land surface area of 19,347 km2, the region has about 800 km of coastline and 4 million inhabitants. It is characterised by a typical Mediterranean climate, with mild, dry winters and hot summers. Rainfall is the largest source of groundwater recharge, but is highly irregular throughout the year. Therefore, water is supplied by the Apulian Aqueduct, which draws from a large network (~20,000 Km2) of interconnected natural and artificial water reservoirs (Sinni-Pertusillo, Sele, Calore, Locone, Ofanto, Fortore) (Fig. 1) and has a complex system of drainage wells, with different purposes (drinking, irrigation and industrial) (De Giglio et al., 2016). Based on data from the Italian National Agency for the Environmental Protection, Apulia has some of the highest average temperatures across all regions of Italy; moreover, although it is not among the regions with the highest rainfall (ISPRA 2014, http://www.isprambiente.gov.it/files/pubblicazioni/ statoambiente/copy_of_SA_55_14_Valori_climatici_normali.pdf), it is characterised by areas (Gargano), where rainfall is consistently higher than in the rest of the region (Istituto Superiore per la Protezione e la Ricerca Ambientale - ISPRA, Regione Puglia 2014). Based on homo-geneous climatic data, it is possible to distinguish five distinct areas of the region (Gargano, Tavoliere, Murgia, Salento, Arco Jonico) (ISPRA 2014, http://www.isprambiente.gov.it/files/pubblicazioni/ statoambiente/copy_of_SA_55_14_Valori_climatici_normali.pdf;De Giglio et al., 2016).
2.2. Touristic-recreational facilities
After considering a proportionate and representative territorial distribution of all Apulian tourist-recreational facilities (n = 6332), 495 facilities (7.8% of all Apulian tourist-recreational facilities) were en-rolled in our study, with 6638 water samples analysed in total. The characteristics of each facility, including type (e.g., hotel, B&B), clas-sification (number of hotel stars: 1–5), period of activity (i.e., annual or seasonal) and tourist arrivals (grouped by municipality, month and year), were acquired from two regional official websites (Portale uffi-ciale del turismo della Regione Puglia,https://www.viaggiareinpuglia. it/hp/it;Portale dell'Open Data Puglia,http://www.dataset.puglia.it/). 2.3. Microbiological investigation
Sampling and processing procedures were performed according to the Italian guidelines (Linee, 2000, 2015). Water samples (1 L) were collected from showers (42.4%), taps (36.1%), boilers (26.6%) and other sampling points (16.6%) in sterile containers containing sodium thiosulphate pentahydrate (0.01%, w/v) to neutralise chloride present in the water, and were transported at environmental temperature in the dark. Samples (1 L) were filtered through 0.2-μm isopore polycarbonate membranes (Millipore Corporation, Bedford, MA, USA), with the membrane then resuspended in 10 ml of the same water sample and vortexed. A 5 ml aliquot of the suspension was then incubated at 50 °C for 30 min. Aliquots (100 μl) of both the heat-treated and untreated samples were seeded onto GVPC (glycine vancomycin polymyxin cy-cloheximide) agar plates (BioMérieux, Marcy l'Etoile, France) and in-cubated at 36 ± 1 °C for 10 days in a modified atmosphere (2.5% CO2). It was not considered necessary to carry out acid treatment because the analysed samples were not abundant in contaminating flora. Putative Legionella colonies were subcultured on buffered charcoal yeast extract (BCYE) agar (BioMérieux, Marcy l'Etoile, France) and BCYE agar without cysteine (BioMérieux, Marcy l'Etoile, France). Colonies that grew only in the presence of cysteine were identified as Legionella and
confirmed using a latex agglutination test with polyvalent (Oxoid Spa, Milan, Italy) and monovalent antisera (Biogenetics Srl, Tokyo, Japan) (ISO 11731, 1998) as per the manufacturer's instruction. As re-commended by the Italian guidelines (Linee, 2015), water samples containing < 100 colony-forming units per litre (cfu/L) were con-sidered negative for Legionella. Facilities with at least one positive sample were considered positive for Legionella.
2.4. Data collection
2.4.1. Cases of travel-associated legionellosis
All legionellosis cases notified to OER-Apulia in the years 2001–2017 were included in this study. A case of legionellosis was considered travel-associated if the patient had slept away from home for one or more nights in the 10 days prior to the onset of symptoms (Linee, 2015;Regione Puglia, 2015;2018). Legionellosis cases notified to OER-Apulia also included foreign tourists (coming from another lo-cation or country) who had stayed in the Apulia region (ELDSNET surveillance system).
2.4.2. Climatic characteristics
Climatic data were obtained from meteorological stations present in the region (Portale della Protezione Civile Puglia, http://www. protezionecivile.puglia.it/).
For environmental surveillance, we considered the air temperature (maximum, minimum, average) and thermal excursion (difference be-tween maximum and minimum daily temperature) on the day of sam-pling. The association between Legionella load in water samples and air temperature was studied using only the water samples that were posi-tive for Legionella. In addition, a case-control study was carried out to verify any statistically significant differences between Legionella-posi-tive and -negaLegionella-posi-tive water samples.
In relation to clinical surveillance, to evaluate the influence of cli-matic parameters on LD cases spread, maximum, minimum and average temperatures, thermal excursion (difference between maximum and
Fig. 1. Integrated water supply and transport system for civil use in the Apulia region [Source: Apulian aqueduct S.p.A.].
minimum temperature), daily precipitation and relative humidity (RH) were investigated over the days corresponding to the incubation period of LD (2–10 days prior to the onset of symptom) and within the month that symptoms began (e.g., if a case occurred in April, we considered the climatic parameters from April 1st to April 30th).
All climatic data were recovered from meteorological stations within a maximum distance of 30 km from the sampling point (for environmental analysis) or from the facility designated as the probable source of infection (for clinical surveillance).
2.5. Geo-statistical analysis
All of the water sampling locations and touristic-recreational facil-ities were georeferenced using geographic coordinates provided by the regional authorities for “hot spot” analysis. Generally, this analysis is used to pinpoint locations of statistically significant high- and low-value clusters of a phenomenon, evaluating each feature (e.g., Legionella load in water samples) in relation to the features of its neighbour and against all features in the dataset (Getis and Ord, 1992). A feature with a high value may be a statistically significant hot spot if it is also surrounded by other features with high values, as opposed to simply being a data outlier. When the observed local mean differed from the global mean and this difference was too large to be the result of random chance, a statistically significant z-score is generated and a hot spot cluster is detected.
The Getis-Ord algorithm (Getis and Ord, 1992,1996;Ord and Getis, 1995) was used to identify a hot spot. This tool, also called the Gi* statistic, calculates spatial dependencies between an observed datum and its neighbours within a threshold distance that can be pre-defined or set by the user. The Gi* statistic indicates whether spatial entities with high (or very low) presence values tend to cluster within a certain distance in certain areas.
To determine spatial relationships in the hot spot analyses for punctual geometry, the most commonly method used in literature (Sánchez-Martín et al., 2019) is Fixed distance band where each feature is analysed within the context of neighbouring features. Neighbouring features within the specified critical distance (Distance Band or Threshold Distance) receive a weight of 1 and exert influence on computations for the target feature. Neighbouring features outside the critical distance receive a weight of zero and have no influence on a target feature's computations.
To calculate distances between neighbours, the Euclidean distance (which uses the straight-line distance between points A and B, i.e., the shortest possible distance) is the most commonly method used in lit-erature (Sánchez-Martín et al., 2019). Because there was no precedent for our analyses of Legionella and legionellosis, we applied Fixed dis-tance band with Euclidean disdis-tance, ensuring that each feature had at least one neighbour.
Maps of Legionella distribution were generated using an interpola-tion technique, known as inverse distance weighting (IDW), based on G* statistic scores from the hot spot analysis. The principle of the IDW method is to consign more weight to nearby points compared with distant points. IDW weights the contribution of each input point by a normalised inverse of the distance from the control point to the inter-polated point (Chang, 2010). The IDW interpolation method assumes that each input point has local influence that decreases with distance (Fisher et al., 1987). QGIS version 3.2 (Download QGIS version 3.2, https://qgis.org/it/site/forusers/download.html) was used for geor-eferencing of the points, using the Getis–Ord algorithm and to generate the maps through IDW.
2.6. Statistical analysis
R software version 3.5.1 was used for statistical analysis, with p < 0.05 considered statistically significant.
Fisher's exact test or a χ2test with Yates correction were used to
investigate the association between air temperature and Legionella load in water networks, and between climatic parameters (temperature, humidity, daily precipitation) and legionellosis cases.
The Shapiro–Wilk normality test (SWt), the Kolmogorov–Smirnov test (KSt) and a quantile-quantile (QQ) plot were used to evaluate normal or non-normal distributions of the Legionella load and climatic data. When SWt and KSt vales have a p-value p < 0.05, the distribution was assumed to be non-normal and non-parametric tests were used.
Kendall's Tau-b test was used to investigate the correlation between Legionella load and air temperature on the day of water sampling. In cases where the correlation coefficient was > 0 or < 0, a positive or negative correlation was assumed, respectively.
A regression study was carried out to explain the relationship be-tween the trend in Legionella load (dependent) and air temperature (independent) by estimation of the curve with respect to the main models (Linear, Logarithmic, Inverse, Quadratic, Cubic, Compound, Power, S).
The Wilcoxon rank sum test with continuity correction was used to verify statistically significant differences in the case-control study or to verify statistically significant differences among different areas of the study.
Kruskal-Wallis and Pairwise comparisons using a Wilcoxon rank sum test were used to compare climatic parameters of different areas within the Apulia region.
2.6.1. Multivariate analysis of risk factors for LD
A Poisson regression model was used to perform the multivariate analysis of climatic risk factors associated with LD. Climatic data were obtained from the main weather stations in the five homogeneous cli-matic areas of Apulia (Gargano, Tavoliere, Murgia, Salento and Arco Jonico) from 2001 to 2017, with all data stratified by month. These data were then correlated with cases (presented as no. of cases/10,000 tourist arrivals). The climatic characteristics for each month in which a clinical LD case was recorded were divided into two parts. In the first part the climatic data for the incubation period of the disease were entered and the number of cases that occurred per 10,000 tourist ar-rivals was estimated using the following formula:
[(No of arrivals in the month/No of days in the month) x No of days in the incubation period].
In the second part the climatic parameters for the month, excluding the days corresponding to the incubation period, along with the arrivals during the incubation period, were considered. In the case of months in which no cases occurred, the climatic parameters of the same month were considered.
The final model included only those variables with a p-value of < 0.05 in the preliminary model with all the variables. To quantify the effects of meteorological variables, we computed the influences (eβ−1), which virtually corresponded to the relative risks (Conza et al., 2013). R software version 3.5.1 was used for this analysis.
3. Results
3.1. Hot spot analysis of water samples and climatic parameters
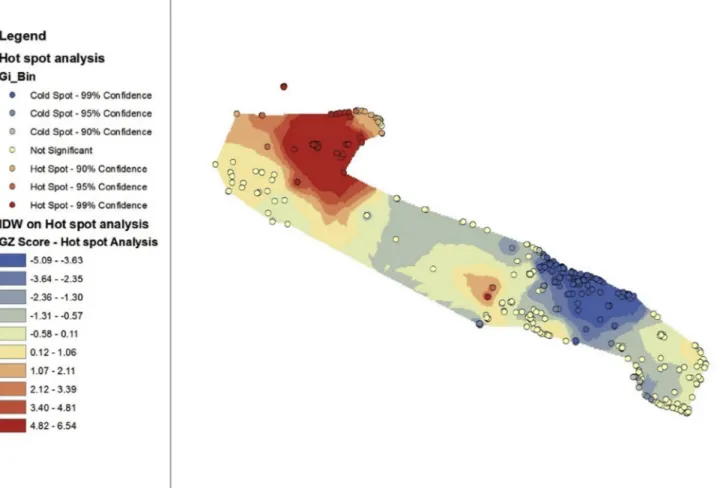
During the period 2001–2017, Legionella was detected at 339 (68.5%) of the tested facilities and in 2459 (37%) of the water samples. Legionella pneumophila sg 1 was the most frequently isolated species and sg (72%). Hot spot analysis of the Legionella load (cfu/L) is shown in Fig. 2. Hot spots with a 99% confidence interval (red point) were considered the most relevant. The area in red contained the greatest number of relevant hot spots based on Legionella load.
Among the Legionella-positive samples, the mean bacterial load was 10.8 × 10⁴cfu/L (SD, 37.6 × 10⁴cfu/L) with a median of 3.6 × 10³ (IQR, 10.1 × 10⁴cfu/L).Fig. 3shows the QQ plot of the Legionella load (cfu/L).
and D = 0.39, p < 0.0001, respectively, indicating that the distribu-tion was not normal.
Kendall's Tau-b (Tb) test showed that the correlation coefficients were very low, meaning that it was not possible to confirm a correlation between the Legionella load (cfu/L) and the following parameters:
•
maximum temperature (°C) (Tb: p = 0.018, correlation coeffi-cient = 0.035);•
minimum temperature (°C) (Tb: p = 0.008, correlation coeffi-cient = 0.039);•
average temperature (°C) (Tb: p = 0.012, correlation coeffi-cient = 0.037);•
daily thermal excursion (°C) (Tb: p = 0.045, correlation coeffi-cient = 0.030).Fig. 2. Hot spot analysis of the Legionella load in water samples from touristic-recreational facilities in the Apulia region (2001–2017).
Fig. 3. QQ plot of the Legionella load (cfu/L) from 2001 to 2017.
Fig. 4. QQ plot of the air temperature (°C) versus with all water sampling
points.
SWt and KSt analyses produced statistically significant (W sta-tistic = 0.98251, p < 0.0001 and D = 0.39, p < 0.0001, respectively) results for the association between air temperature data and all water sampling points, indicating that the distribution was not normal. The QQ plot for the temperature data is presented inFig. 4.
Table 1
Case control study between the temperature parameters and Legionella-positive and -negative water samples. Air temperature (°C) POSITIVE water samples (N = 2459)
(median ± IQR) NEGATIVE water samples (N = 4179)(median ± IQR) Wilcoxon rank sum test with continuitycorrection (W) p-value
Maximum 23.0 ± 9.7 22.1 ± 10.8 3,674,900 0.2533
Minimum 15.7 ± 9.3 16.2 ± 10.2 3,529,100 0.1662
Average 19.3 ± 9.9 19.1 ± 9.9 3,613,200 0.9423
Daily thermal excursion 6.8 ± 3.2 6.6 ± 3.4 3,881,600 0.0023
IQR = interquartile range.
Fig. 5. Hot spot analyses of LD cases in tourist recreational facilities in the Apulia region (2001–2017).
Table 2
Cases of LD linked to tourist recreational facilities and tourist turnout in the Apulia region by month (for years 2001–2017).
Month Cases of LD/tourist arrivals %
Jan 1/1,330,533 0.00008 Feb 3/1,537,958 0.00020 Mar 5/1,978,748 0.00025 Apr 19/3,377,922 0.00056 May 30/4,004,798 0.00075 Jun 43/6,054,586 0.00071 Jul 19/8,047,139 0.00024 Aug 25/10,075,702 0.00025 Sep 44/5,438,084 0.00081 Oct 30/3,145,781 0.00095 Nov 10/1,800,913 0.00056 Dec 1/1,788,470 0.00006 Total 230/48,580,636 0.00047 Table 3
Cases of LD linked to tourist recreational facilities and tourist turnout in the Apulia region by season (for years 2001–2017).
Season Cases of LD/tourist arrivals %
Autumn 84/10,384,778 0.00081
Winter 5/4,656,962 0.00011
Spring 54/9,361,468 0.00058
Summer 87/24,177,427 0.00036
Table 1shows the data from the case-control study between Legio-nella-positive and negative water samples versus air temperature.
In the case-control study, only the parameter “daily thermal ex-cursion” showed a statistically significant difference (W = 3,881,600, p = 0.002) between the samples, with the daily thermal excursion shown to be higher in Legionella-positive water samples compared with Legionella-negative samples.
Analysis of daily temperature excursion in both the hot spot area (n. ob servations: 830 for positive samples and 715 for negative samples; median value = 7.3 °C vs. 6.6 °C; W = 156,840, p < 0.0001) and the other areas (n. observations: 1629 for positive samples and 3464 for negative samples; median value = 6.7 °C vs. 6.6 °C; W = 2,193,500, p = 0.03142) revealed that the daily air temperature excursion on the days on which positive samples were collected was higher than that for the days on which negative samples were collected in the two area group. Moreover, a significant statistical difference was detected for the positive water samples in the two area groups (W = 463,240; p = 0.0005).
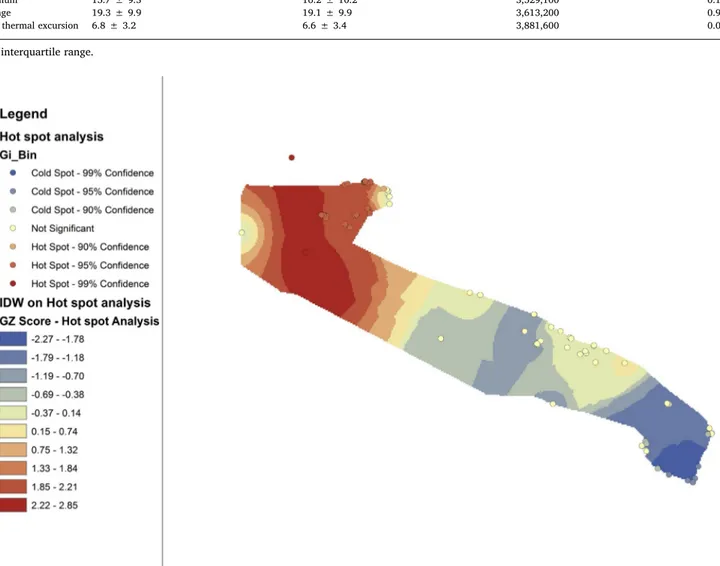
3.2. Hot spot analysis of legionellosis cases and climatic parameters During the period 2001–2017, 230 cases of LD were associated with
tourist recreational facilities in the Apulia region. Other clinical forms of legionellosis were not notified. Among these 230 cases (87.9% caused by Legionella pneumophila sg 1), the mean age was 64.5 years ± 11.1, with a higher percentage of males (67%) than females. Fig. 5shows the hot spots for LD cases. Hot spots with a 99% confidence interval (red points) were considered the most relevant. The area shown in red indicates the area in which the greatest number of relevant hot spots of LD cases were located.
Comparison of the data presented inFig. 2andFig. 5revealed that the areas with the highest concentration of Legionella in the water samples also had the highest number of cases of LD associated with staying in a tourist facility.
Analysis of the arrivals registered at the tourist recreational facilities versus the number of LD cases that occurred between 2001 and 2017 revealed an incidence of one LD case per 211,220 tourist arrivals.
Moreover, it was possible to associate the number of travel-asso-ciated LD cases with the number of tourist arrivals per month and season (Tables 2 and 3).
The number of LD cases/tourist arrivals was greater in autumn (1 case/123,628), than in summer (X2= 28.705, df = 1, p < 0.0001), or winter (Fisher's exact test, p < 0.0001). September and October were identified as having the greatest number of LD cases/tourist arrivals;
Fig. 6. QQ plot of the (A) temperature (°C), (B) daily precipitation (mm) and (C) daily relative humidity (%) versus LD cases.
however results of the two-to-two comparison between September/ October and the other months only showed statistically significant difference against:
•
January (Fisher's exact test: September, p = 0.005; October, p = 0.0005)•
March (Fisher's exact test: September, p = 0.01; October, p = 0.002)•
July (Pearson's X2test with Yates' continuity correction: September, X2= 24.985, df = 1, p = 0.0005; October, X2= 21.596, df = 1, p = 0.003)•
August (Pearson's X2 test with Yates' continuity correction: September, X2= 23.745, df = 1, p < 0.0001; October, X2= 27.015, df = 1, p = 0.0002)•
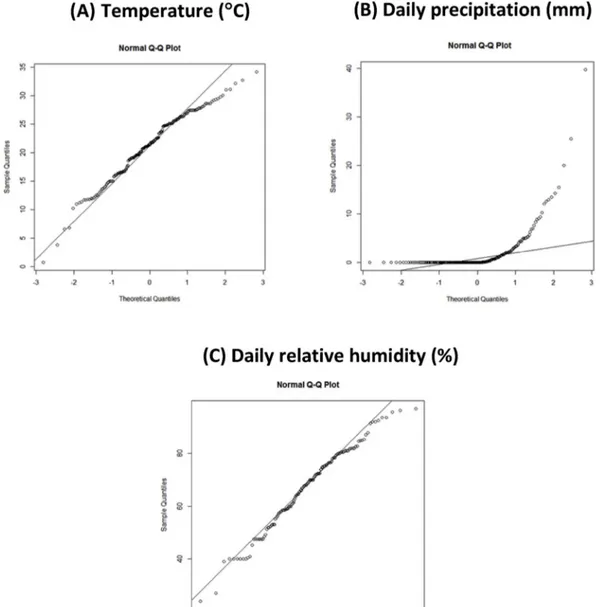
December (Fisher's exact test: September, p = 0.006; October, p = 0.019)The QQ plot is shown inFig. 6. Neither the temperature (Fig. 6A) (SWt-W statistic = 0.97756, p = 0.002; KSt-D statistic = 0.99512, p < 0.0001) nor the precipitation (Fig. 6 B) (SWt-W sta-tistic = 0.45785, p < 0.0001, KSt-D stasta-tistic = 0.5, p < 0.0001) showed a normal distribution. Analysis of the RH (Fig. 6C) produced conflicting results between the different tests (SWt-W sta-tistic = 0.98201, p = 0.05894, KSt-D stasta-tistic = 1, p < 0.0001).
A Poisson regression model was used to conduct multivariate ana-lysis of risk factors for LD in accordance to the model used byConza et al. (2013). The results of these analyses are reported inTable 4.
The results of multivariate analysis (Table 4) showed that daily precipitation (mm) and average temperature (°C) directly influenced the RR of LD (9.2% increase in the RR of LD for every mm of pre-cipitation and 56.8% increase for every 1 °C of temperature). Moreover, the results of multivariate analysis identified an inversely proportional relationship between minimum temperature (°C) and daily thermal excursion and the RR of LD (98.8% decrease in the RR of LD for every 1 °C of temperature and a 86.6% decrease for every 1 °C change in
thermal excursion).
In the multivariate study, the higher RR of LD is confirmed in the hot spot area (Gargano).
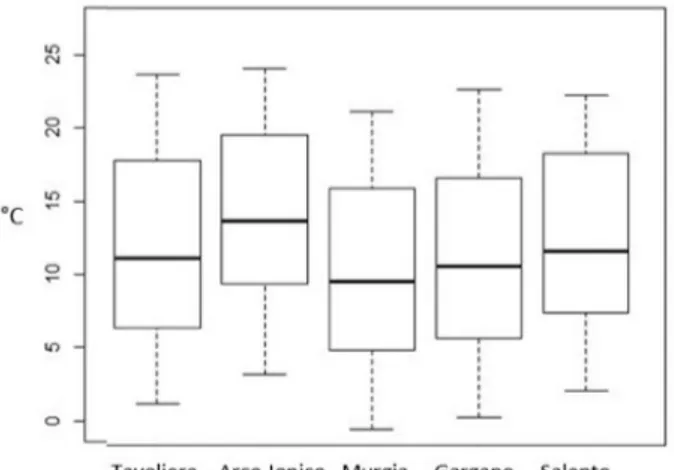
Analysis of the climatic parameters of different areas of Apulia (Portale della Protezione Civile Puglia, available at http://www. protezionecivile.puglia.it/) (Fig. 7A–D), showed that the hot spot area for LD (Gargano) had very low minimal temperatures and thermal ex-cursion, but had the highest daily precipitation (Table 5A-D).
Based on 2001–2017 Regional Civil Protection data on daily pre-cipitation, autumn was the wettest out of the four seasons (Kruskal-Wallis X2= 286.48, df = 11, p < 0.001; pairwise comparisons using a Wilcoxon rank sum test: p < 0.001 compared to with all the other seasons).
The median daily precipitation for autumn was 2.4 mm (IQR = 2.1) compared with 2 mm (IQR = 1.8) in winter, 1.7 mm in spring (IQR = 1.6) and 0.5 mm in summer (IQR = 1.2). Interestingly, the number of cases of LD relative to tourist arrival numbers was lower in the summer months of July and August compared with the number calculated for autumn months of September and October (Table 2). In autumn, there is a 6°C–7°C decrease in the median minimum tem-perature, with a simultaneous reduction of the daily thermal excursion of almost 3 °C. Most importantly though, this is coupled with an in-crease in median daily precipitation, from 0.2 mm in August to 2.1 mm in September, with similar levels maintained in October and November. Taking into account only the climatic parameters showing statisti-cally significant differences, we then examined areas with hot spots of LD cases (99 observations) versus other areas of the Apulia region (111 observations) over the days corresponding to the incubation period of LD. A statistically significant difference was identified among the cli-matic factors of the different areas (Table 6).
In the areas with LD cases hot spots, only the average temperature data was in contrast to the findings of the risk factor analysis shown in Table 4. However, given the percentage of RR shown inTable 4, the other climatic factors appeared to largely compensate for this dis-crepancy.
4. Discussion
Previous studies have investigated the impacts of climate change, including higher water temperature, drought, higher rainfall, rising sea levels and flooding, on the transmission of infectious disease (Hicks et al., 2007;Fisman et al., 2005;Karagianis et al., 2009;Ricketts et al., 2009;Walker, 2018). Recently investigations into the effects of climatic parameters on the notification rates of community-acquired LD in four European countries, including Italy (Beautè et al., 2016), confirmed that the growth of Legionella in natural environments is enhanced by warmer temperatures (De Giglio et al., 2019).
Our results showed that only temperature excursion affected the proliferation of Legionella.
In comparison, the role of temperature appears to be more complex because water flowing in artificial water networks is affected by the external temperature. An increase in seasonal temperatures can cause proliferation of Legionella in the cold water supply of a building and, consequently, a greater risk of disease. Therefore, designers and en-gineers must guarantee an artificial network system able to protect water from external thermal variations so as to avoid microbial growth in the built environment (Walker, 2018).
Conversely, our results also showed the highest risk LD was asso-ciated with decreases in minimum temperature. As reported previously (Beautè et al., 2016; Wullings and van der Kooij, 2006; Wadowsky et al., 1985; Carvalho et al., 2008), it may be that Legionella or its protozoan hosts have a lower optimum growth temperature and range in some regions or in certain climates.
The effects of the studied environmental factors on the protozoan hosts of Legionella may also play a role in the incidence of LD, which should be investigated further. In addition, Legionella is not only found
Table 4
Poisson regression model of meteorological factors associated with risk of LD (by month from 2001 to 2017 in the five principal climatologic areas of Apulia region).
β (eβ−1) = RR (%) p-value Preliminary model
Intercept 1,797,044 < 0.0001***
Tavoliere Area −0.9692 −62.10 < 0.0001***
Gargano Area (Hot spot Area) 0.6309 87.90 < 0.0001***
Murgia Area −0.8347 −56.60 < 0.0001***
Salento Area 0.1297 13.85 < 0.0001***
Arco Jonico Area −32.098 −95.50 < 0.0001***
Year −0.0918 −8.80 < 0.0001***
Month 0.3133 36.80 < 0.0001***
Maximum temperature (°C) 0.3042 35.60 0.80 Minimum temperature (°C) −47.390 −99.10 < 0.0001*** Average temperature (°C) 0.4484 56.60 < 0.0001*** Daily thermal excursion (°C) −23.096 −90.10 0.049* Daily precipitation (mm) 0.08901 9.30 < 0.0001***
RH 0.0253 2.56 0.65
Final model
Intercept 1,793,297 < 0.0001***
Tavoliere Area −0.9663 −62.00 < 0.0001***
Gargano Area (Hot spot Area) 0.6303 87.80 < 0.0001***
Murgia Area −0.8327 −56.50 < 0.0001***
Salento Area 0.1299 13.87 < 0.0001***
Arco Jonico Area −32.195 −96.00 < 0.0001***
Year −0.9916 −62.90 < 0.0001***
Month 0.3133 36.80 < 0.0001***
Minimum temperature (°C) −44.471 −98.80 < 0.0001*** Average temperature (°C) 0.4497 56.80 < 0.0001*** Daily thermal excursion (°C) −20.121 −86.60 < 0.0001*** Daily precipitation (mm) 0.0882 9.20 < 0.0001*** *, p < 0.05; **, p < 0.01; ***, p < 0.001.
in natural environments but are also present in manmade water systems where the temperature can be artificially modified (Beautè et al., 2016). Our data indicated that decreases in temperature excursion and increases in daily precipitation can affect the risk of LD. While the effect of thermal excursion has been poorly documented, many authors have reported that greater daily precipitation increases the number of cases
of LD (Simmering et al., 2017;Beautè et al., 2016;Halsby et al., 2014; Nai-TzuChen et al., 2014;Brandsema et al., 2014;Conza et al., 2013; Dunn et al., 2013;Garcia-Vidal et al., 2013;Karagiannis et al., 2009; Ricketts et al., 2009;Hicks et al., 2007).
Several studies (Brandsema et al., 2014) have reported that during milder climatic periods, the risk of LD increases as a result of increased
Fig. 7. Box plot of climatic parameters for five climatic areas of Apulia by month (2001–2017): (A) minimum and (B) average temperature, (C) daily thermal
excursion and (D) daily precipitation.
precipitation and, consequently, increased RH. In agreement with other reports (Beautè et al., 2016;Conza et al., 2014;Chen et al., 2014), our study did not show a significant correlation with RH. This may be be-cause to influence the survival of Legionella, the RH levels during the incubation period of the disease must reach at least 80% (Berendt, 1980) which would be uncommon in the Apulia region. Some authors (Hicks et al., 2007) hypothesised that heavy rain can favour the pro-liferation of other microorganisms or increase organic sediments in the water network which, in turn, aid the growth of Legionella. In fact, L. pneumophila has been found in rainwater on roads and in roof collection systems, as well as in floodwater (Brandsema et al., 2014;Sakamoto et al., 2009;Ahmed et al., 2014;Schets et al., 2010). Thus, it is likely that when the outside temperature exceeds 25 °C, the bacteria can be dispersed in the air from wet roads or from vehicles driving through puddles and generating contaminated aerosols. Similar to a study of travel-related LD in Glasgow, Scotland (Bhopal and Fallon, 1991), our data showed a greater number of cases in autumn (September, Oc-tober), when precipitation was increased compared with the rest of the year.
The geostatistical analysis conducted in the current study revealed that the area with the highest Legionella load in water systems coincided with the area presenting the highest number of LD cases associated with staying in touristic-recreational facilities.
Studies conducted to date have applied geostatistical methods to public health issues such as the presence of heavy metals, soil in-secticides, chemical contaminants, pollens, insects, plants and protozoa in different environments (Fortes Bde et al., 2004;Goovaerts, 2011;Li et al., 2006;Hou et al., 2017;Núñez-Alonso et al., 2019). OnlyLaganà et al. (2015)used geostatistical analysis to evaluate the distribution of Legionella in a healthcare facility. We applied this method throughout a geographical area, analysing tourist facilities and assessing the effects of climate on the incidence of LD.
The hot spot for LD cases in the Apulia region may be caused by the greater number of religious tourists (Castellana Pastoris et al., 2002) with known risk factors (such as older age, male sex, chronic lung disease and various conditions associated with immunodeficiency) to this area (Ginevra et al., 2009). Travelers are particularly at risk be-cause they may stay in accommodation contaminated with Legionella, and the response to infection may not be supported by appropriate and timely diagnostic tests and medical treatment (Mouchtouri and Rudge, 2015). Legionellosis is a significant public health problem, especially if we consider that the number of cases notified each year represents only a fraction of the real number of cases as a result of several limitations: i) surveillance systems are not always adequately applied in some coun-tries (Montagna et al., 2018), and ii) although Legionella is widely dis-tributed in the environment, growing it in a laboratory setting is
Fig. 7. (continued)
challenging because of its intracellular lifestyle and dependency on the host (Graells et al., 2018). For this reason, culture-independent methods are necessary to detect species other than Legionella pneumophila sg 1, which is still considered the primary causative agent of LD (Palmer et al., 2016; Kocazeybek et al., 2016; Relich et al., 2018). Cur-rently, > 90% of cases are diagnosed using a urinary antigen that mainly detects Legionella pneumophila sg 1 strains. In the last decade, several seroprevalence studies have shown a potential ongoing ex-posure to other serogroups and Legionella species (Lee et al., 2008; Rudbeck et al., 2008). Consequently, there has recently been a sub-stantial effort made to characterise the virulence determinants of Le-gionella pneumophila sg 1 strains, including secretory effectors or surface factors (Mercante and Winchell, 2015). Conflicting data has also been reported for the Apulia region. For example, a previous surveillance study of health and community facilities (Napoli et al., 2010) showed that clinical LD cases caused by Legionella pneumophila sg 1 strains did not coincide with its distribution in aquatic environments, which were often contaminated with other Legionella species or serogroups (De Giglio et al., 2019). In comparison, the current study, which concerns only the cases of LD associated with staying in tourist-recreational fa-cilities, showed that Legionella pneumophila sg 1 was the most frequent species and serogroup both in environmental samples and in clinical samples. This discrepancy confirms the need to improve laboratory diagnostics techniques to provide an epidemiological framework that is more responsive to changes in real-time.
5. Conclusion
Our study highlights the influences of climatic parameters on the increased risk of LD during periods of higher rainfall. Public health physicians should be aware of this phenomenon and consider more appropriate diagnostic and therapeutic protocols in cases of travel-as-sociated pneumonia. Furthermore, the innovative geo-statistical ap-proach used in this study should be further implemented to evaluate the distribution of Legionella and legionellosis cases in other areas, taking climatic influences into account. Such measures would more precisely define where and when it is necessary to intervene with preventative measures to protect the health of tourists.
Conflict of interest
The authors declare they have no actual or potential competing fi-nancial interests.
Funding
This research did not receive any specific grant from funding agencies in the public, commercial, or not-for-profit sectors.
Acknowledgement
We thank Kate Fox, DPhil, and Tamsin Sheen, Phd, from Edanz Group (www.edanzediting.com/ac) for editing a draft of this manu-script.
References
Ahmed, W., Brandes, H., Gyawali, P., Sidhu, J.P., Toze, S., 2014. Opportunistic pathogens in roof-captured rainwater samples, determined using quantitative PCR. Water Res. 53, 361–369.
Beautè, J., Sandini, S., Uldum, S.A., Rota, M.C., Brandsema, P., Giesecke, J., 2016. Short-term effects of atmospheric pressure, temperature, and rainfall on notification rate of community-acquired Legionnaires' disease in four European countries. Epidemiol. Infect. 144, 3483–3493.
Berendt, R.F., 1980. Survival of Legionella pneumophila in aerosols: effect of relative hu-midity. J. Infect. Dis. 141, 689.
Bhopal, R.S., Fallon, R.J., 1991. Seasonal variation of Legionnaires' disease in Scotland. J. Infect. 22, 153–160. Table 6 Climatic factors in areas with hot spots of LD cases versus other areas of the Apulia region (2001–2017 years). Climatic factor Area with hot spot of LD cases [median (A) ± IQR] Other areas of the Apulia region [median (B) ± IQR] Wilcoxon rank sum test with continuity correction (W) p-value RR (%) (from Table 4 ,final model) (C) Higher RR (%) in the area of Hot spot vs other area of Apulia Region a Minimum temperature (°C) 12.0 ± 6.4 16.8 ± 6.5 14,772 0.005 −98.80 +474.3 Average temperature (°C) 16.5 ± 8.0 22.5 ± 6.3 7256.5 < 0.0001 56.80 −340.8 Daily thermal excursion (°C) 10.4 ± 3.2 11.6 ± 5.5 6149.5 0.005 −86.60 +103.92 Daily precipitation (mm) 0.4 ± 3.6 0.0 ± 0.6 3883.5 0.003 9.20 +3.68 IQR = interquartile range. acalculated on the basis of the following formula: [A-B] x C.
Borella, P., Montagna, M.T., Stampi, S., Stancanelli, G., Romano-Spica, V., Triassi, M., Marchesi, I., Bargellini, A., Tatò, D., Napoli, C., Zanetti, F., Leoni, E., Moro, M., Scaltriti, S., Ribera Alcalà, G., Santarpia, R., Boccia, S., 2005. Legionella contamina-tion in hot water of Italian hotels. Appl. Environ. Microbiol. 71, 5805–5813. Brandsema, P.S., Euser, S.M., Karagiannis, I., Den Boer, J.W., Van Der Hoek, W., 2014.
Summer increase of Legionnaires' disease 2010 in The Netherlands associated with weather conditions and implications for source finding. Epidemiol. Infect. 142 (11), 2360–2371.
Carvalho, F.R.S., Nastasi, F.R., Gamba, R.C., Foronda, A.S., Pellizari, V.H., 2008. Occurrence and diversity of Legionellaceae in polar Lakes of the Antarctic Peninsula. Curr. Microbiol. 57, 294–300.
Castellani Pastoris, M., Ricci, M.L., Rota, M.C., 2002. A community cluster of legionnaires’ disease among pilgrims to San Giovanni Rotondo, Puglia, Italy. Weekly releases (1997–2007). 6 (27)..
Chang, K., 2010. Introduction to Geographic Information Systems, vol. 5. Thomas D. Timp, New York, pp. 327–340.
Chen, N.T., Chen, M.J., Guo, C.Y., Chen, K.T., Su, H.J., 2014. Precipitation increases the occurrence of sporadic legionnaires' disease in Taiwan. PLoS One 9 (12), e114337. Conza, L., Casati, S., Limoni, C., Gaia, V., 2013. Meteorological factors and risk of
com-munity-acquired Legionnaires' disease in Switzerland: an epidemiological study. BMJ Open 3 (3), e002428.
Conza, L., Casati Pagani, S., Gaia, V., 2014. Influence of climate and geography on the occurrence of Legionella and amoebae in composting facilities. BMC Res. Notes 7, 831. Costa, J., da Costa, M.S., Veríssimo, A., 2010. Colonization of a therapeutic spa with
Legionella spp: a public health issue. Res. Microbiol. 161 (1), 18–25.
De Giglio, O., Barbuti, G., Trerotoli, P., Brigida, S., Calabrese, A., Di Vittorio, G., Lovero, G., Caggiano, G., Uricchio, V.F., Montagna, M.T., 2016. Microbiological and hydro-geological assessment of groundwater in Southern Italy. Environ. Monit. Assess. 188, 638.
De Giglio, O., Napoli, C., Apollonio, F., Brigida, S., Marzella, A., Diella, G., Calia, C., Scrascia, M., Pacifico, C., Pazzani, C., Uricchio, V.F., Montagna, M.T., 2019. Occurrence of Legionella in groundwater used for sprinkler irrigation in Southern Italy. Environ. Res. 170, 215–221.
Download QGIS version 3.2 Available online:https://qgis.org/it/site/forusers/ download.html, Accessed date: 16 March 2019.
Dunn, C.E., Rowlingson, B., Bhopal, R.S., Diggle, P., 2013. Meteorological conditions and incidence of Legionnaires' disease in Glasgow, Scotland: application of statistical modelling. Epidemiol. Infect. 141 (4), 687–696.
European Centre for Disease Prevention and Control (ECDC), 2018. Legionnaires' Disease. ECDC. Annual Epidemiological Report for 2016. ECDC, Stockholm.
Euzéby, J.P., 2019. List of Prokaryotic Names with Standing in Nomenclature - Genus Legionella. http://www.bacterio.cict.fr/l/legionella.html, Accessed date: 16 March 2019.
Fields, B.S., 1996. The molecular ecology of legionellae. Trends Microbiol. 4, 286–290. Fisher, N.I., Lewis, T., Embleton, B.J.J., 1987. Statistical Analysis of Spherical Data.
Cambridge University Press, Cambridge.
Fisman, D.N., Lim, S., Wellenius, G.A., Johnson, C., Britz, P., Gaskins, M., Maher, J., Mittleman, M.A., Spain, C.V., Haas, C.N., Newbern, C., 2005. It's not the heat, it's the humidity: wet weather increases legionellosis risk in the greater Philadelphia me-tropolitan area. J. Infect. Dis. 192 (12), 2066–2073.
Fortes Bde, P., Ortiz Valencia, L.I., Ribeiro Sdo, V., Medronho Rde, A., 2004. Geostatistical modeling of Ascaris lumbricoides infection. Cad Saude Publica 20 (3), 727–734.
Garcia-Vidal, C., Labori, M., Viasus, D., Simonetti, A., Garcia-Somoza, D., Dorca, J., Gudiol, F., Carratala, J., 2013. Rainfall is a risk factor for sporadic cases of Legionella
pneumophila pneumonia. PLoS One 8 (4), e61036.https://doi.org/10.1371/journal.
pone.0061036.
Garrity, G.M., Bell, J.A., Tilburn, T., 2005. Order VI Legionellales family 1.
Legionellaceae. In: Brenner, D.J., Krieg, N.R., Staley, J.T. (Eds.), Bergey's Manual of Systematic Bacteriology, second ed. vol. 2. Part B. Springer-Verlag, New York, NY, pp. 210–237.
Getis, A., Ord, J.K., 1992. The analysis of spatial association by use of distance statistics. Geogr. Anal. 24, 189–206.
Getis, A., Ord, J.K., 1996. Local spatial statistics: an overview. In: Longley, P., Batty, M. (Eds.), Spatial Analysis: Modeling in a GIS Environment. Geo Information International, Cambridge, pp. 269–294.
Ginevra, C., Duclos, A., Vanhems, P., Campèse, C., Forey, F., Lina, G., Che, D., Etienne, J., Jarraud, S., 2009. Host-related risk factors and clinical features of community-ac-quired legionnaires disease due to the Paris and Lorraine endemic strains, 1998-2007, France. Clin. Infect. Dis. 49 (2), 184–191.
Goovaerts, P., 2011. A coherent geostatistical approach for combining choropleth map and field data in the spatial interpolation of soil properties. Eur. J. Soil Sci. 62 (3), 371–380.
Graells, T., Ishak, H., Larsson, M., Guy, L., 2018. The all-intracellular order Legionellales is unexpectedly diverse, globally distributed and lowly abundant. FEMS Microbiol. Ecol. 94 (12), fiy185.
Halsby, K.D., Joseph, C.A., Lee, J.V., Wilkinson, P., 2014. The relationship between meteorological variables and sporadic cases of Legionnaires' disease in residents of England and Wales. Epidemiol. Infect. 142 (11), 2352–2359.
Haupt, T.E., Heffernan, R.T., Kazmierczak, J.J., Nehls-Lowe, H., Rheineck, B., Powell, C., Leonhardt, K.K., Chitnis, A.S., Davis, J.P., 2012. An outbreak of Legionnaires disease associated with a decorative water wall fountain in a hospital Infect. Control. Hosp. Epidemiol. 33, 185–191.
Hicks, L.A., Rose Jr., C.E., Fields, B.S., Drees, M.L., Engel, J.P., Jenkins, P.R., Rouse, B.S., Blythe, D., Khalifah, A.P., Feikin, D.R., Whitney, C.G., 2007. Increased rainfall is associated with increased risk for legionellosis. Epidemiol. Infect. 135 (5), 811–817.
Hou, D., O'Connor, D., Nathanail, P., Tian, L., Ma, Y., 2017. Integrated GIS and multi-variate statistical analysis for regional scale assessment of heavy metal soil con-tamination: a critical review. Environ. Pollut. 231 (Pt 1), 1188–1200. Iatta, R., Cuna, T., De Giglio, O., Montagna, M.T., Napoli, C., 2013a. Sequence based
typing of Legionella pneumophila sg 1 isolated in nosocomial acquired infections in Apulia, Southern Italy. J. Prev. Med. Hyg. 54, 167–169.
Iatta, R., Cuna, T., Napoli, C., De Giglio, O., Montagna, M.T., 2013b. Environmental surveillance and molecular investigation of Legionella spp. in Apulia, in the years 2008-2011. Ann. Ig. 25, 435–441.
ISO 11731, 1998. Water Quality – Detection and Enumeration of Legionella. ISPRA, Regione Puglia, 2014. Ministero delle Infrastrutture e dei Trasporti. The
Groundwater and the Seawater Intrusion in Apulia: from Research to the Emergency in the Safeguard of the Water Resource, vol. 92.
ISPRA, 2014. Valori Climatici Normali di Temperatura e precipitazione in Italia, vol. 55 Available online: http://www.isprambiente.gov.it/files/pubblicazioni/
statoambiente/copy_of_SA_55_14_Valori_climatici_normali.pdf.
Istituto Superiore di Sanità (ISS), 2018. Rapporto Annuale Sulla Legionellosi in Italia Nel 2017., vol. 31. Notiziario ISS, Rome, Italy, pp. 7–12.
Karagiannis, I., Brandsema, P., van der Sande, M., 2009. Warm, wet weather associated with increased Legionnaires' disease incidence in The Netherlands. Epidemiol. Infect. 137, 181–187.
Kocazeybek, B.S., Yuksel, P., Keskin, D., Sheikh, S., Habip, Z., Yavuzer, S.S., Caliskan, R., Altun, Y.M., Kuskucu, M., Cengiz, M., Dinc, H.O., Karakullukcu, A., Ergin, S., Saribas, S., Yilmaz, N., Tokman, H.B., 2016. Travel-associated infections caused by unusual serogroups of Legionella pneumophila identified using Legionella BIOCHIP slides in Turkey and Iraq. Trav. Med. Infect. Dis. 14 (3), 248–254.
Laganà, P., Moscato, U., Poscia, A., La Milia, D.I., Boccia, S., Avventuroso, E., Delia, S., 2015. Geostatistics - a tool applied to the distribution of Legionella pneumophila in a hospital water system. Ann. Agric. Environ. Med. 22 (4), 655–660.
Lee, H.K., Woo, M.K., Ju, Y.I., Baek, S.J., Song, H.J., Choi, J.S., Kweon, S.S., Jeon, D.Y., Kang, Y.H., 2008. Prevalence of antibodies in response to Legionella species, analysis of a healthy population from Jeollanam-do Province, Korea. J. Microbiol. 46, 160–164.
Li, B.G., Cao, J., Liu, W.X., Shen, W.R., Wang, X.J., Tao, S., 2006. Geostatistical analysis and kriging of hexachlorocyclohexane residues in topsoil from Tianjin, China. Environ. Pollut. 142 (3), 567–575.
Linee, 2000. Linee Guida per la Prevenzione ed il Controllo della Legionellosi. Available online: http://www.salute.gov.it/imgs/C_17_normativa_1601_allegato.pdf, Accessed date: 16 March 2019.
Linee Guida per la Prevenzione ed il Controllo della Legionellosi. Available online: http://www.salute.gov.it/imgs/C_17_pubblicazioni_2362_allegato.pdf, Accessed date: 16 March 2019.
Mercante, J.W., Winchell, J.M., 2015. Current and emerging Legionella diagnostics for laboratory and outbreak investigations. Clin. Microbiol. Rev. 28 (1), 95–133. Montagna, M.T., Napoli, C., Tatò, D., Spilotros, G., Barbuti, G., Barbuti, S., 2006.
Clinical-environmental surveillance of legionellosis: an experience in Southern Italy. Eur. J. Epidemiol. 21, 325–331.
Montagna, M.T., Cuna, T., De Giglio, O., Bollino, A., Iatta, R., Napoli, C., 2012. Spa fa-cilities and legionellosis: legislative structure and state of the art in Apulia (Italy). Ig Sanita Pubbl 68 (5), 719–731.
Montagna, M.T., Cristina, M.L., De Giglio, O., Spagnolo, A.M., Napoli, C., Cannova, L., Deriu, M.G., Delia, S.A., Giuliano, A., Guida, M., Laganà, P., Liguori, G., Mura, I., Pennino, F., Rossini, A., Tardivo, S., Torre, I., Torregrossa, M.V., Villafrate, M.R., Albertini, R., Pasquarella, C., 2016. Serological and molecular identification of
Legionella isolated from water and surrounding air samples in Italian healthcare
fa-cilities. Environ. Res. 146, 47–50.
Montagna, M.T., De Giglio, O., Cristina, M.L., Albertini, R., Pasquarella, C., GISIO, AIA and SIMPIOS WorkingGroups, 2017. Legionella indoor air contamination in health care environments. In: In: Capolongo, S., Settimo, G., Gola, M. (Eds.), Politecnico di Milano, Milan, Italy. Indoor Air Quality in Healthcare Facilities, vol. 6 SpringerBriefs in Public Health.
Montagna, M.T., De Giglio, O., Cristina, M.L., Napoli, C., Pacifico, C., Agodi, A., Baldovin, T., Casini, B., Coniglio, M.A., D'Errico, M.M., Delia, S.A., Deriu, M.G., Guida, M., Laganà, P., Liguori, G., Moro, M., Mura, I., Pennino, F., Privitera, G., Romano Spica, V., Sembeni, S., Spagnolo, A.M., Tardivo, S., Torre, I., Valeriani, F., Albertini, R., Pasquarella, C., 2017b. Evaluation of Legionella air contamination in healthcare fa-cilities by different sampling methods: an Italian multicenter study. Int. J. Environ. Res. Public Health 14, 670.
Montagna, M.T., De Giglio, O., Napoli, C., Diella, G., Rutigliano, S., Agodi, A., Auxilia, F., Baldovin, T., Bisetto, F., Arnoldo, L., Brusaferro, S., Busetti, M., Calagreti, G., Casini, B., Cristina, M.L., Di Luzio, R., Fiorio, M., Formoso, M., Liguori, G., Martini, E., Molino, A., Mondello, P., Mura, I., Novati, R., Orsi, G.B., Patroni, A., Poli, A., Privitera, G., Ripabelli, G., Rocchetti, A., Rose, F., Sarti, M., Savini, S., Silvestri, A., Sodano, L., Spagnolo, A.M., Tardivo, S., Teti, V., Torregrossa, M.V., Torri, E., Veronesi, L., Zarrilli, R., Pacifico, C., Goglio, A., Moro, M., Pasquarella, C., 2018. Control and prevention measures for legionellosis in hospitals: a cross-sectional survey in Italy. Environ. Res. 166, 55–60.
Mouchtouri, V.A., Rudge, J.W., 2015. Legionnaires' disease in hotels and passenger ships: a systematic review of evidence, sources, and contributing factors. J. Travel Med. 22 (5), 325–337.
Napoli, C., Tato, D., Iatta, R., Montagna, M.T., 2007. [Assessment of occupational risk of
Legionella spp. infection among dental health-care personnel]. Ig. Sanita. Pubbl 63,
683–689 [Article in Italian].
Napoli, C., Iatta, R., Fasano, F., Marsico, T., Montagna, M.T., 2009a. Variable bacterial load of Legionella spp. in a hospital water system. Sci. Total Environ. 408, 242–244. Napoli, C., Iatta, R., Fasano, F., Marsico, T., Montagna, M.T., 2009b. [Legionella e
legionellosi in Puglia: sorveglianza negli anni 2000-2008]. Ann. Ig 21, 181–188 [Article in Italian].
Napoli, C., Fasano, F., Iatta, R., Barbuti, G., Cuna, T., Montagna, M.T., 2010. Legionella spp. and legionellosis in Southeastern Italy: disease epidemiology and environmental surveillance in community and health care facilities. BMC Public Health 10, 660. Núñez-Alonso, D., Pérez-Arribas, L.V., Manzoor, S., Cáceres, J.O., 2019. Statistical tools
for air pollution assessment: multivariate and spatial analysis studies in the Madrid region. J. Anal. Methods Chem. 2019, 9753927.
Ord, J.K., Getis, A., 1995. Local spatial autocorrelation statistics: distributional issues and an application. Geogr. Anal. 27, 286–306.
Palmer, A., Painter, J., Hassler, H., Richards, V.P., Bruce, T., Morrison, S., Brown, E., Kozak-Muiznieks, N.A., Lucas, C., McNealy, T.L., 2016. Legionella clemsonensis sp. nov.: a green fluorescing Legionella strain from a patient with pneumonia. Microbiol. Immunol. 60 (10), 694–701.
Phin, N., Parry-Ford, F., Harrison, T., Stagg, H.R., Zhang, N., Kumar, K., Lortholary, O., Zumla, A., Abubakar, I., 2014. Epidemiology and clinical management of Legionnaires' disease. Lancet Infect. Dis. 14 (10), 1011–1021.
Portale dell'Open Data Puglia Available online:http://www.dataset.puglia.it/, Accessed date: 16 March 2019.
Portale dell'Agenzia REgionale del Turismo PUGLIAPROMOZIONE. Report Data 2017, Available online:https://www.agenziapugliapromozione.it/portal/documents/ 10180/2920246/Dati%202017.
Portale della Protezione Civile Puglia. Available online:http://www.protezionecivile. puglia.it/. (Accessed 16 March 2019).
Portale dell'Osservatorio Epidemiologico regionale. Available online:https://www. sanita.puglia.it/osservatorio-epidemiologico-regionale. (Accessed 16 March 2019). Portale ufficiale del turismo della Regione Puglia. Available online:https://www.
viaggiareinpuglia.it/hp/it(Accessed 16 March 2019).
Regione Puglia, 2015. Indirizzi operativi per la prevenzione e il controllo della legio-nellosi nelle strutture turistico ricettive ed ad uso collettivo della Regione Puglia. Regione Puglia, 2018. Indirizzi operativi per la sorveglianza clinica e ambientale della
legionellosi nelle strutture sanitarie ed assistenziali della Regione Puglia. Relich, R.F., Schmitt, B.H., Raposo, H., Barker, L., Blosser, S.J., May, M., 2018. Legionella
indianapolisensis sp. nov., isolated from a patient with pulmonary abscess. Int. J. Infect. Dis. 69, 26–28.
Ricketts, K.D., Yadav, R., Rota, M.C., Joseph, C.A., European Working Group for Legionella Infections, 2010. Characteristics of reoffending accommodation sites in Europe with clusters of Legionnaires disease, 2003-2007. Euro Surveill. 15 (40), 19680.
Ricketts, K.D., Charlett, A., Gelb, D., Lane, C., Lee, J.V., Joseph, C.A., 2009. Weather patterns and Legionnaires' disease: a meteorological study. Epidemiol. Infect. 137 (7), 1003–1012 Erratum in: Epidemiol. Infect. 2011, 139(9), 1443.
Rudbeck, M., Molbak, K., Uldum, S., 2008. High prevalence of antibodies to Legionella spp. in Danish blood donors. A study in areas with high and average incidence of Legionnaires' disease. Epidemiol. Infect. 136 (2), 257–262.
Sakamoto, R., Ohno, A., Nakahara, T., Satomura, K., Iwanaga, S., Kouyama, Y., Kura, F., Noami, M., Kusaka, K., Funato, T., Takeda, M., Matsubayashi, K., Okumiya, K., Kato, N., Yamaguchi, K., 2009. Is driving a car a risk for Legionnaires' disease? Epidemiol. Infect. 137 (11), 1615–1622.
Sánchez-Martín, J.-M., Rengifo-Gallego, J.-I., Blas-Morato, R., 2019. Hot spot analysis versus cluster and outlier analysis: an enquiry into the grouping of Rural accom-modation in Extremadura (Spain). ISPRS Int. J. Geo-Inf. 8, 176 2019.
Schets, F.M., Italiaander, R., van den Berg, H.H., de Roda Husman, A.M., 2010. Rainwater harvesting: quality assessment and utilization in The Netherlands. J. Water Health 8, 224–235.
Simmering, J.E., Polgreen, L.A., Hornick, D.B., Sewell, D.K., Polgreen, P.M., 2017. Weather-dependent risk for Legionnaires' disease, United States. Emerg. Infect. Dis. 23 (11), 1843–1851.www.cdc.gov/eid.
Wadowsky, R.M., Wolford, R., McNamara, A.M., Yee, R.B., 1985. Effect of temperature, pH, and oxygen level on the multiplication of naturally occurring Legionella pneu-mophila in potable water. Appl. Environ. Microbiol. 49, 1197–1205.
Walker, J.T., 2018. The influence of climate change on waterborne disease and Legionella: a review. Perspect. Public Heal. 138 (5), 282–286.
Wullings, B.A., van der Kooij, D., 2006. Occurrence and genetic diversity of uncultured Legionella spp. in drinking water treated at temperatures below 15 degrees C. Appl. Environ. Microbiol. 72, 157–166.
![Fig. 1. Integrated water supply and transport system for civil use in the Apulia region [Source: Apulian aqueduct S.p.A.].](https://thumb-eu.123doks.com/thumbv2/123dokorg/5468394.61971/3.892.95.806.90.512/integrated-supply-transport-apulia-region-source-apulian-aqueduct.webp)