VOLUME LXXI – N. 3 LUGLIO-SETTEMBRE 2017
RIVISTA ITALIANA
DI ECONOMIA
DEMOGRAFIA
E STATISTICA
DIRETTORE CHIARA GIGLIARANO COMITATO SCIENTIFICOGIORGIO ALLEVA,GIAN CARLO BLANGIARDO,LUIGI DI COMITE, MAURO GALLEGATI,GIOVANNI MARIA GIORGI, ALBERTO QUADRIO CURZIO,CLAUDIO QUINTANO,SILVANA SCHIFINI D’ANDREA
COMITATO DI DIREZIONE
CHIARA GIGLIARANO,CLAUDIO CECCARELLI, PIERPAOLO D’URSO,SALVATORE STROZZA,ROBERTO ZELLI REDAZIONE
LIVIA CELARDO,MARIATERESA CIOMMI,ANDREA CUTILLO,GIUSEPPE GABRIELLI,ALESSIO GUANDALINI, SIMONA PACE,GIUSEPPE RICCIARDO LAMONICA,ANDREA SPIZZICHINO
Sede Legale: C/O Studio Associato Cadoni, Via Ravenna n.34 – 00161 ROMA. [email protected], [email protected]
SIEDS
SOCIETÀ ITALIANA
DI ECONOMIA DEMOGRAFIA E STATISTICA
CONSIGLIO DIRETTIVO
Presidenti Onorari: LUIGI DI COMITE,GIOVANNI MARIA GIORGI Presidente: FRANCESCO MARIA CHELLI
Vice Presidenti: CLAUDIO CECCARELLI,PIERPAOLO D’URSO, ROBERTO ZELLI
Segretario Generale: MATTEO MAZZIOTTA
Consiglieri:EMMA GALLI,CHIARA GIGLIARANO,STEFANIA GIRONE,LUCIANO NIEDDU, STEFANIA RIMOLDI,SILVANA MARIA ROBONE,SALVATORE STROZZA,CECILIA VITIELLO
Segretario Amministrativo: ALESSIO GUANDALINI
Revisori dei conti:FABIO FIORINI,SIMONE POLI,DOMENICO SUMMO
Revisori dei conti supplenti:MARGHERITA GEROLIMETTO,GIUSEPPE NOTARSTEFANO
SEDE LEGALE:
C/O Studio Associato Cadoni, Via Ravenna n.34 – 00161 ROMA
____________________________________________________________________________
INDICE
Claudio Ceccarelli, Silvia Montagna, Francesca Petrarca
Longitudinal analysis of Italian graduates employment paths through integration among different administrative sources ... 5
Fabiana Rocci, Silvia Pacini, Laura Serbassi, Marina Sorrentino, Maria Carla Congia
A new estimate of hours worked based on integration of survey and admin data ... 17
Claudio Ceccarelli, Francesca Ceccato, Silvia Pacini, Francesca Rossetti
Stima del costo del lavoro a livello individuale: un approccio da registro ... 29
Claudio Quintano, Antonella Rocca
Migration flows in the European labour markets ... 41
Massimiliano Bruno, Alessandro Polli
Impatti dell’automazione sul mercato del lavoro. prime stime per il caso italiano ... 53
Thaís García-Pereiro, Ivano Dileo
Gender differences in entrepreneurial activities in Italy... 65
Thaís García-Pereiro, Ivano Dileo
Tracking the factors that influence female employment: the Albanian case ... 77
Giovanna Di Castro, Valentina Ferri, Andrea Ricci
Vertical mismatch: stime ed evidenze empiriche ... 89
Francesco D. d’Ovidio, Pietro Iaquinta
Andrea Ciccarelli, Marco Di Domizio, Elena Fabrizi
Some remarks on the causal relationship between family backgrounds and NEET status ... 113
Mariateresa Ciommi, Gennaro Punzo, Gaetano Musella, Francesco Maria Chelli, Rosalia Castellano
Rivista Italiana di Economia Demografia e Statistica Volume LXXI n.3 Luglio-Settembre 2017
FEMALE EMPLOYMENT
AND REPRODUCTIVE BEHAVIOR IN ITALY
1Francesco D. d’Ovidio, Pietro Iaquinta
1. Introduction
In Europe, female employment performance is generally worse than male one, but in Italy this gap is much greater. Eurostat highlights that the total employment rate in 2011 was 64.2% (women: 58.2%) within the EU, while in Italy it was 57.2% (women: just 46.7%). According to ISTAT, a lack of support services for families (kindergartens, nursery schools, etc.) is a barrier imposed on access to the labour market for nearly 500,000 unemployed women. Indeed, in 2011 less than 1.4% of Italian GDP was allocated to households' contributions, services and tax deductions: far lower than 1.8% of the other OECD countries with low fertility2.
The evolution of fertility in Italy was characterized by significant structural changes, which led to the current situation. Assuming the aftermath of World War II as a baseline for modern fertility, it is easy to observe severely conflicting peri-ods of time, associated with many socio-economic changes.
Starting with the economic boom, a time characterized by a strong develop-ment, fertility gradually increased in our country until it reached a peak (the so-called baby-boom) in the mid-sixties, where economic and social factors led to a significant growth in terms of births and a drastic reduction of infant mortality, in-ducing the Total Fertility Rate to reach a value of 2,69 (1964).
This phase was followed by a long period of crisis, known as lowest-low fertili-ty, associated with both i) the stormy economic changes that led to the great oil cri-sis of the seventies and eighties, and ii) factors of social nature, including a new role for women in the labour market, a higher education level, and a radical change in lifestyle in the post-oil crisis society. These changes have prompted a strong de-lay in the entrance of women in their reproductive life, causing a collapse of the reproduction rate.
1
The Authors jointly designed and realized the work here described. However, P. Iaquinta wrote sec-tions 1, 3 and 4, while F. D. d’Ovidio wrote the section 2.
2
102 Volume LXXI n.3 Luglio-Settembre 2017
In this context, a very interesting question arises: is it realistically possible for women to reconcile their family expectations with their socio-economic reality?. Although cross-sectional analysis can provide a negative response, noting a sys-tematic reduction of the TFR with a level of 1.2 children per woman (1.18 in 1995), the longitudinal analysis shows that the collapse of the synthetic index of fertility is the result of the later entry into reproductive life of Italian women and not a real deterioration of their breeding perspective, as in other countries (see, by example, Sobotka 2004).
Indeed, by observing the specific fertility rates by age from 1952 to 2015 (ISTAT, referring to all orders, without discrimination on birth order), the figures clearly show how Italian women’s entry into the reproductive life has shifted for-ward, showing at the same time a recovery of fertility in adult age.
On the other hand, since the early 1980s in Italy Nora Federici, Carla Bielli and other scholars have worked on the Easterlin Theory (1968) on the reverse relation-ship between female work and fertility.
Is this relationship still working? And if it is, does it work in the same way for all ages? In this study, the most recent data (available by ISTAT data warehouse, May 2017) will be used in the attempt to answer these questions.
2. Relation between Occupation and Fertility
Depending on the data availability, the first analysis proposed in this paper ranges between the years 1975 to 2015. Figure 1 shows clearly that the Female Oc-cupation Rate (FOR) increases in quite constant way from 33% in 1975 to 48% in 2015, while the Total Fertility Rate quickly decreases from 2.18 in 1975 to its min-imum value (1.18) in 1995 (see the right scale in Figure 1); in the last two decades, TFR fluctuates slightly over this minimum, but no more than 1.46 (2010), and in 2015 it is worth approximatively 1.35. Therefore, apparently the Easterlin theory is still current… but the relationship shown may be spurious, depending by the dif-ferent kind of the underlying phenomena.
We must analyze data series after eliminating their trends. Excluding polynomi-al functions (that are the best, determining R2 indices around 97%, but may also eliminate the cyclic part of the time series), best interpolation functions are shown in the same Figure 1: the identified trends are given by a linear function in the case of FOR data and by a logarithmic transformation for TFR.
After the trends elimination (by simple difference), cyclic dynamics of the re-sidual series result very different each other (see Figure 2), and this seems to ex-clude any relationship, direct as well as inverse, between the series.
Rivista Italiana di Economia Demografia e Statistica 103
Figure 1 – TFR and FOR in Italy, 1975-2015, and their interpolating functions.
Source: Authors’ elaborations on Istat data
Figure 2 – Time series of FOR and TFR with no trends, Italy 1975-2015.
Source: Authors’ elaborations on Istat data
In order to explore the joint behavior of the cyclic time series, Pearson correla-tion coefficients between them were computed, lagging from 0 up to 9 years in two ways: first under the hypothesis that Female Occupation Rate at time t is
influenc-104 Volume LXXI n.3 Luglio-Settembre 2017
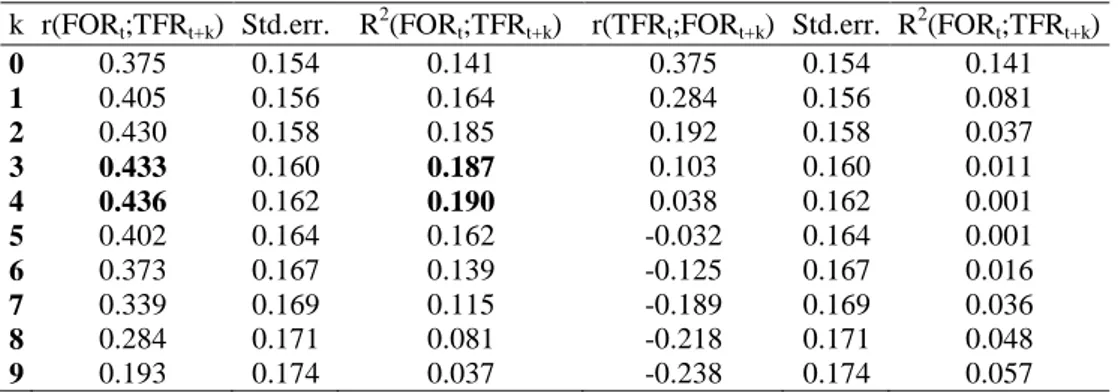
ing TFR at time t+k, then under the opposite – that is, TFR at time t influencing FOR at time t+k. Table 1 shows that the 1st relationship increases for time gaps up to 4 years, while the 2nd becomes irrelevant. Because data are not from samples, in-ference tests cannot be applied, but R2 (easy computable) highlights that at lag 0 just 14% of variability of one variable is explained by the other, while at lag 4 this percent becomes almost 20%.
Table 1 - Pearson cross-correlation coefficients between FOR and TFR, lagged from 0 to 9
years.
k r(FORt;TFRt+k) Std.err. R 2
(FORt;TFRt+k) r(TFRt;FORt+k) Std.err. R 2 (FORt;TFRt+k) 0 0.375 0.154 0.141 0.375 0.154 0.141 1 0.405 0.156 0.164 0.284 0.156 0.081 2 0.430 0.158 0.185 0.192 0.158 0.037 3 0.433 0.160 0.187 0.103 0.160 0.011 4 0.436 0.162 0.190 0.038 0.162 0.001 5 0.402 0.164 0.162 -0.032 0.164 0.001 6 0.373 0.167 0.139 -0.125 0.167 0.016 7 0.339 0.169 0.115 -0.189 0.169 0.036 8 0.284 0.171 0.081 -0.218 0.171 0.048 9 0.193 0.174 0.037 -0.238 0.174 0.057
Source: Authors’ elaborations
Figure 3 – Gain of FOR and TFR in Spectral Analysis, Italy 1975-2015.
The co-spectral analysis of the two series leads to similar conclusions (Figure 3). The gain of FOR from TFR is very close to zero in all periods, while the gain of TFR from FOR is high in almost every period. Unfortunately, results from spectral
Rivista Italiana di Economia Demografia e Statistica 105
and co-spectral analysis are much too long and complicated to be reported here, but they highlight that the higher phase peak is located at lag of 4 years between FOR and “subsequent” TFR variations, followed by harmonics at lag of 9 and 15 years3
.
3. Age specific analysis
Further step of this analysis is the study of the female occupation rate, specific by age group, as well as the age specific TFR. Indeed, labour market dynamics act in very different ways for young women than they do for mature ones, and this could have some reflect on specific fecundity.
The trend in female occupation at young ages is decreasing or stable between 1993 and 2016 (Figure 4.a), while occupation rates of older ages increase almost constantly until 2006 (Figure 4.b). The overall FOR increase that was shown in the previous section is therefore due ony to the older age dynamics.
The analysis by age group of fecundity dynamics (measured by the sum of age specific quotients of fecundity, divided by 100) leads to similar conclusions. Fe-cundity in young ages is stable or decreases between 1993 and 2015, but increases in the group aged 30-34 and still more in that aged 35-39 (as shown in Figure 5.a-5.b).
Additionally, the late fecundity rates increase by a small percentage fraction.
Figure 4.a – Female specific occupation rate for younger age groups, Italy, 1993-2016
Source: Authors’ elaborations on Istat data 3
Spectral analysis allows estimating the variance of one or more time series, explained by various cycles of different frequency, whose combination generates the series. It acts within the so-called "frequency domain", far different from the "temporal domain" in which data are defined. See, for ex-ample, Malinvaud, 1971; Vajani, 1980; Delvecchio. 1974.
106 Volume LXXI n.3 Luglio-Settembre 2017
Figure 4.b – Female specific occupation rate for older age groups, Italy, 1993-2016
Source: Authors’ elaborations on Istat data
Figure 5.a – Total fertility rate for younger age groups, Italy, 1993-2015
Source: Authors’ elaborations on Istat data
Figure 5.b – Total fertility rate for older age groups, Italy, 1993-2015
Rivista Italiana di Economia Demografia e Statistica 107
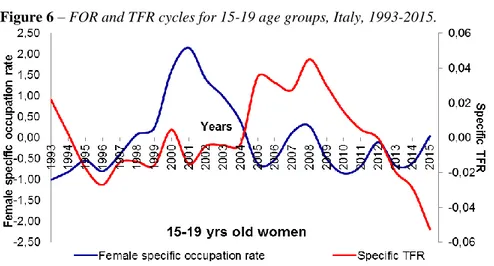
Figure 6 – FOR and TFR cycles for 15-19 age groups, Italy, 1993-2015.
Source: Authors’ elaborations on Istat data
Figure 7 – FOR and TFR cycles for 20-24 age groups, Italy, 1993-2015.
Source: Authors’ elaborations on Istat data
Removing trends by the data series, the residual series show various composi-tions and some similarity in the behaviour of cyclic elements: indeed, curves in groups of 15-19 yrs and 20-24 yrs follow paths somewhat similar, particularly in the positive cusps of occupation rate as well as those of TFR. These classes show minimum TFR when occupation rate is maximum, and vice-versa (Figures 6-7).
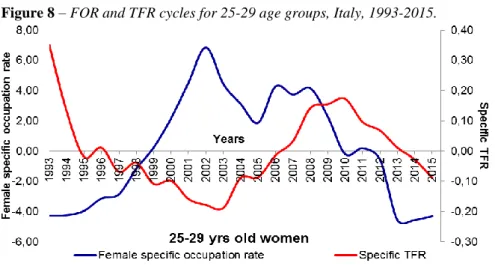
Cyclic dynamics of women in the 25-29 yrs group seem to be similar to those of the previous series, but with more relevant fluctuations (Figure 8). The previous observations suggest that, at younger ages, job tasks often exclude or reduce fecun-dity (as Easterlin hypotized). Moreover, this phenomenon is more evident in the
108 Volume LXXI n.3 Luglio-Settembre 2017
groups where both variables have a higher number of observations, while the lower number of cases in the group 15-19 yrs seems less reliable, since small absolute variations can imply an overestimate of the phenomenon itself.
Figure 8 – FOR and TFR cycles for 25-29 age groups, Italy, 1993-2015.
Source: Authors’ elaborations on Istat data
Instead, cyclic dynamics of occupation rate and TFR in groups of 30-34 yrs and 35-39 yrs seem to be similar each other: both show their minimum values in the first and in last years, and maximum values in their median section. Indeed, in this figure we can see that increase and decrease of TFR appear some year later than those of occupation rates (Figures 9-10).
Figure 9 – FOR and TFR cycles for 30-34 age groups, Italy, 1993-2015.
Rivista Italiana di Economia Demografia e Statistica 109
Figure 10 – FOR and TFR cycles for 35-39 age groups, Italy, 1993-2015.
Source: Authors’ elaborations on Istat data
Figure 11 – FOR and TFR cycles for 40-44 age groups, Italy, 1993-2015.
Source: Authors’ elaborations on Istat data
In the age group 40-44, cyclic dynamics of TFR and occupation rate approxi-mately replay those of one of younger groups: 20-24 years old (cf. Figure 11 and Figure 7).
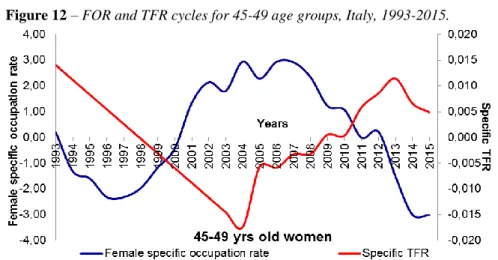
Additionally, the group of older women (45-49 yrs) seems to repeat the same dynamics, as shown in Figure 12. However, we must keep in mind that the specific TFR values are very low in this age group, and therefore the variations shown seem stronger than their real relevance, as well as in the 15-19 yrs age group.
110 Volume LXXI n.3 Luglio-Settembre 2017
Figure 12 – FOR and TFR cycles for 45-49 age groups, Italy, 1993-2015.
Source: Authors’ elaborations on Istat data
4. Conclusions and next steps
In this study a simple explorative analysis was performed, highlighting the dif-ferent behavior of women in difdif-ferent age groups facing problems related to keep-ing a job and havkeep-ing/raiskeep-ing children at the same time.
Obviously, for contemporaries this analysis could just be a proxy of the real be-havior of women, but the co-variation dynamics of feminine occupation rates and TFR (particularly by age) seem to be quite telling.
Further steps will require an analysis of the available data by transposing them from the time domain to the frequency domain by using spectral analysis (with Fourier transform).
References
CASELLI G., VALLIN J., WUNSCH G., 2001. Démographie. Analyse et
syn-thèse, vol. I. Ined, Paris.
BILLARI F.C. – DELLA ZUANNA G., 2008. La rivoluzione nella culla. Il declino
che non c’è, Università Bocconi Editore.
DELVECCHIO F., 1974. Modificazioni strutturali della curva dei matrimoni in Ita-lia, Giornale degli Economisti e Annali di Economia, Anno XXXVI (nuova se-rie), n. 3-4, pp. 258-263, 266-271
EASTERLIN R. A., 1968. Population Labor Force and Long Swings in Economic
Rivista Italiana di Economia Demografia e Statistica 111
FREJKA T., SARDON J.P., 2005. The direction of contemporary fertility trends in
the developed countries: Further decline, plateau or upswing? XXV IUSSP
In-ternational Conference, Tours, France, 18-23 juillet.
IAQUINTA P., 2003. Some consideration about fertility in Italy. Methodological Problems, International Area Review, Hankuk University of Foreign Studies, vol. 6, n.1, pp. 85-112.
ISTAT, 1997. La fecondità nelle regioni italiane. Analisi per coorti 1952-1993, Roma.
ISTAT, 2017. I.Stat datawarehouse, http://dati.istat.it.
KOHLER H.P., BILLARI F. C., ORTEGA J. A., 2002. The emergence of lowest-low fertility in Europe during the 1990s, Population and Development Review, 28.
LUTZ W. – SKIRBEKK V. – TESTA M.R., 2006. The Low-Fertility Trap Hy-pothesis: Forces that May Lead to Further Postponement and Fewer Births in Eu-rope, Vienna Yearbook of Population Research.
MALINVAUD E., 1971. Metodi statistici dell’econometria, UTET, Torino.
PICCOLO D., 1990. Introduzione all’analisi delle serie storiche, Nuova Italia Scientifica, Roma.
SENATO DELLA REPUBBLICA ITALIANA, 2014. Senato della
Repubblica-XVII Legislatura, Fascicolo Iter DDL S. 180. http://www.senato.it/leg/17/BGT/
Schede/FascicoloSchedeDDL/ebook/39478.pdf.
SOBOTKA T., 2004. Is lowest-low fertility in Europe explained by the postpone-ment of childbearing? Population and Developpostpone-ment Review, vol. 30, n. 2, pp. 195-220.
STUART J. S., 1961. Fourier Analysis, Methuen & Co, London.
112 Volume LXXI n.3 Luglio-Settembre 2017
SUMMARY
Female employment and reproductive behavior in Italy
In Italy in 2011, the employment rate for women between the ages of 25 and 54 was 64%, compared with an average of almost 76% in the EU-27. Furthermore, in the EU the total employment rate was 64.2%, with women at 58.2% - while in Italy the total employment rate was 57.2% and only 46.7% for women (Eurostat). Fe-male employment performance in Europe is worse than the Fe-male one, but data shows in Italy this gap is significantly larger.
According to ISTAT, the lack of family support services (kindergartens, nursery schools, etc.) is an obstacle to the entry into the labor market for nearly 500,000 unemployed women. In Italy, less than 1.4% of the GDP is allocated to households' contributions, services and tax deductions: far lower than 1.8% of the other low fertility countries in OECD. An additional potential obstacle comes from Nora Federici’s study (dated 1980s), which indicates that among the causes of the al-ready substantial reduction in fertility, the objective necessity for women to choose between work and family plays a large role. This study hypothesizes a reverse rela-tionship between feminine work and fertility, and this relarela-tionship has since found various experimental confirmations.
Is this relationship still working, in this new millennium undergoing heavy changes in the world of work? And if it is, does it work in the same way for all women? Some recent remarks suggest discordant behaviors: for example, a recent survey showed a greater employment of female graduates with children than those without children and women with lower or lower grades. This shows that the study of fertility, as well as of its determinants, must try to understand many different mechanisms. This essay (concerning the relationship between female occupation and fertility by age group) is a preliminary analysis to a much more complex and ambitious study, the completion of which will involve numerous analyzes of data from different sources - but already the results provide food for thought.
_________________________
Francesco D. D’OVIDIO, Università degli Studi di Bari Aldo Moro (IT), [email protected]