Research Article
Impact of Osmotic Distillation on the Sensory Properties and
Quality of Low Alcohol Beer
Liguori Loredana ,
1De Francesco Giovanni,
2Albanese Donatella ,
1Mincione Antonio,
3Perretti Giuseppe,
2Di Matteo Marisa,
1and Russo Paola
41Department of Industrial Engineering, University of Salerno, Via Giovanni Paolo II 132, 84084 Fisciano, Italy 2Department of Economic and Food Science, University of Perugia, Via San Costanzo, 06126 Perugia, Italy 3Department of Agriculture, Mediterranean University of Reggio Calabria, C.da Melissari, Reggio Calabria, Italy
4Department of Chemical Engineering Materials Environment, Sapienza University of Rome, Via Eudossiana 18, 00184 Roma, Italy Correspondence should be addressed to Liguori Loredana; [email protected]
Received 27 October 2017; Accepted 19 December 2017; Published 21 January 2018 Academic Editor: Jes´us Lozano
Copyright © 2018 Liguori Loredana et al. This is an open access article distributed under the Creative Commons Attribution License, which permits unrestricted use, distribution, and reproduction in any medium, provided the original work is properly cited.
The production of low alcohol beer (LAB) with a full and well-balanced flavour is still now a complex challenge because of the different flavour profile they have compared to regular beers. In this study, a brown ale beer was used to obtain a low alcohol beer by osmotic distillation in a small pilot plant. Beer-diluted carbonated solutions were used as strippers and were taken under flux of CO2in order to contrast loss of volatiles from beer during the process. A forced carbonation was applied on LAB to avoid the foam collapse. Furthermore, hop extract and pectin solution were added to LAB to improve the overall taste and body. Results highlighted an improvement into retention of volatiles probably due to the use of carbonated solutions such as strippers. The forced carbonation and the addition of pectins ensured both a higher concentration of dissolved CO2and a higher stability of foam in LAB. The antioxidant activity of beer remained unchanged. The sensory analysis highlighted differences among low alcohol beer and original one. The addition of hop extract and pectin solution to LAB better maintained hop and fruity-citrus notes during tasting, compared with the original beer.
1. Introduction
Beer is one of the most popular drinks and it is part of the daily diet or fun and celebration situations of millions of people.
In last years, specialty beers (i.e., low-calorie, low alco-hol (<1.2% vol), alcoalco-hol-free (<0.5% vol), gluten-free, and functional beers) have become increasingly appealing to consumers because of health reasons [1].
In particular, low alcohol (LAB) and alcohol-free beer can be a good alternative to standard soft drinks in situations when drinking alcoholic beverages is restricted for working, driving regulations, or for health (i.e., weight issues) and religious reasons.
From marketers’ perspective, LAB may also represent an opportunity to overcome the limitations set by local authorities regarding the sale of alcoholic beverages, as well as
the excise duty, and to expand the market towards countries where the sale of alcoholic beverages is restricted or forbidden for religious reasons [2].
From consumers’ point of view, LAB could be considered a potentially attractive rehydration drink for maintaining electrolyte homeostasis during exercise due to the consid-erable sodium content (80–100 mg/L), with higher prefer-ence among athletes and relatively reduced economic cost [3].
Nevertheless, the consumption of low alcohol beer sug-gests neutral and negative emotional responses. People tend to associate LAB as a substitute of regular beer, remaining disappointed in terms of taste, flavour and expectation, which are not comparable to the regular ones. On the other hand, LAB should be treated as a beverage in its own right, avoiding direct comparison with regular beer. Such awareness should be raised through proper advertising.
Volume 2018, Article ID 8780725, 11 pages https://doi.org/10.1155/2018/8780725
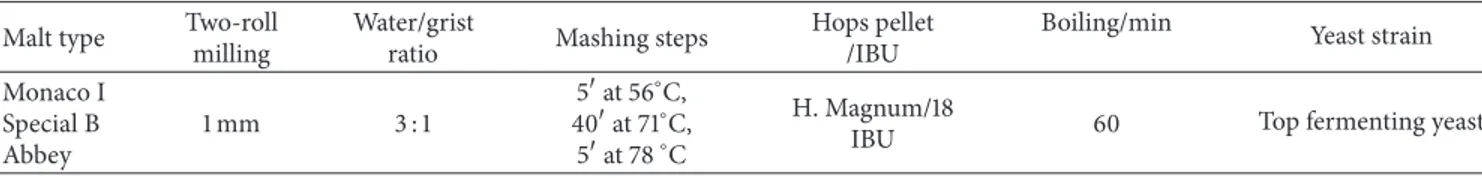
Table 1: Mashing schedule performed for wort process.
Malt type Two-roll
milling
Water/grist
ratio Mashing steps
Hops pellet /IBU
Boiling/min Yeast strain
Monaco I Special B Abbey 1 mm 3 : 1 5at 56∘C, 40at 71∘C, 5at 78∘C H. Magnum/18
IBU 60 Top fermenting yeast
LABs can be produced by different methods, which can be classified in two groups: restricted ethanol formation or ethanol removal methods [4]. In the former, the removal of yeasts, or the suppression of yeasts metabolism, allows to limit alcohol formation in the early stage of the brewing process. In the latter, post-fermentation methods consist of removing alcohol from regular beer through thermal or membrane process.
Quality characteristics of LAB depend on the selected method which may affect the beer quality. From one side, it is hardly feasible to achieve low alcohol levels with adequate conversion of wort to beer using biological methods, hence a worty flavour is predominant in LAB. On the other side, thermal degradation causes loss of volatiles and hence body,
aroma, and CO2content change. On the contrary, membrane
processes lead to LAB with fuller and better taste, even if losses of sensorial harmony and body were also registered [4]. Among membrane processes, the osmotic distillation is a gentle membrane technique for partial or total reduction of alcohol in beverages as reported in literature [5–10]. The transport of small molecules (ethanol) is allowed from the higher concentration side (beer) to the lower one (stripper). The optimization of process parameters is a priority in order to minimize volatile compounds reduction in beverages during the process.
Firstly, Varavuth et al. [11] reported that water is a more promising stripper of ethanol compared with glycerol and
CaCl2 for wine dealcoholization, because it provides higher
ethanol flux and lower countertransport of water due to the low water activity differences. Therefore, in prelimi-nary studies on beer dealcoholization [12–14], we used first water as stripper and then alcoholic solutions (permeates) obtained by previous dealcoholization process. This latter resulted as a valid alternative in order to reduce water consumption and minimize the environmental impact of the process, although a significant loss of volatile compounds was observed. In a further study we optimized the stripper solutions composition made by dilution of original beer with water and subsequent carbonation up to saturation at ambient temperature [5]. In fact, in these conditions, lower loss of volatile compounds was detected in low alcohol beer.
Hereinbefore, the production of LAB with a full and well-balanced flavour is still now a complex challenge. In this study, a brown ale beer was used to obtain a low alcohol beer. An ale beer was chosen because ale beers, fermented at high temperatures, are more fruity, sweeter, and of fuller body than lagers [15].
The ale LAB was produced through osmotic distillation in a small pilot plant, using beer-diluted sparkling solutions as
strippers keeping CO2in flux during all process and, applying
forced carbonation on the final product, in order to avoid the foam collapse usually associated with LABs, when these are obtained through physical methods.
The quality and sensory properties of the ale LAB were then investigated. Furthermore, the addition of raw material extracts (i.e., hop) and pectin solution to LAB was performed in order to improve the overall taste and body of the produced low alcohol beer.
2. Materials and Methods
2.1. Ale Beer Production. The wort used for the ale beer was
produced in 30 L in the pilot scale brewery at CERB (Perugia, Italy). The grains used were Munich I (70%) and Abbey (10%) from Weyermann (Bamberg, Germany) and Special B (20%) from Castle Malting (Beloeil, Belgium). Hallertau Saphir hop
(4.8%𝛼-acids) from Barth-Haas (Nuremberg, Germany) was
used to add bitterness. The wort was produced by a multiple-step infusion mashing (Table 1). 5 kg of malt was crushed and mixed with 15 L of heated water into the mash tun for the mashing process. 5 mL of lactic acid solution (80%) was used to regulate the pH of the mash to about 5.5. After mashing, the mash extract was drown off from lauter tun and, at the same time, additional 20 L of water with a pH 5.2 was sprinkled over for the sparging process. Boiling time was for 60 min, followed by a clarification into the whirlpool vessel. 25 L of hopped and clarified wort was started by adding 11.5 g of dry yeast Safale S-04 (Fermentis, Marcq en Baroeul Cedex,
France). The fermentation was carried out at∼22∘C for 7 days,
and then temperature was gradually lowered to 0–2∘C over
the following 4 days. After racking, the rough beer was stored
in a maturation vessel under a slight CO2 overpressure at
4.0 ± 0.5∘C for about 15 days and then bottled.
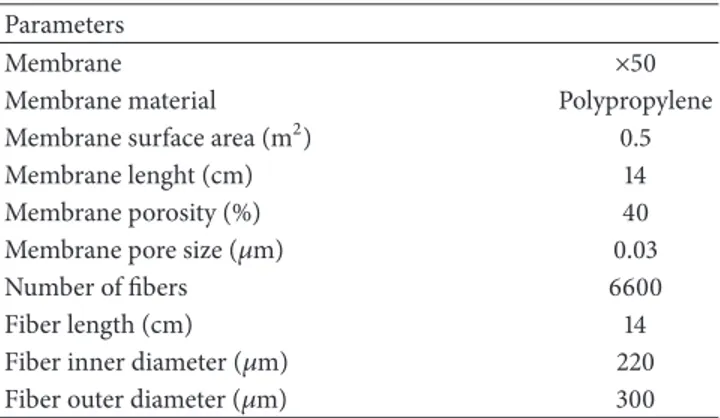
2.2. Small Pilot Plant for Dealcoholization. A membrane
module with hollow fibers (1.7× 5.5 MiniModule, Liqui-Cel,
Wuppertal, Germany) was used for beer dealcoholization. Its characteristics were reported in Table 2. The beer flowed in the membrane shell side, countercurrently to the stripper (i.e., carbonated beer-diluted solution) which circulated in the tube side.
The process temperature was set at 10∘C. Feed pressure
was measured by a manometer; the flow rates of beer (0.75 L) and of stripper (1.5 L) were 0.7 and 1.4 L/min, respectively. The scheme of the small pilot plant was previously reported [5].
The dealcoholization of the original beer (OB) was per-formed in 2 cycles, during which both streams were recircu-lated through the membrane. In particular, the strippers for the 1st and 2nd cycle were obtained by diluting the original beer up to 0.8 and 0.5% vol of alcohol, respectively [5]. Before
5 10 15 20 25 30 35 40 45 50 0 Time (min) 0 1 2 3 4 5 Alco ho l co ncen tra tio n (% v o l) Feed Stripper (a) Feed Stripper 0.0 0.5 1.0 1.5 2.0 2.5 Alco ho l co ncen tra tio n (% v o l) 5 10 15 20 25 30 35 0 Time (min) (b)
Figure 1: Dealcoholization kinetic of hydroalcoholic solutions: (a) feed and stripper at 3.8 and 0.8 % vol, respectively; (b) feed and stripper at 2 and 0.5 % vol, respectively.
Table 2: Membrane module (1.7 × 5.5 MiniModule, Liqui-Cel) specifications.
Parameters
Membrane ×50
Membrane material Polypropylene
Membrane surface area (m2) 0.5
Membrane lenght (cm) 14
Membrane porosity (%) 40
Membrane pore size (𝜇m) 0.03
Number of fibers 6600
Fiber length (cm) 14
Fiber inner diameter (𝜇m) 220
Fiber outer diameter (𝜇m) 300
each dealcoholization cycle, the strippers were carbonated up
to 2.2 g/L CO2, and during the cycles CO2 flow was set at
0.06 L/min in the stripper solution. The cycle time was equal to 40 and 30 min for 1st and 2nd cycles, respectively. The dealcoholization time was determined on the basis of kinetic results performed on model solutions (Figures 1(a)-1(b)).
A total number of 14 batches of the dealcoholized beer (1.1% vol) were produced and mixed (10 L). A batch (5 L) of dealcoholized beer was then carbonated at 2 bar (LAB). Hop
(Humulus lupulus, cascade variety, 6.8%𝛼-acids) extract and
pectins solutions at a concentration of 2 mL each in 100 mL were added to another batch (5 L) of dealcoholized beer and then carbonated at 2 bar (LAB+).
2.3. Chemical Analyses. The main quality attributes (original,
real, and apparent extracts; alcohol content, pH, colour,
turbidity, bitterness, total nitrogen, O2and CO2content and
foam stability) of original beer and low alcohol beers were
investigated. All the analyses were performed according to Analytica-EBC methods [16].
The total phenol content was determined with the Folin-Ciocalteu (FC) assay [17]. Gallic acid as reference compound was used for calibration curve and results were expressed as gallic acid equivalent (GAE) mg/L beer.
The antioxidant activity (AA) was evaluated by the DPPH scavenging method [18] using a spectrophotometer (Perkin Elmer, Lambda Bio 40). The percentage inhibition of remaining DPPH was calculated according to Liguori et al. [5]. A calibration curve of Trolox standard was used and
results were expressed as Trolox equivalent (TE)𝜇mol/L beer.
The volatile compounds concentration was determined by Gas Chromatograph (Agilent Technologies 6850) equipped with Mass Spectrometer (Agilent Technologies 5975C) and with a Maestro Autosampler Gerstel Multi-Pur-pose Sampler (SPME GC/MS). The method used was based on that developed by Vesely et al. [19] and subsequently slightly modified [10]. The analyses were carried out in duplicate.
2.4. Sensory Analysis. The sensory analysis was carried out
by a trained panel (composed by 12 judges aged between 25 and 45 years) through description analysis according to Analytica-EBC method 13.10 [16]. The panellists were asked to describe, in the three beers under evaluations, 14 flavour attributes for the taste (fruity/esters, alcoholic/solvent, fruity-citrus, cereal, malty, caramel, burnt, bitter, sweet, sour, astrin-gent, body, and linger) and 9 flavour attributes for the aroma (fruity/esters, alcoholic/solvent, fruity-citrus, cereal, malty, caramel, burnt, and sweet). For each attribute, a score was assigned ranging from 0 to 9. A score of 0 meant that the attribute was absent whereas a score of 9 indicated that the attribute was extremely strong. Both replicates of each beer were blind-tested and the mean of the results was reported in spider plots. Sensory descriptive data were also submitted to
Table 3: Quality parameters of original beer (OB), low alcohol beer (LAB), and low alcohol beer added with hop extract and pectin solution (LAB+).
Parameters OB LAB LAB+
Ethanol (% vol) 3.8 ± 0.1a 1.1 ± 0.1b 1.1 ± 0.1b Original extract (wt%) 12.2 ± 0.1a 8.2 ± 0.1b 7.9 ± 0.2c Apparent extract (wt%) 5.31 ± 0.0a 4.03 ± 0.0b 4.14 ± 0.0c Real extract (wt%) 6.49 ± 0.08a 4.72 ± 0.01b 4.75 ± 0.01b pH 4.33 ± 0.01a 4.19 ± 0.10a 4.18 ± 0.10a Colour (EBC) 94.7 ± 2.5a 84.0 ± 3.0b 83.4 ± 4.7b
Total phenols (mg GAE/L) 908.0 ± 100.2a 1015.4 ± 73.8a 1053.3 ± 81.3a
DPPH-Trolox equivalent antioxidant capacity (𝜇M/L ) 1321.8 ± 89.3a 1135.6 ± 378.5a 1264.3 ± 129.3a
Bitterness (BU) 20.0 ± 1.0a 21.0 ± 1.0a 23.0 ± 1.0b
Total Nitrogen (mg/L) 567.0 ± 27.0a 561.0 ± 30.0a 569.0 ± 23.0a
Foam stability Nibem 30 mm (s) 156.0 ± 5.0a 185.0 ± 4.0b 236.0 ± 1.0c
Turbidity (EBC) 7.0 ± 0.0a 3.2 ± 0.1b 2.5 ± 0.2c
O2(mg/L) 47.0 ± 5.0a 105.0 ± 25.0b 133.0 ± 28.0b
CO2(g/L) 6.0 ± 0.0a 4.8 ± 0.93b 4.5 ± 0.1b
Data represent the mean of 3 replicates± SD. Different letters correspond to statistically significant differences among original beer (OB) and low alcohol beer
(LAB) and low alcohol beer added with hop extract and pectin solution (LAB+) according to one-way ANOVA followed by Student’s𝑡-test (𝑃 < 0.05).
Principal Component Analysis (Unscrambler v10.4, CAMO Software, Norway).
2.5. Statistical Analysis. Brewing trials, dealcoholization
tests, and analytical measurements were carried out in triplicate and mean values and standard deviation values were subjected to monofactorial variance analysis (ANOVA). The significance of differences (𝑃 < 0.05) among samples
was determined by Student’s 𝑡-test. Statistical analysis was
performed using Analysis Lab software.
3. Results and Discussion
3.1. Dealcoholization of Beer. The target was the production
of beer with an alcohol content less than 1.2% vol. To achieve this, the required cycle numbers and their duration were evaluated by preliminary dealcoholization tests using a hydroalcoholic solution (about 3.8% vol) as feed to mimic the original ale beer). Figures 1(a) and 1(b) show the temporal profiles of alcohol concentration in feed and stripper. Based on these results, the dealcoholization process of the original beer is performed in two cycles using as stripper beer-diluted solutions at 0.8 and 0.5% vol and a duration of 40 and 30 min for the 1st and 2nd cycle, respectively.
Such process parameters have allowed reaching an alco-hol concentration of 1.1% vol, lower than the maximum level for LAB which is 1.2% vol in most of European countries (Table 3).
3.2. Quality Parameters of Original and Low Alcohol Beers.
The comparison of the main quality parameters measured in the three beer samples (OB, LAB, and LAB+) is reported in Table 3. A significant decrease (𝑃 < 0.05) in real, original, and apparent extract parameters is observed in low alcohol beers, according to previous studies [10, 20] in which craft beers produced by semi-industrial scale plant or commercially available were analysed, respectively.
The pH of beer is an important parameter for shelf life and resistance to microbial contaminations [21]. The pH value of all samples is very similar (Table 3) and in the range of 4.13–4.97 as reported in literature [4, 22].
Colour is one of the main physical properties assessed by a beer drinker beside clarity, viscosity, and foam. Obviously, the colour depends on the process parameters used for the roasting of the barley, which induces Maillard browning reactions and in some cases caramelization and pyrolysis reactions [23]. OB samples show a colour of 94.7 EBC, according to the range of dark beer (45–95 EBC units) that significantly decreases (𝑃 < 0.05) in LAB and LAB+ beers. No differences in colour have been observed between the two LAB samples prior and after the addition of hop extract and pectins (Table 3). Similar findings were reported for alcohol-free beers obtained by physical methods [4].
Polyphenols are the most important compounds among the antioxidant components of the beer [24]. Endogenous phenolic compounds, especially flavonoids and hydroxycin-namic acids, which are present in barley, naturally inhibit oxidative deterioration, improve flavour stability of beer, and could be protected and promoted by the malting process [25]. Phenolic compounds have several functional properties in the beer: they influence its colloidal stability interacting with binding sites of haze-active proteins and moderate sensory astringency and influence aging and colour [26].
The amount of total phenols in beer varies significantly depending on raw materials and beer style. The ale beer used in this study is richer in phenol compounds (about 900 mg GAE/L) than the ale beers (about 563–875 mg GAE/L) studied by Piazzon et al. [27], because of the different types of malts and their amount. According to our previous study [5], no significant difference (𝑃 < 0.05) in phenol content is found before and after dealcoholization process. Both low alcohol beers show a content of phenols higher than the dealcoholized beers on the market (366 mg GAE/L) [27].
The original beer shows high value of antioxidant activity (ΑΑ), confirming the superior antioxidant capacity of ale beer with respect to other styles [28]. No significant (𝑃 < 0.05) differences in AA are detected among the beer samples confirming that the process has not negatively influenced the healthy properties of this type of beverage.
Turbidity gives a first visual impression of the quality of the beer to the consumer and, from the analytical mea-surements (Table 3), original beer appears hazy. The values of turbidity significantly decrease (𝑃 < 0.05) after the dealcoholization process because of the filtering effect of the membrane. Similar results were found in previous studies about low alcohol and light beers where a reduced tendency to form cold and permanent haze was found [10, 20].
The dealcoholization process causes also CO2 losses,
which influence the foam formation. In a previous study
[5], we highlighted a huge reduction of dissolved CO2 and
foam production. For this reason, in this study, a forced carbonation was performed for both LAB and LAB+ samples. The results (Table 3) show for both LAB and LAB+ a higher stability of foam head than for the OB sample. The higher value of foam stability detected in LAB+ samples is probably due to the addition of pectins which add palate-fullness and a higher foam stability to the beer [29].
Finally, O2content is increased in LAB samples probably
due to oxygenation during the dealcoholization process.
3.3. Volatiles Composition and Sensory Analysis. Many
chem-ical compounds play a key role in the development of the sensory profile of beer. Among them volatile compounds, coming from raw materials or produced during brewing, contribute greatly to the flavour or are important merely in building up the background flavour of the beer [30].
The volatile composition of OB, LAB, and LAB+ is shown in Table 4. Four classes of compounds are identified: higher alcohols, esters, aldehydes, and ketones.
Higher alcohols are formed during yeast metabolism, as byproducts of amino acid synthesis from pyruvate through the anabolic pathway or they could be produced through amino acid catabolism. These compounds may positively contribute to the flavour of the beer if their amount is lower than 300 mg/L (118.82 mg/L for OB beer). The higher alcohols identified in beer samples are as follows: amyl alcohols, isobutanol, propanol, 2-phenylethanol, and furfuryl alcohol. Isoamyl alcohol is the most abundant among the aliphatic alcohols and cause “fruity” notes. It influences beer drink-ability: increased concentrations of isoamyl alcohol cause the beer to become heavier. The other aliphatic alcohols are responsible for “solvent” aroma of beer and produce a warm mouthfeel.
Esters give a pleasant, full-bodied character to beer aroma, but in high concentration they give an overly fruity quality, which is considered undesirable by most consumers [31].
A total of five ester compounds is identified in original beer, all typical for the beer volatile fraction. These com-pounds are found in an amount lower than their thresh-old concentration (Table 4). This condition represents a positive aspect for the beer drinkability because when the
concentration of these esters exceeds their threshold, it causes an undesirable flavour to the beer. It is noteworthy that the presence of different esters can have a synergistic effect, and thus they can also affect beer flavour even if they are present in concentrations well below their flavour threshold.
The other classes of compounds identified in the volatile fraction are aldehydes and ketones.
Fresh beer generally contains rather low concentrations of these aldehydes, below their respective flavour thresholds [32]. Acetaldehyde is the most abundant in all beer samples (Table 4), as reported elsewhere [5, 10, 33]. This aldehyde is difficult to categorize under just one specific formation mechanism: acetaldehyde can be produced as a byproduct of glycolysis during fermentation or can be formed by Strecker degradation of alanine [32].
The other aldehydes detected in beer come from aging process. In particular, 2-methylbutanal, 3-methylbutanal, methional, and phenylacetaldehyde arise from Strecker degradation products which occur by a transamination
between𝛼-dicarbonyl products and amino acids. They might
play a central role in flavour modification during beer aging. Hexanal is related to the autoxidation of linoleic acid while furfuraldehyde is the most important product of the Maillard reaction in beer.
According to several authors, furfuraldehyde does not exceed its flavour threshold value, and it is therefore said that it does not significantly affect beer flavour. This is contradicted by De Clippeleer et al. [34], who reported that the addition of furfuraldehyde to fresh pale lager beer resulted in a sharper, harsher, more linger, bitter and astringent beer.
The other compounds detected in beer are vicinal dike-tones, also produced as byproducts of the synthesis pathway of some amino acids during fermentation and diacetyl, that is, more flavour-active than the other, mainly responsible for the buttery flavour in beer [33].
The dealcoholization process causes losses of all volatile compounds that are reduced of about 55% respect to the original beer. The highest decrease is observed for esters fol-lowed by higher alcohols and aldehydes compounds. About ketones, an increase is detected in both dealcoholized beers probably due to oxygenation phenomenon occurring prior to carbonation step.
A higher retention of volatiles is obtained in this study with respect to our previous ones [13, 14]. This improvement is probably due to the use of carbonated solutions as strippers which obstacle the mass transfer of volatiles through the membrane.
As regards the low alcohol beer modified with hop and pectins, no differences are found with respect to LAB (the low alcohol beer without supplements) except for the increase in all detected aldehydes. Our results may be probably due to the use of a long-standing hop, which has released aldehydes in beer samples as oxidation byproducts.
Previous studies, in fact, highlighted the formation of staling aldehydes in aged hop due to oxidative degradation of lipid and iso-𝛼-acids’ alkanoyls [35, 36].
The physical and chemical properties of the main volatiles detected in the OB are also reported in Table 4. Among them, the flavour threshold may provide information on the
T a ble 4: V o la ti le co m p o unds co ncen tr at io n, loss p er cen ta ge ,p h ysica la nd ch emica lp ro p er ties, fl av o ur uni t (FU) in o rig inal (O B ), an d lo w alco ho lb ee r sa m p le s (LA B ,LA B + ). C o m p o u nds O B L AB L o ss (%) L AB+ Lo ss (%) MW (g/mo l) Bp ∘ (C) Vp (hPa) F t (m g/L) Fb FU O B FU LAB FU L A B+ n-P ro p an o l 14.87 ± 1.10 a 3.07 ± 0.24 b 79 3.34 ± 0.30 b 78 6 0.1 97 19 .3 80 0 A lco h o l 0.0 2 0 .0 0 0.0 0 Is o b u ta n o l 19.80 ± 1.51 a 5.89 ± 0.18 b 70 6.00 ± 0.03 b 70 74.12 108 8.0 20 0 A lco h o l 0.10 0.0 3 0.0 3 Am yl al cohols 54.22 ± 0.74 a 18.27 ± 0.41 b 66 18.32 ± 0.33 b 6 6 88.15 10 2 3.0 70 Alco h o l, b ana na, sw eetish, arom at ic 0.7 7 0.26 0.26 F ur fur yl alco ho l 4.91 ± 0.02 a 3.25 ± 0.11 b 34 3.19 ± 0.02 b 35 98.1 17 0 0.7 30 0 0 Su ga r C an e, W ood 0.0 0 0.0 0 0.0 0 2-Phen yl et ha no l 25.02 ± 0.34 a 15.32 ± 0.49 b 39 14.86 ± 0.14 b 41 122.16 21 9 0.11 12 5 Ros es, sw eetish, arom at ic 0.20 0 .12 0.12 Sum of al cohol s (mg /L ) 11 8. 82 ± 3.7 1 a 45.79 ± 1.42 b 61 45.7 1± 0.8 3 b 62 E th yl acet at e 4.30 ± 0.18 a 0.92 ± 0.07 b 79 0.94 ± 0.05 b 78 88.11 76 97 .3 33 Solve n t, fr ui ty , sw eetish 0.13 0.0 3 0.0 3 Et hy lb u ta n o at e 0.03 ± 0.00 a 0.01 ± 0.00 b 85 0.01 ± 0.00 c 85 116.16 120 17 .0 0.4 Pap ay a, butt er ,a ppl e 0.08 0.01 0.01 Is o am yl acet at e 0.13 ± 0.01 a 0.02 ± 0.00 b 86 0.02 ± 0.00 b 86 13 0.18 14 2 7. 5 1.6 B ana na, ap pl e, solve n t 0.08 0.01 0.01 Et hy lh ex an o at e 0.08 ± 0.01 a 0.02 ± 0.00 b 73 0.02 ± 0.00 b 70 14 4.21 16 8 1.4 4 0.2 3 A p p le ,f rui ty , an is eed 0.3 3 0.0 9 0.10
Ta b le 4 :C o n ti n u ed . C o m p o u nds O B L AB L o ss (%) L AB+ Lo ss (%) MW (g/mo l) Bp ∘ (C) Vp (hPa) F t (m g/L) Fb FU O B FU LAB FU L A B+ Et hy lo ct an o at e 0.08 ± 0.00 a 0.04 ± 0.00 b 56 0.04 ± 0.00 c 53 17 2.26 20 6 0.15 0.9 Ap p le , sw eetish, fruit y 0.0 9 0.0 4 0.0 4 Sum of este rs (mg /L ) 4. 61 ± 0.20 a 1.0 0 ± 0.08 b 78 1.0 3 ± 0.05 b 78 A cet aldeh yde 7139.70 ± 591.86 a 4164.31 ± 154.65 b 42 6501.56 ± 124.59 a 9 4 4.05 21 10 0 9 25 Gre en appl e, fru it y 0.29 0.1 7 0.26 2-M eth yl b u ta n al 22.75 ± 3.32 a 10.71 ± 1.12 b 53 24.52 ± 1.31 a − 8 86.13 9 0 4 8 1.2 5 Gre en gr ass , fru it y, so u r, medicinal 0.0 2 0.01 0.0 2 3-M eth yl b u ta n al 85.39 ± 8.37 a 39.55 ± 1.09 b 54 78.43 ± 3.72 a 8 88.15 13 0 4 0 0.6 Un ri p e b ana na, ap pl e, che rr y, che es e 0.1 4 0.07 0.13 He xa n al 0.96 ± 0.09 a 1.49 ± 0.11 a − 56 5.38 ± 0.44 b − 4 63 10 0.16 13 0 13 0.3 5 Bitte r, ast rin ge n t, gr ee n lea ve s 0.0 0 0.0 0 0.0 2 F ur furaldeh yde 8.31 ± 0.33 a 9.08 ± 0.20 b − 9 16.24 ± 0.45 c − 95 9 6.08 16 2 2.3 15 0 P ap er ,h u sk 0.0 0 0.0 0 0.0 0 3- Met h ylpropi o n al d eh yd e 31.14 ± 0.59 a 31.43 ± 2.62 a − 1 47.86 ± 5.69 b − 54 58.08 4 6 0.5 3 0.2 5 Ma sh ed po ta to ,w ar m , so u p -l ik e 0.12 0.13 0.1 9 2-Phen yl acet al deh yde 30.40 ± 0.91 a 36.22 ± 0.35 b − 19 51.88 ± 2.79 c − 71 120.15 195 0.5 2 1.6 H yacin th, li lac, aldeh yde 0.0 2 0.0 2 0.0 3 Su m of alde hydes (𝜇 g/L) 731 8. 63± 60 5. 47 a 42 92 .7 8 ± 16 0.15 b 41 67 25.8 5± 13 8.9 7 a 8 Diacety l 3.80 ± 0.29 a 8.75 ± 0.52 b − 13 1 21.04 ± 0.83 c − 45 4 86.1 88 69 .5 9 0.15 B u tt er ,s co tc h 0.0 3 0.0 6 0.1 4 2,3-P en ta n edio ne 0±0 a 0±0 a 3.95 ± 0.49 b 10 0.12 110 28.5 3 0.9 Diacety l, fru it y 0.0 0 0.0 0 0.0 0 Sum of ke ton es (𝜇 g/L) 3.80 ± 0.0 0 a 8.7 5 ± 0.5 2 b − 13 1 24.99 ± 1.3 3 c − 55 8 MW ,m o lec ula r w eig h t; B p ,b o ilin g p o in t; V p ,va p o ur p ressur e; F t, fla vo ur thr esho ld; FB ,fl av o ur in b eer ,FU ,fl av o ur uni t; da ta rep res en t the me an o f 2 re p lica tes ± SD .D iff er en t let ters co rr esp o nd to st at istica ll y significa n t diff er ences am o n g o rigina lb eer (O B) and lo w alco h o lb eer (L AB) and lo w alco h o lb eer added w it h h o p extrac t and p ec tin so lu tio n (L AB+) acco rdin g to o n e-wa y A N O V A fo llo w ed by 𝑡-t est (𝑃 < 0.05 ).
(0) (1) (2) (3) (4) (5) (6) (7) Fruity/esters (a-b-b) Alcoholic/solvent (a-b-b) Fruity/citrus (a-a-a) Hop (a-b-a) Cereal (a-b-c) Malty (a-b-b) Caramel (a-a-b) Burnt (a-b-a) Sweet (a-a-b) Bitter (a-a-b) Sour (a-b-b) Astringent (a-a-a) Body (a-b-c) Linger (a-a-b) OB LAB LAB+ (a) (0) (1) (2) (3) (4) (5) (6) (7) OB LAB LAB+ Fruity/esters (a-a-b) Alcoholic/solvent (a-a-a) Fruity/citrus (a-b-a) Hop (a-b-a) Cereal (a-a-b) Malty (a-a-b) Caramel (a-a-b) Burnt (a-a-b) Sweet (a-a-a) (b)
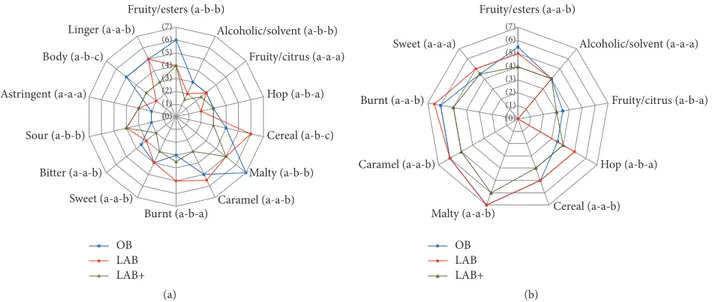
Figure 2: Sensory profile of OB (original beer), LAB (low alcohol beer), and LAB+ (low alcohol beer with supplements): (a) taste and (b) aroma. The letters near the descriptors indicate a statistically significant difference(𝑃 < 0.05), in the order OB-LAB-LAB+.
impact of a given compound on taste, aroma, and flavour, when compared with the measured concentration of that compound. Therefore, in order to assess the contribution of a specific compound to the overall beer flavour, the “flavour unit” (FU) is introduced. FU is the ratio of the concentration of a flavour-active compound and its threshold value: a 0.5 FU increase or decrease is perceived by the taster, but the cause may not be identified, whereas it can be identified in the case of a 1 FU change [37]. However, it has to be underlined that the flavour of beer is not be considered as the sum of the individual intensity of each compound because of synergy and/or suppression phenomena that may arise [32].
From Table 4, all volatiles compounds are detected in such concentration that their FU is lower than 1 in the original ale beer. The higher FU (0.77, 0.33, and 0.29) in OB is associated with isoamyl alcohol, ethyl hexanoate, and acetaldehyde, respectively. These results highlight that the brewed beer had not an intense flavour and many volatiles contributed weakly to the overall flavour of original beer. As expected, the LAB shows a lower FU for all the compounds while the low alcohol beer with supplements (LAB+) shows a FU of aldehydes like the original beer.
The sensory profiles of beer samples (OB, LAB, and LAB+) on taste and aroma are reported in Figures 2(a)-2(b). The original beer mainly presents fruity ester-like and malty notes; a good body and linger. Similarly, the main aroma notes are malty, caramel, burnt, and fruity/esters. The malty note is a characteristic flavour of malt that may be found especially in dark beers and also fruity ester-like notes is typical of ale beers (Figures 2(a)-2(b)).
The body, as well as the alcoholic/solvent descriptor, is decreased after the removal of ethanol in both low alcohol beers (Figure 2(a)), in which the sour taste is more pro-nounced than in the original beer. The addition of hop extract and pectin solutions has improved the body of LAB+ sample which is perceived less sweet, with less pronounced cereal,
caramel, bitter, and linger notes than LAB sample(𝑃 < 0.05)
(Figure 2(a)).
Regarding the aroma (Figure 2(b)), in LAB+ sample the hop and fruity-citrus notes are perceived as those in the original beer.
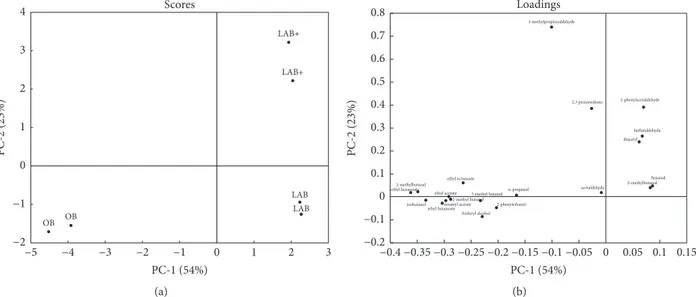
Principal Component Analysis (PCA) is performed on sensory panel data related to GC/MS data, taste and aroma descriptors, in order to explain the total variability of the characteristics analysed, using the cross-validation tech-nique.
Including all the volatile compounds, the first principal component (PC1) explains 54% of the total variation, and PC2 explains 23% of the total variation. The PCA shows a good separation of the beer samples which are clearly defined.
The OB sample forms a clear group in the negative quadrant of the PC1 and is associated with the level of higher alcohols and esters (Figures 3(a)-3(b)). The LAB samples are located in the positive PC1 quadrant of PCA plot and are largely associated with aldehydes and ketones, as shown also in the Table 4.
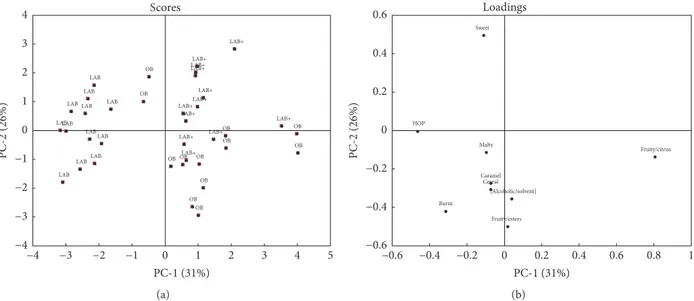
The biplot of PCA based on the taste data of panellists (Figures 4(a) and 4(b)) points to a separation of the beer sam-ples in three groups, confirming the significant differences found by the sensory analysis for the taste attributes.
In particular, OB sample is mostly correlated to body, fruity/esters, fruity/citrus, malty, and alcohol; burnt, astrin-gent, and cereal are better associated with LAB sample. No significant correlations of taste descriptors with LAB+ sample are found.
On the whole, the low alcohol beers (LAB and LAB+) are negatively correlated with PC1 and so correlated with sour, astringent, burnt, cereal, and caramel descriptors; the OB is plotted in the positive quadrant of PC1 and PC2 and it is strongly correlated with most of taste descriptors.
On the basis of analysed aroma descriptors (Figures 5(a)-5(b)), PC1 explains 36% of the variance in the dataset,
LAB LAB LAB+ LAB+ OB OB Scores −2 −1 0 1 2 3 4 PC-2 (23%) −4 −3 −2 −1 0 1 2 3 −5 PC-1 (54%) (a) Loadings −0.2 −0.1 0 0.1 0.2 0.3 0.4 0.5 0.6 0.7 0.8 PC-2 (23%) −0.35 −0.3 −0.25 −0.2 −0.15 −0.1 −0.05 0 0.05 0.1 0.15 −0.4 PC-1 (54%) n-propanol isobutanol 3-methyl butanol 2-methyl butanol furfuryl alcohol 2-phenylethanol ethyl acetate ethyl butanoate isoamyl acetate ethyl hexanoate ethyl octanoate acetaldehyde 2-methylbutanal 3-methylbutanal hexanal furfuraldehyde 3-methylpropionaldehyde 2-phenylacetaldehyde diacetyl 2,3 pentanedione (b)
Figure 3: PCA plots of volatile compounds of OB, LAB, and LAB+ samples: (a) score plot and (b) loading plot.
OB OB OB OB OB OB OB OB OB OB OB OB LAB LAB LAB LAB LAB LABLAB
LAB LAB LAB LAB
LAB LAB+ LAB+ LAB+ LAB+ LAB+
LAB+ LAB+LAB+
LAB+ LAB+ LAB+ LAB+ Scores −3 −2 −1 0 1 2 3 4 5 −4 PC-1 (31%) −5 −4 −3 −2 −1 0 1 2 3 4 5 6 PC-2 (26%) (a) Fruity/esters Alcoholic/solvent Fruity/citrus HOP Cereal Malty Caramel Burnt Sweet Bitter Sour Astringent Body Linger Loadings −0.6 −0.5 −0.4 −0.3 −0.2 −0.1 0 0.1 0.2 PC-2 (26%) −0.4 −0.3 −0.2 −0.1 0 0.1 0.2 0.3 0.4 0.5 −0.5 PC-1 (31%) (b)
Figure 4: PCA plots of taste sensory evaluation of OB, LAB, and LAB+ samples: (a) score plot and (b) loading plot.
whereas PC2 explains an additional 16% of the variance. The beer samples are variously distributed and LAB+ sample is overlapped with OB in the positive PC1 quadrant, in terms of fruity-esters, fruity-citrus, and alcoholic descriptors. Sweet and fruity-citrus descriptors show an evident correlation with the OB sample, while burnt and hop are more related to the LAB sample.
In this study, the PCA discriminates the beer samples mainly in terms of analytical composition of volatiles and sensory analysis of taste; on the contrary, PCA shows some relationship in terms of aroma, as perceived by panellists between LAB+ and OB samples.
4. Conclusions
Low alcohol ale beer (1.1% vol) was produced through osmotic distillation technique in a small pilot plant. The large
amount of phenolic compounds in the ale beer, which are of huge interest for the brewing industry for their poten-tial health benefits, was unchanged after dealcoholization. An improvement with respect to the previous studies was achieved. The forced carbonation (LAB) and the addition of pectins (LAB+) ensured both a higher concentration
of dissolved CO2 and a higher stability of foam in LAB.
Although a loss of volatiles still occurred, higher retention of
higher alcohols was obtained by fluxing CO2in stripper side
during the process.
The original beer mainly presented fruity (ester-like) and malty notes, a good body and linger. Results of the sensory analysis highlighted that some differences among LAB samples and OB still remained for body and the main descriptors when the beers were tasted.
Analysis of taste descriptors showed greater correlation with “burnt,” “astringent,” and “cereal” descriptors for the
OB OB OB LAB LABLAB OB OB OB LAB+ OB OB LAB+ LAB LAB+ LAB OB OB LAB LAB LAB+ LAB+ LAB LAB+
LAB LAB OB LAB+
LAB LAB+ LAB OB LAB+LAB+ LAB+ LAB+ Scores −4 −3 −2 −1 0 1 2 3 4 PC-2 (26%) −3 −2 −1 0 1 2 3 4 5 −4 PC-1 (31%) (a) Fruity/esters [Alcoholic/solvent] Fruity/citrus HOP Cereal Malty Caramel Burnt Sweet Loadings −0.4 −0.2 0 0.2 0.4 0.6 0.8 1 −0.6 PC-1 (31%) −0.6 −0.4 −0.2 0 0.2 0.4 0.6 PC-2 (26%) (b)
Figure 5: PCA plots of aroma sensory evaluation of OB, LAB, and LAB+ samples: (a) score plot and (b) loading plot.
LAB sample, while “body,” “fruity/esters,” “fruity/citrus,” “malty,” and “alcohol” descriptors mostly correlated to the OB sample.
The addition of hop extract and pectin solution allowed maintaining fruity-citrus and hop notes, during the taste, similar to the OB, even if some differences (i.e., cereal and malty) in terms of taste and aroma were still perceived. The PCA analysis results clearly showed a differentiation in volatiles composition among beer samples (OB, LAB, and LAB+) although no significant differences in aroma (𝑃 < 0.05) between OB and LAB+ samples were perceived.
Conflicts of Interest
The authors declare that there are no conflicts of interest regarding the publication of this paper.
References
[1] H. Q. Yeo and S.-Q. Liu, “An overview of selected specialty beers: developments, challenges and prospects,” International Journal
of Food Science & Technology, vol. 49, no. 7, pp. 1607–1618, 2014.
[2] S. Porretta and G. Donadini, “A preference study for no alcohol beer in Italy using quantitative concept analysis,” Journal of the
Institute of Brewing, vol. 114, no. 4, pp. 315–321, 2008.
[3] M. Castro-Sepulveda, N. Johannsen, S. Astudillo et al., “Effects of beer, non-alcoholic beer and water consumption before exer-cise on fluid and electrolyte homeostasis in athletes,” Nutrients, vol. 8, no. 6, article no. 345, 2016.
[4] T. Br´anyik, D. P. Silva, M. Baszczyˇnski, R. Lehnert, and J. B. Almeida E Silva, “A review of methods of low alcohol and alcohol-free beer production,” Journal of Food Engineering, vol. 108, no. 4, pp. 493–506, 2012.
[5] L. Liguori, G. De Francesco, P. Russo, G. Perretti, D. Albanese, and M. Di Matteo, “Quality attributes of low-alcohol top-fermented beers produced by membrane contactor,” Food and
Bioprocess Technology, vol. 9, no. 1, pp. 191–200, 2016.
[6] L. Liguori, P. Russo, D. Albanese, and M. Di Matteo, “Effect of process parameters on partial dealcoholization of wine by osmotic distillation,” Food and Bioprocess Technology, vol. 6, no. 9, pp. 2514–2524, 2013.
[7] L. Liguori, P. Russo, D. Albanese, and M. Di Matteo, “Evolution of quality parameters during red wine dealcoholization by osmotic distillation,” Food Chemistry, vol. 140, no. 1-2, pp. 68– 75, 2013.
[8] L. Liguori, G. Attanasio, D. Albanese, and M. Di Matteo, “Aglianico wine dealcoholization tests,” Computer Aided
Chem-ical Engineering, vol. 28, no. C, pp. 325–330, 2010.
[9] R. Ferrarini, G. M. Ciman, F. Camin, S. Bandini, and C. Gostoli, “Variation of oxygen isotopic ratio during wine dealcoholiza-tion by membrane contactors: experiments and modelling,”
Journal of Membrane Science, vol. 498, pp. 385–394, 2016.
[10] G. De Francesco, V. Sileoni, O. Marconi, and G. Perretti, “Pilot plant production of low-alcohol beer by osmotic distillation,”
Journal of the American Society of Brewing Chemists, vol. 73, no.
1, pp. 41–48, 2015.
[11] S. Varavuth, R. Jiraratananon, and S. Atchariyawut, “Experi-mental study on dealcoholization of wine by osmotic distillation process,” Separation and Purification Technology, vol. 66, no. 2, pp. 313–321, 2009.
[12] P. Russo, L. Liguori, D. Albanese, A. Crescitelli, and M. Di Matteo, “Investigation of osmotic distillation technique for beer dealcoholization,” Chemical Engineering Transactions, vol. 32, pp. 1735–1740, 2013.
[13] L. Liguori, G. De Francesco, P. Russo, G. Perretti, D. Albanese, and M. Di Matteo, “Production and characterization of alcohol-free beer by membrane process,” Food and Bioproducts
Process-ing, vol. 94, pp. 158–168, 2015.
[14] L. Liguori, G. De Francesco, P. Russo, D. Albanese, G. Perretti, and M. Di Matteo, “Quality improvement of low alcohol craft beer produced by evaporative pertraction,” Chemical
Engineer-ing Transactions, vol. 43, pp. 13–18, 2015.
[15] A. Pavsler and S. Buiatti, “Non-lager beer,” Beer in Health and
Disease Prevention, pp. 17–30, 2008.
[17] V. Singleton and J. A. Rossi, “Colorimetry of total phenolics with phosphomolybdic-phosphotungstic acid reagents,” American
Journal of Enology and Viticulture, vol. 16, no. 3, pp. 144–158,
1965.
[18] W. Brand-Williams, M. E. Cuvelier, and C. Berset, “Use of a freeradical method to evaluate antioxidant activity,”
Lebensmit-tel-Wissenschaft Technologie, vol. 28, pp. 25–30, 1995.
[19] P. Vesely, L. Lusk, G. Basarova, J. Seabrooks, and D. Ryder, “Analysis of Aldehydes in Beer using solid-phase Microextrac-tion with on-fiber derivatizaMicroextrac-tion and gas chromatography/mass spectrometry,” Journal of Agricultural and Food Chemistry, vol. 51, no. 24, pp. 6941–6944, 2003.
[20] S. Malfliet, K. Goiris, G. Aerts, and L. de Cooman, “Analytical-sensory determination of potential flavour deficiencies of light beers,” Journal of the Institute of Brewing, vol. 115, no. 1, pp. 49– 63, 2009.
[21] S. M. Smedley, “Colour determination of beer using tristimulus values,” Journal of the Institute of Brewing, vol. 98, no. 6, pp. 497– 504, 1992.
[22] D. Granato, G. F. Branco, J. D. A. F. Faria, and A. G. Cruz, “Characterization of Brazilian lager and brown ale beers based on color, phenolic compounds, and antioxidant activity using chemometrics,” Journal of the Science of Food and Agriculture, vol. 91, no. 3, pp. 563–571, 2011.
[23] A. Gresser, “Properties and quality,” in Handbook of Brewing, H. Michael Eblinger, Ed., pp. 359–395, Wiley-VCH Verlag GmbH & Co. KGaA, Weinheim, Germany, 2009.
[24] L. ˇCeslov´a, M. Holˇcapek, M. Fidler, J. Drˇstiˇckov´a, and M. L´ısa, “Characterization of prenylflavonoids and hop bitter acids in various classes of Czech beers and hop extracts using high-performance liquid chromatography-mass spectrometry,”
Journal of Chromatography A, vol. 1216, no. 43, pp. 7249–7257,
2009.
[25] J. Lu, H. Zhao, J. Chen et al., “Evolution of phenolic compounds and antioxidant activity during malting,” Journal of Agricultural
and Food Chemistry, vol. 55, no. 26, pp. 10994–11001, 2007.
[26] T. Nakamura, N. Coichev, and H. D. Moya, “Modified CUPRAC spectrophotometric quantification of total polyphenol content in beer samples using Cu(II)/neocuproine complexes,” Journal
of Food Composition and Analysis, vol. 28, no. 2, pp. 126–134,
2012.
[27] A. Piazzon, M. Forte, and M. Nardini, “Characterization of phenolics content and antioxidant activity of different beer types,” Journal of Agricultural and Food Chemistry, vol. 58, no. 19, pp. 10677–10683, 2010.
[28] P. A. R. Tafulo, R. B. Queir´os, C. M. Delerue-Matos, and M. G. F. Sales, “Control and comparison of the antioxidant capacity of beers,” Food Research International, vol. 43, no. 6, pp. 1702–1709, 2010.
[29] D. E. Briggs, C. A. Boulton, P. A. Brookes, and R. Stevens, “The science of mashing,” in Brewing science and practice, D. E. Briggs, C. A. Boulton, P. A. Brookes, and R. Stevens, Eds., p. 101, Woodhead Publishing Limited, UK, 2004.
[30] M. Riu-Aumatell, P. Mir´o, A. Serra-Cayuela, S. Buxaderas, and E. L´opez-Tamames, “Assessment of the aroma profiles of low-alcohol beers using HS-SPME-GC-MS,” Food Research
International, vol. 57, pp. 196–202, 2014.
[31] D. A. Gee and W. F. Ramirez, “A flavour model for beer fermen-tation,” Journal of the Institute of Brewing, vol. 100, no. 5, pp. 321– 329, 1994.
[32] J. J. Baert, J. De Clippeleer, P. S. Hughes, L. De Cooman, and G. Aerts, “On the origin of free and bound staling aldehydes in
beer,” Journal of Agricultural and Food Chemistry, vol. 60, no. 46, pp. 11449–11472, 2012.
[33] C. A. Blanco, C. Andr´es-Iglesias, and O. Montero, “Low-alcohol Beers: Flavor Compounds, Defects, and Improvement Strategies,” Critical Reviews in Food Science and Nutrition, vol. 56, no. 8, pp. 1379–1388, 2016.
[34] J. De Clippeleer, F. Van Opstaele, J. Vercammen, G. J. Francis, L. De Cooman, and G. Aerts, “Real-time profiling of volatile malt aldehydes using selected ion flow tube mass spectrometry,”
LCGC North America, vol. 28, pp. 386–395, 2010.
[35] A. Buettner, Springer Handbook of Odor, Springer International Publishing, Cham, Switzerland, 2017.
[36] N. Hashimoto and T. Eshima, “Oxidative degradation of isohu-mulones in relation to flavour stability of beer,” Journal of the
Institute of Brewing, vol. 85, no. 3, pp. 136–140, 1979.
[37] M. C. Meilgaard, “Flavor chemistry of beer: part II: flavor and threshold of 239 aroma volatiles,” Techical Quarterly
Hindawi www.hindawi.com International Journal of Volume 2018
Zoology
Hindawi www.hindawi.com Volume 2018 Anatomy Research InternationalPeptides
Hindawi www.hindawi.com Volume 2018 Hindawi www.hindawi.com Volume 2018 Journal of Parasitology ResearchGenomics
International Journal of Hindawi www.hindawi.com Volume 2018Hindawi Publishing Corporation
http://www.hindawi.com Volume 2013 Hindawi www.hindawi.com