MBoC |
ARTICLE
Mcl-1 involvement in mitochondrial dynamics
is associated with apoptotic cell death
Giampaolo Morcianoa, Carlotta Giorgia, Dario Balestrab, Saverio Marchia, Daniela Perronec,
Mirko Pinottib, and Paolo Pintona
aDepartment of Morphology, Surgery and Experimental Medicine, Section of Pathology, Oncology and Experimental Biology, Laboratory for Technologies of Advanced Therapies, bDepartment of Life Sciences and Biotechnology, and cDepartment of Chemical and Pharmaceutical Sciences, University of Ferrara, FE 44121 Ferrara, Italy
ABSTRACT The B-cell lymphoma-2 (Bcl-2) family proteins are critical regulators of apoptosis and consist of both proapoptotic and antiapoptotic factors. Within this family, the myeloid cell leukemia factor 1 (Mcl-1) protein exists in two forms as the result of alternative splicing. The long variant (Mcl-1L) acts as an antiapoptotic factor, whereas the short isoform (Mcl-1S) displays proapoptotic activity. In this study, using splice-switching antisense oligonucleotides (ASOs), we increased the synthesis of 1S, which induced a concurrent reduction of Mcl-1L, resulting in increased sensitivity of cancer cells to apoptotic stimuli. The Mcl-1 ASOs also induced mitochondrial hyperpolarization and a consequent increase in mitochondrial calcium
(Ca2+) accumulation. The high Mcl-1S/L ratio correlated with significant hyperfusion of the
entire mitochondrial network, which occurred in a dynamin-related protein (Drp1)–depen-dent manner. Our data indicate that the balance between the long and short variants of the Mcl-1 gene represents a key aspect of the regulation of mitochondrial physiology. We pro-pose that the Mcl-1L/S balance is a novel regulatory factor controlling the mitochondrial fu-sion and fisfu-sion machinery.
INTRODUCTION
More than 20 years ago, the identification and cloning of Bcl-2 marked the discovery of an entirely new class of genes with crucial roles in cancer (Hanada et al., 1993). The Bcl-2 family of proteins includes a great variety of members with proapoptotic (Bax, Bak, Bok, Bid, Bim, Noxa, Puma, myeloid cell leukemia factor 1 [Mcl-1] variant S) or antiapoptotic (B-cell lymphoma-2 [Bcl-2], Bcl-xL, Bcl-w, Mcl-1L) functions. They form homodimers and heterodimers
through Bcl-2 homology (BH) domains. The relationships and rela-tive ratios among the Bcl-2 family proteins are critical in cell fate determination (Boise et al., 1995).
Mcl-1 was discovered based on its increased expression during cell commitment toward differentiation in a human myeloid leuke-mia cell line (Kozopas et al., 1993). In humans, the Mcl-1 pre-mRNA undergoes alternative splicing (AS) to produce two isoforms with opposite functions. The first isoform, Mcl-1L, is primarily anchored by its transmembrane (TM) domain (Yang et al., 1995) to the outer mitochondrial membrane (OMM), where it inhibits the release of cytochrome c (Clohessy et al., 2006). Mcl-1L consists of 350 amino acids (aa) encoded by three exons. Bcl-2 and Mcl-1 share high simi-larity, especially in their carboxyl termini (C-ter), which terminate in a hydrophobic domain with membrane-spanning potential (Kozopas et al., 1993). The similarities between these two genes are highly significant, although Mcl-1L and Bcl-2 are clearly distinguishable, except for two nearly identical stretches (7 aa each). The amino ter-minus (N-ter) of Mcl-1L differs from that of Bcl-2 in that it contains regions of low sequence complexity and sequences rich in proline, glutamic acid, serine, and threonine residues, which are often found in proteins that are rapidly turned over by the proteasome (Hershko and Ciechanover, 1998). As a result, unlike other Bcl-2 family mem-bers, the Mcl-1L protein is extremely unstable and has a very short
Monitoring Editor Donald D. Newmeyer La Jolla Institute for Allergy and Immunology
Received: Jan 16, 2015 Revised: Oct 28, 2015 Accepted: Oct 29, 2015
This article was published online ahead of print in MBoC in Press (http://www .molbiolcell.org/cgi/doi/10.1091/mbc.E15-01-0028) on November 4, 2015. Address correspondence to: Paolo Pinton ([email protected]).
© 2016 Morciano et al. This article is distributed by The American Society for Cell Biology under license from the author(s). Two months after publication it is avail-able to the public under an Attribution–Noncommercial–Share Alike 3.0 Unported Creative Commons License (http://creativecommons.org/licenses/by-nc-sa/3.0). “ASCB®,” “The American Society for Cell Biology®,” and “Molecular Biology of the Cell®” are registered trademarks of The American Society for Cell Biology. Abbreviations used: AEQ, aequorin; AS, alternative splicing; ASO, antisense oli-gonucleotide; BH, Bcl-2 homology domain; cyt, cytosolic; Drp1, dynamin-related protein 1; ER, endoplasmic reticulum; ESE, exonic splicing enhancer; FCCP, car-bonyl cyanide 4-(trifluoromethoxy) phenylhydrazone; IMM, inner mitochondrial membrane; IP3, inositol 1,4,5 triphosphate; IP3R, IP3 receptor; Mcl-1, myeloid cell leukemia factor 1; MCU, mitochondrial Ca2+ uniporter; MOMP, mitochondrial outer membrane permeabilization; mt, mitochondrial; OMM, outer mitochondri-al membrane; TM, transmembrane domain; TMRM, tetramethylrhodamine, methyl ester; Ψm, mitochondrial membrane potential.
pre-mRNA to alter exon inclusion or exclusion (Spitali and Aartsma-Rus, 2012). This strategy has been extensively explored to induce exon skipping as a therapy for human genetic disorders (Koo and Wood, 2013), and it also represents a valid option for cancer treat-ment (Bauman et al., 2010).
Mcl-1 has features that suggest that it is an ideal target for thera-peutic splicing modulation. For example, an sc-ASO-mediated shift of the isoform ratio toward proapoptotic Mcl-1S triggers cancer cell apoptosis and inhibits tumor development in mouse models (Shieh et al., 2009; Kim et al., 2011). However, the sc-ASOs tested thus far were designed to target Mcl-1L exon–intron junctions that are mod-erately conserved among human genes, thus potentially leading to off-target effects.
Driven by these considerations, we designed a novel Mcl-1-spe-cific sc-ASO that could significantly reduce the Mcl-1L/S ratio and sensitize cells to apoptosis. For the first time, we demonstrated that the Mcl1S-mediated mechanism involves mitochondrial physiology, thus suggesting that the Mcl-1L/S balance is a critical regulator of mitochondrial morphology and dynamics.
RESULTS
Mcl-1 mRNA splicing pattern and protein expression In view of the importance of Mcl-1 in determining apoptosis sensi-tivity, we measured the expression levels of both Mcl-1L and Mcl-1S in tumor cells.
HeLa cells have a significantly high level of Mcl-1L mRNA, as il-lustrated by the 689–base pair fragment from a reverse transcription (RT) PCR analysis (Figure 1A). As expected, the shorter isoform Mcl-1S (441 base pairs) is weakly expressed compared with the long variant. Western blot (WB) revealed that the protein counterparts of the two isoforms were expressed at comparable levels (Figure 1B). The discrepancy between mRNA and protein patterns may be due to the higher rate of proteasome-mediated turnover of the long form compared with that of the short form, which can be blocked by carbobenzoxy-Leu-Leu-leucinal (MG132) treatment (Figure 1C).
To promote a shift toward the proapoptotic form of Mcl-1 and investigate the underlying mechanism, we designed a panel of novel 2′-O-methyl phosphorothioate–based oligonucleotides tar-geting the putative exonic splicing enhancers (ESEs) of Mcl-1L exon 2 (Figure 1D). Treatment of HeLa cells with sc-ASO and subsequent RT-PCR analysis showed that only Mcl-1 sc-ASO3 (Mcl-1S3) induced an appreciable and dose-dependent effect with a shift toward the Mcl-1S form (Figure 1E). The capacity of Mcl-1S3 to decrease Mcl-1L protein production was then assessed by WB using protein lysates of HeLa cells 24 h after treatment (Figure 1F), which demon-strated a significantly lower level of Mcl-1L (40 kDa) compared with the untreated cells. The expression of the smaller protein (32 kDa) did not vary appreciably. This could be due to the labile nature and high instability of Mcl-1 (Chao et al., 1998; Thomas et al., 2010), which make its detection difficult.
Taken together, these results showed that steric interference of the ESE elements in the Mcl-1 exon 2 pre-mRNA by the newly de-signed Mcl-1S3 leads to exon skipping and a consequent increase in the expression of the short Mcl-1S protein isoform.
Shifting the dominant Mcl-1 variant from L to S reestablished sensitivity to apoptosis in HeLa cells
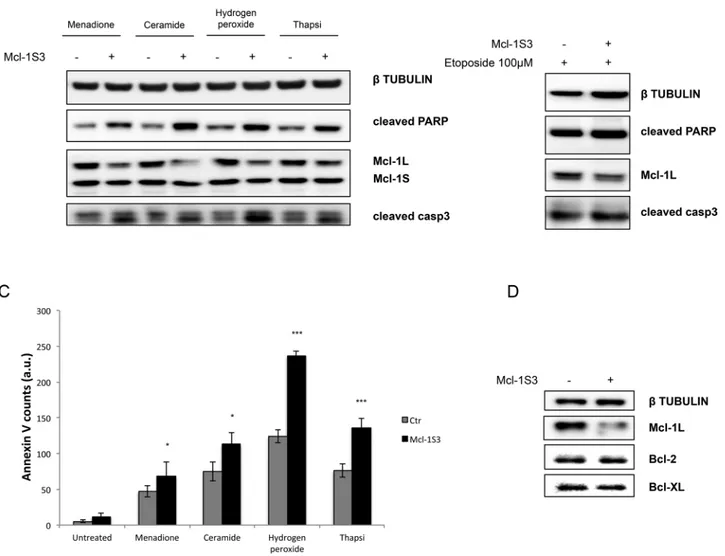
Next we evaluated whether modifying Mcl-1L pre-mRNA splicing with Mcl-1S3 could lead to an increase in apoptosis upon treatment with Ca2+-dependent apoptotic stimuli. To test this hypothesis, we analyzed apoptosis by both WB analysis of two apoptotic markers, including cleaved poly(ADP)ribose polymerase (PARP) and half-life (1–3 h; Maurer et al., 2006). The rapid induction and
de-struction of Mcl-1L has been proposed as a molecular mechanism for cells to switch between survival and apoptotic pathways in re-sponse to various stresses (Opferman et al., 2003). Sequence analy-sis shows that Mcl-1L contains three putative BH domains: BH1–3. The BH2 domain allows Mcl-1 to heterodimerize with other Bcl-2 family members and is critical for antiapoptotic pathways (Yin et al., 1994). In contrast, the BH3 motif has a prominent proapoptotic role (Kelekar and Thompson, 1998), especially in the presence of a direct activator of Bax or Bak (Kuwana et al., 2005).
The second major splicing product of Mcl-1 arises from exon 2 skipping and encodes a 271-aa protein isoform called Mcl-1S. Com-pared with the longer variant, Mcl-1L, Mcl-1S lacks the BH1, BH2, and TM domains (Bae et al., 2000; Bingle et al., 2000) and is primar-ily localized to the cytosol. Although it occurs with low efficiency, Mcl-1 may undergo an additional AS event to produce an extrashort Mcl-1 form (Mcl-1ES) that interacts with Mcl-1L and induces the mi-tochondrial cell death pathway (Kim et al., 2009).
Given the clear association between defective apoptosis and cancer and because Mcl-1 is often overexpressed in several types of human tumors (Derenne et al., 2002; Khoury et al., 2003; Placzek et al., 2010; Perciavalle and Opferman, 2013), many attempts have been made to reestablish cellular sensitivity to apoptosis by modu-lating Mcl-1 expression.
Developments in the study of apoptosis have also uncovered a central role for mitochondrial morphology. Its influence has been observed for bioenergetic and redox homeostasis (Hackenbrock, 1966), Ca2+ regulation (Giorgi et al., 2012), and cell life and death decisions (Scheckhuber, 2005), with mitochondrial shape influenc-ing function and vice versa. A number of components of the fission and fusion machinery, including optic atrophy 1 (OPA1), Fis1, dyna-min-related protein 1 (Drp1), mitofusin 1 (MFN1), and MFN2, have been directly implicated in the alteration of mitochondrial shape and thus in the regulation of apoptosis (James et al., 2003; Frezza et al., 2006), although often with apparently contradictory results. In this scenario, Drp1 has been suggested to be both a fundamental inducer of apoptosis (Frank et al., 2001) and an inhibitor of Ca2+ -dependent apoptosis (Szabadkai et al., 2004) by fragmenting the mitochondrial network into punctate units.
Although mitochondrial fusion has been associated with a healthy cell state because of matrix content exchanges (Chen et al., 2005), it has recently been shown that fusion can also favor cell death (Westrate et al., 2014). Additional evidence for this arises from the mitochondrial protein 18 kDa (MTP18), for which a reduc-tion impairs mitochondrial morphology, increasing the interconnec-tions among mitochondria and increasing the response to apoptotic stimuli (Tondera et al., 2004).
Antisense oligonucleotides represent powerful tools for manipu-lating gene expression for therapeutic purposes and have been ex-tensively exploited to knock down genes involved in cancer progres-sion and therapeutic resistance (Gleave and Monia, 2005) and in a wide range of genetic disorders (Hadaschik et al., 2008). In particu-lar, the therapeutic potential of antisense oligonucleotide (ASO)– mediated Mcl-1L silencing has been shown in a variety of cancer cells, including blood cancer, melanoma (Skvara et al., 2005), gastric cancer (Wacheck et al., 2006), hepatocellular carcinoma (Sieghart et al., 2006), and squamous cell carcinoma (Skoda et al., 2008) cells, making Mcl-1L an important target in both liquid and solid tumors.
In addition, ASOs are emerging as promising tools to finely mod-ulate gene expression by disrupting pre-mRNA splicing (splice-switching ASOs [sc-ASOs]). In this case, the strategy consists in us-ing ASOs to mask splicus-ing regulatory elements in the nascent
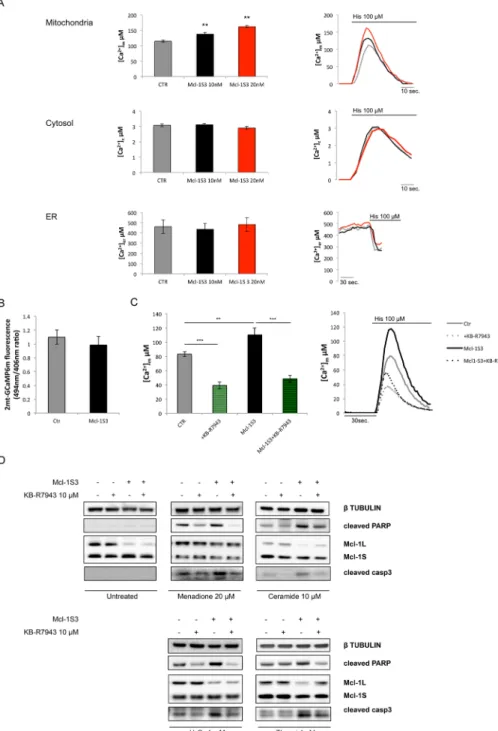
volved in life and death decision pathways, we evaluated whether in-tracellular Ca2+ homeostasis was affected by the Mcl-1L/S imbalance. For this purpose, we monitored Ca2+ homeostasis using specific organelle-targeted aequorin (AEQ) probes, including those that were targeted to the cytosol (cytAEQ), mitochondria (mtAEQ), and endoplasmic reticulum (erAEQ; Bonora et al., 2013b). Specifically, we cotransfected each aequorin probe with a scrambled oligonucle-otide or different concentrations of Mcl-1S3 (Figure 3A). Under all conditions, we investigated the Ca2+ response to histamine (His), which signals through Gq-coupled receptors to produce inositol 1,4,5 triphosphate (IP3; Figure 3A).
Mcl-1S3–expressing cells displayed increased mitochondrial Ca2+ uptake after agonist addition (Figure 3A, top). This effect of Mcl-1S3 was dose dependent. We observed a significant increment in [Ca2+] exclusively at the mitochondrial level, which suggested a specific mito-chondrial effect (Figure 3A, middle and bottom). Of importance, Mcl-1S3 did not alter the basal mitochondrial Ca2+ levels measured by a plasmid encoding the mitochondrial-targeted GCaMP6m (Figure 3B).
These findings indicated that the Mcl-1S3 ASO caused an imbalance in the Mcl-1L/S ratio, which altered mitochondrial Ca2+ caspase 3, and annexin V staining. Treatment with Mcl-1S3 resulted
in increased apoptotic cell death (Galluzzi et al., 2015), as indicated by apoptosis markers (Figure 2A) and an increase in the number of annexin V–positive cells (Figure 2C). HeLa cells had increased sus-ceptibility to menadione, ceramide, hydrogen peroxide, and thapsi-gargin when the 1S isoform was dominant. Of importance, Mcl-1S3 did not promote apoptosis with Ca2+-independent stimuli, such as etoposide (Figure 2B).
These results indicated that the shift in splicing from Mcl-1L to Mcl-1S by Mcl-1S3 is a priming stimulus for extensive cell death through the mitochondrial intrinsic apoptotic pathway. The ab-sence of appreciable cell death in untreated cells (Figures 2C and later discussion) upon Mcl-1S3 transfection is not likely due to a balancing mechanism activated by other antiapoptotic proteins, such as Bcl-2 and Bcl-XL, upon the loss of Mcl-1L protein (Figure 2D). Mcl-1S3–induced imbalance in the Mcl-1L/S ratio altered
mitochondrial Ca2+ homeostasis in HeLa cells
Given that Mcl-1L is primarily located on the outer mitochondrial membrane and Ca2+ is an important second messenger molecule
in-FIGURE 1: Mcl-1 mRNA splicing pattern and protein expression in control and experimentally treated HeLa cells. (A) Splicing pattern and (B) protein expression of Mcl-1 in control HeLa cells. (C) MG132 treatment from 3 to 12 h shows that Mcl-1L has a rapid turnover via proteasomal degradation. (D) Schematic illustration of the ASO double-stranded RNAs complementary to the ESEs of exon 2. (E) Splicing shifting from Mcl-1L to Mcl-1S after ASO transfection is dose dependent. (F) Relative protein expression levels. ***p < 0.001.
and Scarpa, 1973; Gunter and Pfeiffer, 1990; Suski et al., 2012): depolarization reduces the driving force for Ca2+ uptake by mitochondria and thereby prevents Ca2+ overload. Conversely, hyperpolarization increases Ca2+ uptake. To measure ΔΨ
m
changes, we stained mitochondria with a fluorescent cationic probe, tetramethylrhodamine methyl ester (TMRM), and ana-lyzed the cells by confocal microscopy. To allow for nonspecific TMRM binding, we corrected measurements for residual TMRM fluorescence after full ΔΨm collapse with the mitochondrial
un-coupler carbonyl cyanide 4-(trifluoromethoxy) phenylhydrazone (FCCP).
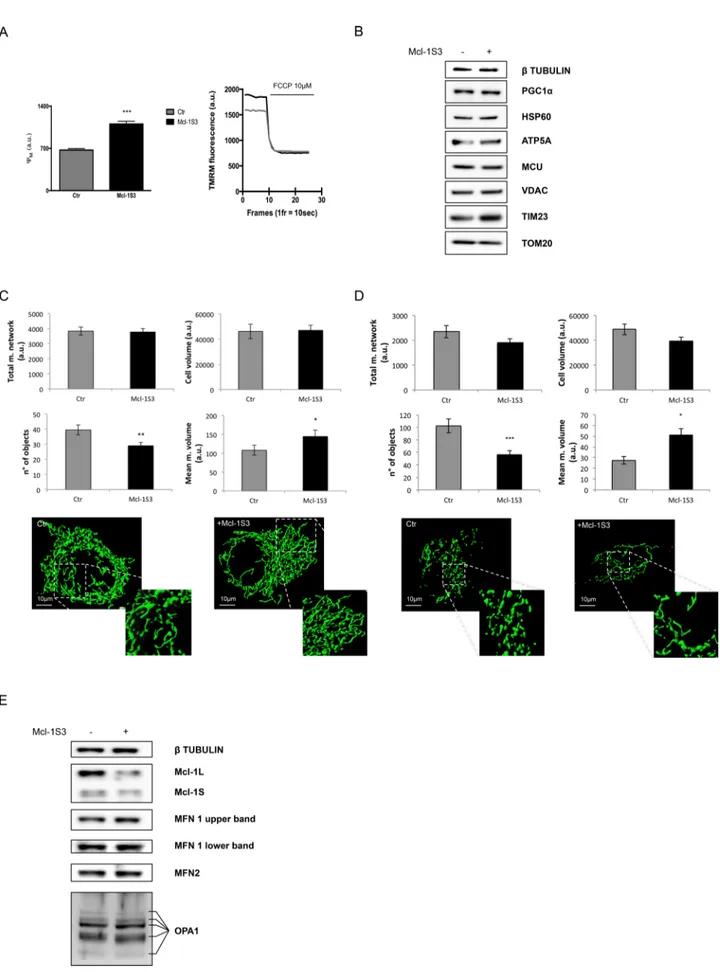
Mcl-1S3–transfected cells had a significant increase in Ψm
com-pared with the controls (Figure 4A). Of importance, the mitochon-drial hyperpolarization that was observed upon reduction of the Mcl-1L/S ratio could explain the previously described increase in mitochondrial Ca2+ accumulation (Figure 3A).
Subsequently we assessed whether Mcl-1S3 could modify the expression level of the MCU, which facilitates Ca2+ uptake into the mitochondrial matrix (Marchi and Pinton, 2014). No difference homeostasis without perturbing other organelles. These data also
explained the increased susceptibility to cell death upon the treat-ment of Mcl-1S3–transfected cells with Ca2+-dependent apoptotic stimuli (as observed in Figure 2, A and C). Of note, pharmacological inhibition of Ca2+ uptake with the thiourea derivative KB-R7943 (permeable mitochondrial Ca2+ uniporter [MCU] blocker) in Mcl-1S3-transfected cells decreased mitochondrial Ca2+ concentration by ∼50% (Figure 3C) and protected cells from the ASO-induced effects (Figure 3D). Thus these results suggest that the mitochondrial Ca2+ level plays a pivotal role in determining susceptibility to cell death when Mcl-1 levels are unbalanced.
We further explored whether the decrease in the Mcl-1L/S ratio could modify other mitochondrial parameters, such as organelle morphology and membrane potential.
A greater mitochondrial membrane potential promoted
Ca2+ uptake in Mcl-1S3–treated HeLa cells
The mitochondrial membrane potential Ψm is a critical regulator
of Ca2+ accumulation (Scarpa and Azzone, 1970; Vinogradov
FIGURE 2: Apoptosis in control and experimentally treated HeLa cells. Apoptosis assessment in control and Mcl-1S3-transfected HeLa cells upon treatment with Ca2+-dependent (A) and Ca2+-independent (B) apoptotic stimuli. Western blot analysis of the apoptotic markers cleaved PARP and cleaved caspase 3. (C) Quantification of annexin V–stained cells; significant differences, *p < 0.05 and ***p < 0.001. a.u., arbitrary units. Treatments: 20 μM menadione for 2 h; 10 μM ceramide for 2 h; 1 mM H2O2 for 1 h, 4 μM thapsigargin for 2 h; 100 μM etoposide for 3 h. (D) Expression of major antiapoptotic proteins Bcl-2 (26 kDa) and Bcl-XL (26 kDa) upon altering the L/S isoform ratio. N = 3 for each experiment.
and HSP60 for matrix, and VDAC and TOM20 for OMM) were also unchanged (Figure 4B; β-tubulin was used as a loading marker). These data suggested that no changes in mitochondrial mass occurred.
Thus variation in Ψm appears to be the
main cause of increased mitochondrial Ca2+ uptake in Mcl-1S3–transfected HeLa cells, which do not exhibit changes in MCU expression, total mitochondrial mass, or mitochondrial biogenesis (as evaluated in Figure 4B by PGC1α detection).
Reduced Mcl-1L/S ratio induced mitochondrial fusion in HeLa cells Mitochondria are dynamic organelles that fuse and divide to form constantly changing tubular networks (Bereiter-Hahn and Voth, 1994; Scorrano, 2013; Marchi et al., 2014). This evolutionarily conserved activity affects membrane composition (e.g., IMM and OMM) and is mediated by the combined ef-fects of several large GTPases, potentially with other mitochondrial proteins (van der Bliek, 1999).
To assess changes in mitochondrial mor-phology in our experimental model, we used the mitochondria-targeted red fluores-cence protein mtDsRed. Specifically, we co-transfected HeLa cells with either the scram-bled oligonucleotide and mtDsRed (control) or Mcl-1S3 and mtDsRed. The fluorescent dye calcein was used as a marker of cell vol-ume to identify living cells and normalize the quantification of the mitochondrial net-work to cell volume (see Materials and Methods).
Confocal images revealed a decreased number of mitochondria in Mcl-1S3–trans-fected cells (designated as n° of objects by the analysis software) compared with the control. Moreover, Mcl-1-S3–transfected cells showed a higher mean mitochondrial volume (Figure 4C). Analyses of the total mitochondrial network and cell volumes re-vealed no significant differences.
The same results were confirmed in the SH-SY5Y cell line, which displayed a less filamentous network than did HeLa cells (Figure 4D).
Taken together, these findings indicated that 24 h after Mcl-1S3 transfection, a shift from Mcl-1L to Mcl-1S promoted mitochon-drial fusion without altering the total mito-chondrial volume. Of interest, the increased hyperfusion was not linked to enhanced ex-pression of fusion proteins, such as MFN1/2 and OPA1 (Figure 4E).
These data indicated that shifting from antiapoptotic to proapoptotic Mcl-1 isoforms promoted mito-chondrial hyperpolarization and increased mitomito-chondrial fusion in HeLa and SH-SY5Y cells.
in MCU expression was observed upon Mcl-1S3 transfection (Figure 4B). Similarly, the expression levels of other mitochondrial proteins (TIM23 for inner mitochondrial membrane [IMM], ATP5A
FIGURE 3: Ca2+ homeostasis and its role in the death of experimentally treated HeLa cells. (A) Ca2+ homeostasis was monitored via aequorin in mitochondria (top), cytosol (middle), and ER (bottom) in control and Mcl-1S3–transfected HeLa cells. The ASO had a specific, dose-dependent mitochondrial effect, as indicated by the black (10 nM Mcl-1S3) and red (20 nM Mcl-1S3) bars. (B) Basal mitochondrial Ca2+ concentrations were further assessed by imaging 2mt-GCaMP6m–expressing cells. (C) [Ca2+] upon pharmacological inhibition of mitochondrial Ca2+ uptake by the permeable MCU blocker KB-R7943 in control and Mcl-1S3–transfected HeLa cells. KB-R7943 (as confirmed by aequorin measurements) promoted ∼50% of the ion concentration in mitochondria. (D) Western blot analysis of the apoptotic markers cleaved PARP and caspase 3 in MCU inhibitor–treated cells. The inhibition of Ca2+ uptake protected cells from Ca2+-dependent apoptosis. Where indicated, the cells were challenged with 100 μM histamine. Significant differences, **p < 0.01 and ***p < 0.001. N = 6 for each experiment.
pattern at the G1/S transition after the cells were synchronized with
a double- thymidine block. Of interest, we observed a shift in the Mcl-1L/S ratio at the G1/S transition, with a greater amount of
Mcl-1S than Mcl-1L (Figure 7).
Drp1 interacted with Mcl-1L to regulate mitochondrial dynamics
Next, to further support our model, we investigated whether Drp1 could be coimmunoprecipitated with Mcl-1L. As shown in Figure 8A, Mcl-1L formed immune complexes with Drp1 in control HeLa cells, whereas Mcl-1S remained in the supernatant. The same result was obtained by performing the experiment in reverse; immunoprecipi-tation of overexpressed Drp1 and antibody cross-linking to protein A agarose revealed a preferential binding to Mcl-1L. These data suggested that the two proteins specifically interacted with each other to regulate the hyperfused mitochondrial state detected in previous experiments.
Lowering the Mcl-1L/S ratio inhibited Drp1 translocation from the cytosol to mitochondria
Drp1 localizes primarily in the soluble fraction of the cell (Shin et al., 1997). Although Drp1 can be found in membrane compartments, membrane localization occurs only under certain environmental conditions and depends on the phase of the cell cycle (Smirnova et al., 2001).
In HeLa cells, we detected Drp1 predominantly in the cytosol, which is in agreement with current literature, and moderately at the mitochondrial membranes (Figure 8B), where it likely exerts physio-logical roles in maintaining a basal fission rate. In contrast, Mcl-1L was enriched at the mitochondria, whereas Mcl-1S was found in the cytosol and endoplasmic reticulum (ER) compartments.
Drp1 translocates from the cytosol to mitochondria to exert its profission functions. To evaluate Mcl-1L function at the OMM during the fission/fusion processes, we assessed the amount of mitochon-drial Drp1 after overexpressing Drp1 and after altering the Mcl-1L/S ratio. As shown in Figure 8C, upon Drp1 overexpression, the level of mitochondrial Drp1 increased compared with mock-transfected cells. On Mcl-1S3 transfection, which consequently depleted Mcl-1L, Drp1 accumulation at mitochondria was less efficient (Figure 8C).
These findings suggested that Mcl-1L acts as a molecular anchor for mitochondrial Drp1 and further validated the pivotal role of Mcl-1L/S balance in the regulation of the fusion and fission machinery. DISCUSSION
Dysregulation of apoptosis contributes to numerous pathological conditions, including cancer. Indeed, one of the hallmarks of cancer cells is their capacity to evade apoptosis, prompting research for drugs that can restore cell death susceptibility in tumor cells (Fesik, 2005). The mitochondrial apoptotic pathway is regulated by interac-tions between members of the Bcl-2 protein family, which contain up to four BH domains (BH1–4; Kuwana and Newmeyer, 2003; Hardwick and Youle, 2009; Akl et al., 2014). Protein factors possessing all four BH domains, including Mcl-1L, antagonize apoptosis by preventing mitochondrial outer membrane permeabilization (MOMP), thus se-questering proapoptotic factors in mitochondria. Factors lacking one or more BH domains, including Mcl-1S, are proapoptotic and pro-mote MOMP. Mcl-1L is highly expressed in human malignancies, and its cellular localization is consistent with a role in controlling key mito-chondrial events during apoptosis (Thomas et al., 2010).
Mitochondrial Ca2+ also plays a critical role in the regulation of cell death (Hajnoczky et al., 2006; Giorgi et al., 2012; Rimessi et al., 2015). Two requisite events during the early stages of apoptosis are the ER A lower Mcl-1L/S ratio induced mitochondrial hyperfusion in
a Drp1-dependent manner
In humans, mitochondrial fission is highly regulated by Fis1 and Drp1. Drp1 is a member of the dynamin superfamily of proteins; it consists of a GTPase and a GTPase effector domain and has a pre-dominantly cytosolic localization. Drp1 overexpression induces ex-tensive mitochondrial fragmentation, whereas its depletion pro-motes fusion (Smirnova et al., 2001). Thus mitochondrial fusion can originate from either lack of fragmentation or up-regulation of fu-sion proteins.
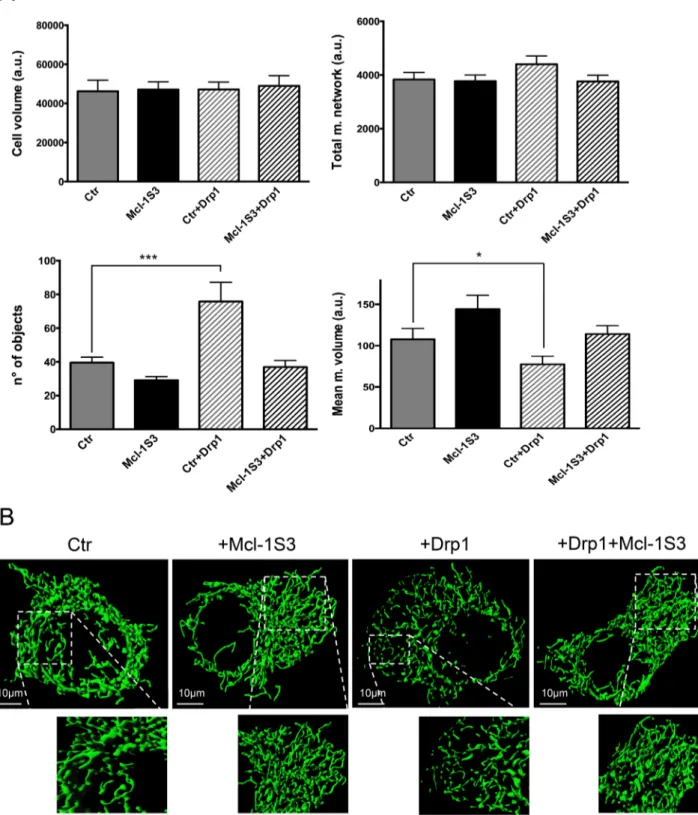
Accordingly, after excluding a possible role for MFN1/2 and OPA1 proteins, we investigated whether the augmented mitochon-drial fusion that was observed upon Mcl-1S3 transfection occurs in a Drp1-dependent manner (Figure 5). To induce mitochondrial fission, we overexpressed wild-type Drp1. Drp1 overexpression promoted mitochondrial fission (Figure 5A, bottom, white bars with gray stripes), which was quantitatively expressed as an increased number of mitochondrial objects and a reduction of the mean volume of a single mitochondrial object. Surprisingly, cotransfection of Mcl-1S3 and Drp1 abolished the fragmentation of the mitochondrial net-work, reestablishing a mitochondrial shape that resembled the con-trol condition.
These data suggested that Drp1 and Mcl-1 are functionally re-lated in the regulation of mitochondrial morphology through a bal-ance between fusion and fission events.
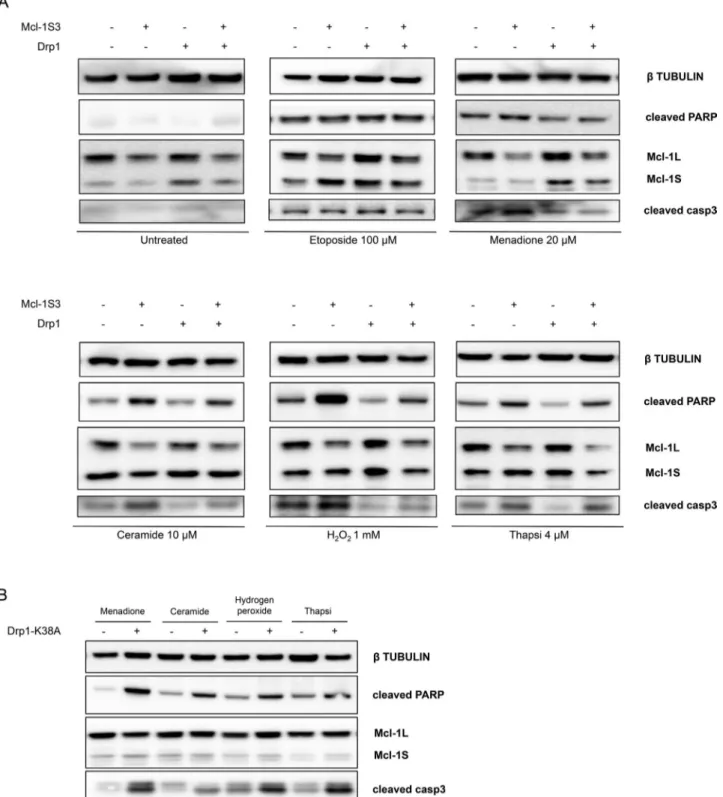
Inhibiting Drp1 activity in the mitochondria promoted apoptotic cell death
To investigate the link between cell death and Drp1/Mcl-1L–driven changes in morphology in our experimental model, we monitored the activation of apoptosis in control and Mcl-1S3–transfected HeLa cells by WB analysis. We subjected these cells to forced fission (by the transfection of wild-type Drp1) and then treated them with apoptotic Ca2+-dependent and Ca2+-independent stimuli as previ-ously described.
As in Figure 2, there was a higher percentage of apoptotic cells after Mcl-1S3 transfection than with the control upon Ca2+ -depen-dent treatments, whereas no apoptosis was detected for any of the conditions lacking apoptotic stimuli (Figure 6A). Of note, fragmenta-tion of the mitochondrial network of control cells by Drp1 overex-pression provided protection from cell death, whereas apoptosis occurred at levels between those of the control and ASO groups when fission was inhibited by down-regulation of Mcl-1L (Figure 6A, lane Mcl-1S3+Drp1). In all conditions concerning down-regulation of Mcl-1L and experimental treatments, no significant changes in Mcl-1S expression were detected. These observations were not seen with etoposide treatment.
In contrast, when the functionality of Drp1 was abolished by the use of its dominant-negative Drp1-K38A, cells with a persistent mi-tochondrial hyperfusion state (Yoon et al., 2001) died, based on PARP and caspase 3 cleavage (Figure 6B).
These final experiments indicated a strong link between changes in mitochondrial morphology driven by Mcl-1L and Drp1 and the intrinsic apoptotic pathway previously described.
Mcl-1: a link between cell cycle and mitochondrial dynamics In a study focused on the link between mitochondrial morphology and cell cycle progression, Mitra et al. (2009) described a greater membrane potential and a massive, hyperfused network state in mi-tochondria at the G1/S transition of the cell cycle. In light of our previous observations of Mcl-1 ASO transfection, which echoed their findings, we proceeded to investigate the Mcl-1 expression
FIGURE 4: The Ψm and morphological changes in the mitochondria of ASO-transfected HeLa cells. (A) Mcl-1S3-treated
HeLa cells had a greater mitochondrial membrane potential than the untreated cells. (B) Western blot analysis to monitor changes in the expression of proteins involved in Ca2+ uptake (MCU), mitochondrial mass (HSP60, ATP5A, VDAC, TIM23, TOM20), and biogenesis (PGC1α). (C, D) Parameters describing the mitochondrial network dynamics
Under our experimental conditions, the higher mitochondrial Ca2+ uptake observed on Mcl-1S3 transfection was certainly due to a significant increment in the mitochondrial membrane potential (Figure 4A). Variation in ΔΨm is a highly sensitive indicator of the
energetic state of mitochondria and is strictly associated with the morphology of the mitochondrial network.
Of interest, when mitochondrial potential was monitored at dif-ferent cell cycle stages, it appeared to be the greatest at G1/S. Nev-ertheless, mitochondria form a giant tubular network in G1/S (Mitra et al., 2009). Accordingly, we observed a shift in the Mcl-1L/S ratio during G1/S phase, with a greater amount of Mcl-1S present
com-pared with the L variant (Figure 7). A higher level of Mcl-1L was de-tected at G0, which coincides with greater mitochondrial
fragmenta-tion (Mitra et al., 2009). Moreover, we also detected a low Mcl-1L/S ratio during mitosis, which is characterized by a high number of tu-bular mitochondria.
These findings suggest a pivotal role of Mcl-1 in the regulation of the fusion and fission dynamics, which occurs in a Drp1-dependent manner. Mcl-1 interacts with Drp1 (Figure 8A). On Mcl-1S3 transfec-tion, Drp1 was unable to induce extensive fragmentation (Figure 5). This finding suggests that the reduction of Mcl-1L at the OMM may prevent the normal physiologic functions of Drp1, producing a per-sistent hyperfused mitochondrial state (Figure 4, C and D) without changes in fusion protein expression (Figure 4E).
Recently a pivotal role for Mcl-1 in regulating fusion/fission dynamics was proposed (Perciavalle et al., 2012; Varadarajan et al., 2013), based on extensive mitochondrial fragmentation upon Mcl-1 down-regulation, which occurred independently of Mcl-1–related apoptosis. These studies used either Mcl-1 defi-cient MEFs (Perciavalle et al., 2012) or pharmacological inhibi-tion (BH3 mimetics) of Mcl-1 expression (Varadarajan et al., 2013). Conversely, our approach was to decrease the Mcl-1L/S ratio, resulting in a hyperfused mitochondrial network and increased sensitivity to apoptosis. Thus, if the inefficient mito-chondrial fusion caused by total Mcl-1 inhibition/depletion is not related to altered susceptibility to cell death, the hyperfused state induced by decreasing the Mcl-1L/S ratio might represent a crucial event for sensitizing mitochondria to a wide range of apoptotic stimuli. Of note, we observed a reduced level of mito-chondrial Drp1 upon Mcl-1S3 transfection (Figure 8C) without any modification in the total endogenous Drp1 level. These data suggested the putative involvement of the fission factor in Mcl-1– dependent mitochondria remodeling, most likely by regulating Drp1 translocation from the cytosol to the OMM. We also ob-served the interaction between Drp1 and Mcl-1, although Drp1 overexpression was required. Of interest, Drp1 seems to coim-munoprecipitate with the long form of Mcl-1, but further work is required to clarify the exact relationship between Mcl-1 and Drp1 shuttling/localization.
Another key conclusion from the present study is the link be-tween mitochondrial morphology and apoptosis. Despite the large quantity of literature available on the topic, the relationship be-tween the two events has not been fully elucidated. In particular, Drp1 is described as both a fundamental inducer of apoptosis release of Ca2+ into the cytosol and the mitochondrial release of
cy-tochrome c. The Ca2+ uptake by the mitochondria determines cell susceptibility to apoptotic stimuli. For example, reduced ER Ca2+ flux toward mitochondria results in resistance to apoptosis (Pinton et al., 2011; Marchi et al., 2012, 2013; Bononi et al., 2013; Giorgi et al., 2015; Patergnani et al., 2015), inhibiting the mitochondrial Ca2+ over-load required for permeability transition pore opening (Bonora et al., 2013a).
Several earlier studies described the role of Mcl-1 in Ca2+ ho-meostasis. Minagawa et al. (2005) showed that Mcl-1 overexpres-sion did not affect IP3 receptor (IP3R) expression or the amount of
Ca2+ contained in ER stores. However, mitochondrial Ca2+ signals were decreased in cells overexpressing Mcl-1
Conversely, Eckenrode et al. (2010) proposed a different activity for Mcl-1 that is quite similar to the molecular mechanism of Bcl-2 function. They reported that Mcl-1 bound with comparable affinity to the C-ter of different IP3R isoforms, with the cells consequently
displaying low ER Ca2+ content and an enhanced rate of IP
3
-medi-ated Ca2+ release. Moreover, Mcl-1 expression enhanced spontane-ous IP3R-dependent Ca2+ oscillations and spiking in intact cells in the absence of agonist stimulation.
The data presented here support a mitochondria-specific func-tion for Mcl-1, with no effect on ER Ca2+ homeostasis (Figure 3A). In contrast to previous studies (Varadarajan et al., 2013), we used an antisense oligonucleotide approach to modulate mRNA splicing rather than direct overexpression, silencing, or antagonism of the protein to investigate Mcl-1 functional features.
Because of the high therapeutic potential of ASOs, especially in combination with cytotoxic agents (Wacheck et al., 2006; Skoda et al., 2008), we opted for splice-switching antisense technology to modu-late the balance between the different variants of Mcl-1. To guarantee high gene specificity for Mcl-1 pre-mRNA and reduce potential off-target toxic effects, we designed a novel Mcl-1S3 sc-ASO that off-targets an ESE within exon 2 (Figure 1D) and were able to successfully induce exon skipping, which permitted an appreciable and dose-dependent increase in Mcl-1S expression (Figure 1E). Of most importance, this effect was associated with an extensive induction of cell death through the mitochondrial intrinsic apoptotic pathway (Figure 2), which further supports the role of Mcl-1 pre-mRNA AS as a target for the develop-ment of anticancer therapies. It is worth noting that intervention at the pre-mRNA level would maintain the transcriptional regulation and absolute levels of Mcl-1 pre-mRNA, thus selectively decreasing the long/short isoform ratio, which has proapoptotic effects. In cells over-expressing the Mcl-1L pre-mRNA in a manner similar to tumors, the splice-switching strategy would result in a marked increase in the Mcl-1S form, thus magnifying the proapoptotic effect compared with the generic silencing of Mcl-1L expression.
Using Mcl-1S3, we showed that the shift in the Mcl-1L/S ratio resulted in increased mitochondrial Ca2+ levels after agonist addi-tion without affecting its baseline content (Figure 3B) or the Ca2+ homeostasis of other subcellular organelles. These data suggest that the lower Mcl-1L/S ratio affects mitochondrial Ca2+ uptake only when the cytosolic [Ca2+] rapidly increases (i.e., upon Ca2+ -depen-dent apoptotic stimuli).
shown in histograms (top) and confocal images (bottom). Black bars indicate Mcl-1S3–transfected HeLa (C) and SH-SY5Y (D) cells; a decrease in number of objects and an increase in mean mitochondrial volume are evidence of hyperfused mitochondria. Significant differences, *p < 0.05, **p < 0.01, and ***p < 0.001. a.u., arbitrary units. (E) Mitochondrial fusion proteins were investigated by Western blot with MFN1/2 and OPA1 antibodies in both experimental conditions. N = 3 for each experiment.
findings are further supported by a recent study (Westrate et al., 2014) showing that persistent mitochondrial fusion leads to robust caspase-dependent cell death.
(Frank et al., 2001) and an inhibitor of Ca2+-dependent apoptosis (Szabadkai et al., 2004). The model presented here is more consis-tent with the latter functionality (Szabadkai et al., 2004), and our
FIGURE 5: Mcl-1L involvement in mitochondrial dynamics is Drp1 dependent. (A) Analysis of mitochondrial morphology under four experimental conditions. No significant differences were detected in cell volume or total mitochondrial network (top). Drp1 overexpression promoted extensive fragmentation, as shown by the increased number of objects and the reduction of mean mitochondrial volume (bottom, white bars with gray stripes). Cotransfection of Mcl-1S3 and Drp1 reversed the effect of Drp1 overexpression alone, suggesting an association between Mcl-1L and Drp1 in the regulation of mitochondrial dynamics. Significant differences, *p < 0.05 and ***p < 0.001. a.u., arbitrary units. (B) Representative confocal images of mitochondrial networks (green fluorescence) under each condition. N = 3 for each experiment.
by Mcl-1S3 transfection and as shown with regard to BAX-depen-dent MOMP failure when mitochondria are fragmented (Renault et al., 2014). The same effect was also confirmed with the dominant-negative form Drp1-K38A (Yoon et al., 2001) in all experimental In contrast to the current opinion that mitochondrial
fragmenta-tion is associated with apoptosis, our data indicate that apoptosis can also occur when mitochondria are hyperfused, as shown in Figure 6A, upon the inhibition of Drp1 activity in the mitochondria
FIGURE 6: Inhibition of Drp1 activity in the mitochondria restored apoptotic cell death. (A) Apoptosis assessment upon treatment with Ca2+-dependent and Ca2+-independent apoptotic stimuli detected by Western blot analysis of cleaved PARP and cleaved caspase 3. Control and Mcl-1S3-transfected HeLa cells were first cotransfected with a wt Drp1 construct (as described in morphology experiments) and then divided into six conditions: untreated (with culture medium exchange), 100 μM etoposide for 3 h, 20 μM menadione for 2 h, 10 μM ceramide for 2 h, 1 mM hydrogen peroxide for 1 h, and 4 μM thapsigargin for 2 h. (B) Overexpression of the dominant-negative Drp1-K38A promotes mitochondrial fusion and widespread cell death. N = 3 for each experiment.
conditions (Figure 6B). An intact mitochondrial network could en-sure rapid propagation of Ca2+ through the mitochondrial matrix to promptly trigger apoptosis. Of note, we obtained a similar result when Mcl-1L was down-regulated by Mcl-1S3, thus avoiding Drp1 activity at the OMM. However, if Drp1 is free to act at the mitochon-dria, fragmentation could inhibit the propagation of the apoptotic wave, limiting the harmful effects caused by treatment.
In this scenario, Ca2+ signaling behaves as the primary initiator of cell death, and accordingly, the pharmacological inhibition of MCU by KB-R7943 (Figure 3C) protected cells from the therapeutic effects of Mcl-1S3 (Figure 3D).
Taken together, these data suggest that redirecting Mcl-1 syn-thesis from the antiapoptotic L variant to the proapoptotic S variant might represent a novel strategy for anticancer therapies.
MATERIALS AND METHODS Reagents and solutions
All reagents were purchased from Sigma-Aldrich (St. Louis, MO), Thermo Scientific (Waltham, MA), and Santa Cruz Biotechnology (Dallas, TX).
Cell culture and transient transfection
HeLa cells were grown in DMEM and SH-SY5Y cells in RPMI 1640, both supplemented with 10% fetal bovine serum (FBS), in 75-cm2 FIGURE 7: Mcl-1 links cell cycle regulation and mitochondrial
dynamics. Mcl-1L and Mcl-1S expression levels are shown in different phases of the T98G cell cycle. Cells were synchronized by double-thymidine block and assayed at each phase of the cell cycle (top). Proteins of interest are shown on the right. Skp1 was used as a loading control. Other markers: cyclin A for S and M phases; cyclin B for the G2/M checkpoint; p27 for quiescent cells; and pHH3 for
mitotic activity. The red rectangle indicates Mcl-1L and Mcl-1S expression in G1/S phase. N = 2.
FIGURE 8: Subcellular localization of Drp1, Mcl-1L/Mcl-1S, and their interactions. Coimmunoprecipitation of Mcl-1L and Drp1 in HeLa cells. (A) Immunoprecipitation (IP) was performed in control (in absence of antibody), with rabbit anti–Mcl-1 antibody, and in a reverse IP mode with rabbit anti-Drpanti–Mcl-1 antibody followed by immunoblotting with anti–Mcl-anti–Mcl-1 and anti-Drp1 antibodies. Input lysates as well as flowthrough after the IPs are shown. (B) Subcellular localization of Drp1, Mcl-1L, and Mcl-1S as determined by fine fractionation. IP3R3, β-tubulin, panVDAC, and sigmaR1 were used as markers
of ER, cytosol, mitochondria, and MAM, respectively. H, homogenate; Mc, crude mitochondria; MP, pure mitochondria;
ER, endoplasmic reticulum; MAM, mitochondria-associated membranes; C, cytosol. (C) Induction of Drp1 translocation from cytosol to mitochondria upon Drp1 overexpression in control and Mcl-1S3–transfected cells. Protein localization and expression were evaluated under each condition by WB after digitonin-based fractionation. N = 3 (for each experiment).
(1100 rpm, 5 min, +4°C), resuspended, and homogenized (EBC buffer with protease/phosphatase inhibitor cocktail, pH 7.4). Pro-teins were separated by SDS–PAGE on a 4–12% precast gel, and the levels of cleaved PARP (89 kDa), β-tubulin (50 kDa), and cleaved caspase 3 (17 kDa) were estimated by WB using polyclonal rabbit anti-PARP (1:1000), polyclonal rabbit anti-caspase 3 (1:1000), and monoclonal mouse anti–β-tubulin (1:5000) primary antibodies ac-cording to standard protocols. Antibodies were purchased from Cell Signaling and Sigma-Aldrich. Nitrocellulose membranes were incubated with appropriate HRP-conjugated secondary antibodies (1:5000; Santa Cruz Biotechnology), and protein bands were then visualized by chemiluminescence.
For annexin V staining, HeLa cells were plated onto 35-mm-well plates. After transfection of ASOs and treatment with Ca2+ -depen-dent apoptotic stimuli, cells were gently harvested, processed with buffers, and incubated with annexin V according to manufacturer’s protocols (BioVision). The green fluorescence signal was quantified under all conditions on a Tali image-based cytometer.
Aequorin measurement
For cytAEQ and mtAEQmut at 24 h posttransfection, the coverslips were incubated with 5 μM coelenterazine for 1.5 h in Krebs–Ringer modified buffer (KRB; 125 mM NaCl, 5 mM KCl, 1 mM Na3PO4,
1 mM MgSO4, 5.5 mM glucose, and 20 mM 4-(2-hydroxyethyl)-1-piperazineethanesulfonic acid [HEPES], pH 7.4, at 37°C) supple-mented with 1 mM CaCl2. To reconstitute erAEQ with high effi-ciency, the luminal [Ca2+] of the ER was first reduced by incubating the cells for 45 min at 4°C in KRB supplemented with 5 μM coelen-terazine, the Ca2+ ionophore ionomycin, and 600 μM ethylene glycol tetraacetic acid (EGTA). After incubation, the cells were extensively washed with KRB supplemented with 2% bovine serum albumin and 2 mM EGTA before the luminescence measurement was initiated. Aequorin signals were measured in KRB supplemented with either 1 mM CaCl2 or 100 μM EGTA, using a purpose-built luminometer. The agonist (histamine at 100 μM) was added to the same medium. The experiments were terminated by lysing the cells with Triton X-100 in a hypotonic Ca2+-rich solution (10 mM CaCl
2 in H2O), thus
discharging the remaining aequorin pool. The light signals were collected and calibrated with [Ca2+] values. Further experimental details were previously described (Bonora et al., 2013b).
Mitochondrial Ca2+ concentration measurements with
2mt-GCaMP6m
To test resting mitochondrial Ca2+ concentrations with high sensitiv-ity, we used a new Ca2+ probe based on the last-generation GCaMP probe (Chen et al., 2013) targeted to the mitochondrial matrix. We chose the GCaMP6m version because it had the highest Ca2+ affin-ity. To measure the signal independent of variations in basal fluores-cence intensity due to the variable expression levels of the probe, we took advantage of the isosbestic point in the GCaMP6m excita-tion spectrum; exciting GCaMP6m at 406 nm led to fluorescence emission that was not Ca2+ dependent. As a consequence, the ratio between the excitation wavelengths of 494 and 406 nm was propor-tional to the Ca2+ concentration and independent of probe expres-sion levels. Cells were imaged with an IX-81 automated epifluores-cence microscope (Olympus) equipped with a 40× oil immersion objective (numerical aperture 1.35; Olympus) and an ORCA-R2 charge-coupled device camera (Hamamatsu Photonics).
Microscopic analysis
Mitochondrial morphology was assessed under four conditions: control, Mcl-1S3, control plus Drp1, and Mcl-1S3 plus Drp1. Under Corning flasks. All cells were maintained at 37°C and 90% relative
humidity in 5% CO2. Before transfection, cells were seeded onto 13-mm glass coverslips for intracellular Ca2+ measurements and onto 24-mm glass coverslips for microscopic analysis. Next plasmid trans-fections (see later description) with Lipofectamine 2000 were per-formed. All experiments were performed 24 h after transfection.
In experiments involving KB-R7943, for Ca2+ measurements and apoptosis, cells were pretreated for 15 min with 10 μM KB-R7943 in complete medium.
Primers for RT-PCR
Oligonucleotides for RT-PCR were created online (Primer3) using the human Mcl-1 sequence from the National Center for Biotechnol-ogy Information database as a template. The primer sequences are as follows: forward (5′-3′), GAGGAGGAGGAGGACGAGTT (Mcl-1 Ex1F1); reverse (5′-3′), TCCTCTTGCCACTTGCTTTT (Mcl-1 Ex3r1).
All PCR products were separated by 2% agarose gel electropho-resis and visualized with ethidium bromide. The expected sizes were 689 base pairs for Mcl-1L and 441 base pairs for Mcl-1S.
mRNA splicing pattern and protein expression of Mcl-1 HeLa cells were plated onto 35-mm plates. After transfection, total RNA was extracted using the phenol/chloroform method. All steps were performed at 4°C. RNA was quantified with a NanoDrop ND-1000, and protein/solvent contaminations were evaluated (A260/280
= 1.8 and A260/230 = 2.0). RNA was converted to cDNA and
ampli-fied using the Mcl-1 primers via RT-PCR (SuperScript III one-step RT-PCR system with Platinum Taq DNA polymerase; Invitrogen).
Proteins were separated by SDS–PAGE on a 4–12% precast gel and detected by Western blotting using polyclonal rabbit anti-Mcl-1 (1:500) for both the L (40 kDa) and S (32 kDa) isoforms (Santa Cruz Biotechnology) and monoclonal mouse anti–β-tubulin (1:5000; Sigma-Aldrich) as the primary antibodies and respective horseradish peroxidase (HRP)–labeled secondary antibodies (1:5000), according to standard protocols.
Inhibition of proteasomal degradation
HeLa cells were plated onto 35-mm-well plates for a time-lapse ex-periment. Twenty-four hours after plating, cells were treated with 10 μM MG132 (dissolved in dimethyl sulfoxide [DMSO]) for 3, 6, 9, and 12 h. The control cells were treated with DMSO alone. Mcl-1 expres-sion was then detected by Western blotting as described previously. Design of ASOs
ASOs were synthesized in collaboration with Daniela Perrone and coworkers at the Department of Chemical and Pharmaceutical Sci-ences, University of Ferrara (Ferrara, Italy). The putative ESE in Mcl-1 exon 2 was identified using ESEfinder (rulai.cshl.edu/tools/ESE2/), and the secondary structures of the sc-ASOs were analyzed using Sfold (sfold.wadsworth.org/cgi-bin/index.pl). The sc-ASOs were de-signed and then chemically synthesized to contain 2′-O-methyl– modified RNA and a full-length phosphorothioate backbone.
The oligonucleotide sequences were as follows: Mcl-1S3 (5′-3′), AACGUCUGUGAUACUUUCUGCUAAU; and scramble (5′-3′), AUUAUGCUUUUGACCCGAUUAAUCG.
Apoptosis assessment
For WB, HeLa cells were plated onto 35-mm-well plates. After transfection of ASOs and treatment with Ca2+-dependent (20 μM menadione for 2 h; 10 μM ceramide for 2 h; 1 mM H2O2 for 1 h, 4 μM thapsigargin for 2 h) or Ca2+-independent (100 μM etopo-side for 3 h) apoptotic stimuli, cells were trypsinized, pelleted
centrifuged at 20,000 × g for 30 min at 4°C. This pellet consisted of the lysosomal and plasma membrane fractions. Further centrifuga-tion of the obtained supernatant at 100,000 × g for 90 min (70-Ti rotor; Beckman, Milan, Italy) at 4°C resulted in the isolation of the ER (pellet) and cytosolic (supernatant) fractions. The crude mitochon-drial fraction was resuspended in isolation buffer (250 mM mannitol, 5 mM HEPES, pH 7.4, and 0.5 mM EGTA) and then subjected to Percoll gradient centrifugation (Percoll medium: 225 mM mannitol, 25 mM HEPES, pH 7.4, 1 mM EGTA, and 30% [vol/vol] Percoll) in a 10-ml polycarbonate ultracentrifuge tube. After centrifugation at 95,000 × g for 30 min (SW40 rotor), a dense band containing puri-fied mitochondria was recovered approximately three-fourths of the way down the tube. This was then washed by centrifugation at 6300 × g for 10 min to remove the Percoll and finally resuspended in isolation medium. The mitochondrial-associated membranes (MAMs), which contain the structural contacts between the mito-chondria and the ER, were removed from the Percoll gradient as a diffuse white band located above the mitochondria, diluted in isola-tion buffer, and centrifuged at 6300 × g for 10 min. The supernatant was further centrifuged at 100,000 × g for 90 min (70-Ti rotor) to pellet the MAM fraction. When preservation of protein phosphoryla-tion states was required, 2 mM Na3VO4 and 2 mM NaF were added to each fraction immediately after recovery.
Analysis of protein localization using a digitonin-based fractionation technique
Twenty-four hours posttransfection, confluent HeLa cells were tryp-sinized and harvested in cold PBS, pH 7.4, centrifuged at 750 × g for 5 min, washed in PBS, and permeabilized with digitonin for 20 min on ice after resuspension of the cell pellet in 200 μl of buffer I (150 mM NaCl, 50 mM HEPES, pH 7.4, 100 μg/ml digitonin) supplemented with protease and phosphatase inhibitors. After in-cubation on ice, plasma membrane permeabilization of cells was confirmed by staining with a 0.2% trypan blue solution. Cells were then centrifuged at 2000 × g for 5 min. The supernatants (cytosolic fractions) were saved, and the pellets were washed, solubilized in the same volume of buffer II (150 mM NaCl, 50 mM HEPES, pH 7.4, 1% NP-40) supplemented with complete protease inhibitor cock-tail, vortexed, and incubated for 30 min on ice. After centrifugation at 7000 × g for 5 min to pellet nuclei and debris, the supernatants were kept as the heavy membrane fractions enriched for mitochon-dria. All steps were performed at 4°C. The soluble and heavy mem-brane fractions were separated by SDS–PAGE (4–12%) and trans-ferred to a nitrocellulose membrane. After blocking nonspecific sites for 1 h at room temperature with 2.5% nonfat milk in PBS supplemented with 0.1% Tween-20, the nitrocellulose membranes were incubated overnight at 4°C with rabbit anti–Drp-1 (1:1000; Cell Signaling), rabbit anti-Mcl-1 (1:500; Santa Cruz Biotechnology), or β-tubulin (1:5000; Sigma-Aldrich) as a loading control. The im-munoreactive proteins were then visualized using HRP-conjugated goat anti-mouse or anti-rabbit antibodies (1:5000) and enhanced chemiluminescence.
Immunoprecipitation
Cells were lysed in 3-[(3-cholamidopropyl)dimethylammonio]-1-propanesulfonate–based lysis buffer. Whole-cell lysates were ob-tained, precleared with protein A–Sepharose, and then incubated overnight with a 1:100 dilution of the specific antibody anti-Mcl-1. The immunocomplexes were captured with protein A. Beads were pelleted, washed three times, and boiled in SDS sample buffer. For the reverse immunoprecipitation, Drp1 was overexpressed in HeLa cells, and the antibody was cross-linked to protein A–agarose by each condition, cells were transfected with 1 μg of mtDSred
(excitation/emission: 556/586 nm) and stained with 1 μM calcein (excitation/emission: 495/515 cm) for 10 min at 37°C to mark the mitochondria and to normalize for cell volume.
The Ψm was assessed under two conditions: control and
Mcl-1S3. Under each condition, cells were incubated with 10 nM TMRM (excitation/emission: 548/573 nm) for 20 min at 37°C. Steady-state and poststimulation (FCCP 10 μM) dye intensities were quantified.
All of the experiments were performed on a confocal Nikon Eclipse Ti system. Fluorescent images were captured and analyzed using NisElements 3.2 for membrane potential and Imaris 4.0 soft-ware for morphology. To improve image resolution, Z-series acquisi-tions were deconvolved using Huygens Essential 3.3 software. Mitochondrial mass and biogenesis
Control and Mcl-1S3–transfected HeLa cells were harvested, washed, and pelleted (1100 rpm, 5 min, +4°C) in phosphate-buff-ered saline (PBS), resuspended in RIPA buffer supplemented with protease and phosphatase inhibitor cocktail (pH 7.4), and homoge-nized. After measurement of the concentrations, proteins were sep-arated by SDS–PAGE on a 4–12% precast gel, and the levels of two protein markers for each mitochondrial compartment were detected using the primary antibodies rabbit anti-VDAC (1:2500, 31 kDa) and anti-TOM20 (1:5000, 20 kDa) for OMM, rabbit anti-MCU (1:2000, 35 kDa) and mouse anti-TIM23 (1:5000, 23 kDa) for IMM, and mouse anti-HSP60 (1:5000, 60 kDa) and anti-ATP5A (1:5000, 55 kDa) for matrix. Anti–β-tubulin (1:5000, 50 kDa) was included as a loading control. After overnight incubation, the nitrocellulose membranes were incubated with appropriate HRP-conjugated secondary anti-bodies (1:5000; Santa Cruz Biotechnology), and the proteins were visualized by chemiluminescence. Similarly, for the evaluation of biogenesis, anti-PGC1α antibody (1:1000, 113 kDa) was used. The expression of fusion proteins was detected by anti-MFN1 (1:1000, 60 and 86 kDa), anti-MFN2 (1:1000, 90 kDa), and anti-OPA1 (1:1000, 88 and 93 kDa for major isoforms).
Cell cycle synchronization
T98G cells were synchronized using a double-thymidine block. Briefly, T98G cells in a 100 × 20 mm Petri dish were treated with 2 mM thymidine (Sigma-Aldrich) for 16 h. The cells were washed once in fresh medium to remove the thymidine and then incubated in fresh complete medium. After 6 h, 2 mM thymidine was added again, and the cells were incubated for an additional 16 h. After the second thymidine treatment, the cells were washed and resus-pended in fresh complete medium. Cell cycle progression was stud-ied at 2-h intervals using phase-specific markers: cyclin A for the S and M phases; cyclin B for the G2/M checkpoint; p27 for the G0
cells; and pHH3 for mitotic activity. Skp1 was used as a loading control.
Subcellular fractionation
Cell fractionation was performed using HeLa cells as described (Wieckowski et al., 2009). Cells (109) were harvested, washed with PBS (supplemented with 2 mM Na3VO4 and 2 mM NaF when the preservation of protein phosphorylation states was required) by cen-trifugation at 500 × g for 5 min, resuspended in homogenization buffer (225 mM mannitol, 75 mM sucrose, 30 mM Tris-HCl, pH 7.4, 0.1 mM EGTA, and phenylmethylsulfonyl fluoride), and gently dis-rupted by Dounce homogenization. The homogenate was centri-fuged twice at 600 × g for 5 min to remove nuclei and unbroken cells, and the supernatant was then centrifuged at 10,300 × g for 10 min to pellet crude mitochondria. The resultant supernatant was
or Bcl-x(L) is an essential survival protein of human myeloma cells. Blood 100, 194–199.
Eckenrode EF, Yang J, Velmurugan GV, Foskett JK, White C (2010). Apop-tosis protection by Mcl-1 and Bcl-2 modulation of inositol 1,4,5-tri-sphosphate receptor-dependent Ca2+ signaling. J Biol Chem 285, 13678–13684.
Fesik SW (2005). Promoting apoptosis as a strategy for cancer drug discov-ery. Nat Rev Cancer 5, 876–885.
Frank S, Gaume B, Bergmann-Leitner ES, Leitner WW, Robert EG, Catez F, Smith CL, Youle RJ (2001). The role of dynamin-related protein 1, a mediator of mitochondrial fission, in apoptosis. Dev Cell 1, 515–525. Frezza C, Cipolat S, Martins de Brito O, Micaroni M, Beznoussenko GV,
Rudka T, Bartoli D, Polishuck RS, Danial NN, De Strooper B, Scorrano L (2006). OPA1 controls apoptotic cristae remodeling independently from mitochondrial fusion. Cell 126, 177–189.
Galluzzi L, Bravo-San Pedro JM, Vitale I, Aaronson SA, Abrams JM, Adam D, Alnemri ES, Altucci L, Andrews D, Annicchiarico-Petruzzelli M, et al. (2015). Essential versus accessory aspects of cell death: recommenda-tions of the NCCD 2015. Cell Death Differ 22, 58–73.
Giorgi C, Baldassari F, Bononi A, Bonora M, De Marchi E, Marchi S, Missiroli S, Patergnani S, Rimessi A, Suski JM, et al. (2012). Mitochondrial Ca(2+) and apoptosis. Cell Calcium 52, 36–43.
Giorgi C, Bonora M, Sorrentino G, Missiroli S, Poletti F, Suski JM, Galindo Ramirez F, Rizzuto R, Di Virgilio F, Zito E, et al. (2015). p53 at the endo-plasmic reticulum regulates apoptosis in a Ca2+-dependent manner. Proc Natl Acad Sci USA 112, 1779–1784.
Gleave ME, Monia BP (2005). Antisense therapy for cancer. Nat Rev Cancer 5, 468–479.
Gunter TE, Pfeiffer DR (1990). Mechanisms by which mitochondria transport calcium. Am J Physiol 258, C755–786.
Hackenbrock CR (1966). Ultrastructural bases for metabolically linked mechanical activity in mitochondria. I. Reversible ultrastructural changes with change in metabolic steady state in isolated liver mitochondria. J Cell Biol 30, 269–297.
Hadaschik BA, Jackson J, Fazli L, Zoubeidi A, Burt HM, Gleave ME, So AI (2008). Intravesically administered antisense oligonucleotides targeting heat-shock protein-27 inhibit the growth of non-muscle-invasive bladder cancer. BJU Int 102, 610–616.
Hajnoczky G, Csordas G, Das S, Garcia-Perez C, Saotome M, Sinha Roy S, Yi M (2006). Mitochondrial calcium signalling and cell death: approaches for assessing the role of mitochondrial Ca2+ uptake in apoptosis. Cell Calcium 40, 553–560.
Hanada M, Delia D, Aiello A, Stadtmauer E, Reed JC (1993). bcl-2 gene hypomethylation and high-level expression in B-cell chronic lymphocytic leukemia. Blood 82, 1820–1828.
Hardwick JM, Youle RJ (2009). SnapShot: BCL-2 proteins. Cell 138, 404. Hershko A, Ciechanover A (1998). The ubiquitin system. Annu Rev Biochem
67, 425–479.
James DI, Parone PA, Mattenberger Y, Martinou JC (2003). hFis1, a novel component of the mammalian mitochondrial fission machinery. J Biol Chem 278, 36373–36379.
Kelekar A, Thompson CB (1998). Bcl-2-family proteins: the role of the BH3 domain in apoptosis. Trends Cell Biol 8, 324–330.
Khoury JD, Medeiros LJ, Rassidakis GZ, McDonnell TJ, Abruzzo LV, Lai R (2003). Expression of Mcl-1 in mantle cell lymphoma is associated with high-grade morphology, a high proliferative state, and p53 overexpres-sion. J Pathol 199, 90–97.
Kim DW, Kim JH, Park M, Yeom JH, Go H, Kim S, Han MS, Lee K, Bae J (2011). Modulation of biological processes in the nucleus by delivery of DNA oligonucleotides conjugated with gold nanoparticles. Biomaterials 32, 2593–2604.
Kim JH, Sim SH, Ha HJ, Ko JJ, Lee K, Bae J (2009). MCL-1ES, a novel vari-ant of MCL-1, associates with MCL-1L and induces mitochondrial cell death. FEBS Lett 583, 2758–2764.
Koo T, Wood MJ (2013). Clinical trials using antisense oligonucleotides in duchenne muscular dystrophy. Hum Gene Ther 24, 479–488. Kozopas KM, Yang T, Buchan HL, Zhou P, Craig RW (1993). MCL1, a gene
expressed in programmed myeloid cell differentiation, has sequence similarity to BCL2. Proc Natl Acad Sci USA 90, 3516–3520.
Kuwana T, Bouchier-Hayes L, Chipuk JE, Bonzon C, Sullivan BA, Green DR, Newmeyer DD (2005). BH3 domains of BH3-only proteins differentially regulate Bax-mediated mitochondrial membrane permeabilization both directly and indirectly. Mol Cell 17, 525–535.
Kuwana T, Newmeyer DD (2003). Bcl-2-family proteins and the role of mito-chondria in apoptosis. Curr Opin Cell Biol 15, 691–699.
25 mM dimethyl pimelimidate. The presence of immune complexes was determined by Western blot analysis.
Statistical analysis and gel quantification
Statistical analysis was performed using Student’s t test; p < 0.05 was considered significant. All data are reported as means ± SEs.
Quantification of Western blots was performed with ImageJ (National Institutes of Health, Bethesda, MD) to compare the den-sity of bands on a gel.
ACKNOWLEDGMENTS
We thank Elena Marchesi and Lara Mari for excellent technical assis-tance with ASO synthesis and Gaia Pedriali for her help in performing experiments. P.P. is grateful to Camilla degli Scrovegni for continuous support. This work was funded by the Italian Association for Cancer Research (IG-14442 and MFAG-13521) and local funds from the University of Ferrara to P.P. and C.G. and Telethon (GGP11139B), the Italian Ministry of Health, and the Italian Ministry of Education, Univer-sity and Research (COFIN 20129JLHSY_002, FIRB RBAP11FXBC_002, and Futuro in Ricerca RBFR10EGVP_001) to P.P.
REFERENCES
Akl H, Vervloessem T, Kiviluoto S, Bittremieux M, Parys JB, De Smedt H, Bultynck G (2014). A dual role for the anti-apoptotic Bcl-2 protein in cancer: mitochondria versus endoplasmic reticulum. Biochim Biophys Acta 1843, 2240–2252.
Bae J, Leo CP, Hsu SY, Hsueh AJ (2000). MCL-1S, a splicing variant of the antiapoptotic BCL-2 family member MCL-1, encodes a proapoptotic protein possessing only the BH3 domain. J Biol Chem 275, 25255– 25261.
Bauman JA, Li SD, Yang A, Huang L, Kole R (2010). Anti-tumor activity of splice-switching oligonucleotides. Nucleic Acids Res 38, 8348–8356. Bereiter-Hahn J, Voth M (1994). Dynamics of mitochondria in living cells:
shape changes, dislocations, fusion, and fission of mitochondria. Microsc Res Tech 27, 198–219.
Bingle CD, Craig RW, Swales BM, Singleton V, Zhou P, Whyte MK (2000). Exon skipping in Mcl-1 results in a bcl-2 homology domain 3 only gene product that promotes cell death. J Biol Chem 275, 22136–22146. Boise LH, Gottschalk AR, Quintans J, Thompson CB (1995). 2 and
Bcl-2-related proteins in apoptosis regulation. Curr Top Microbiol Immunol 200, 107–121.
Bononi A, Bonora M, Marchi S, Missiroli S, Poletti F, Giorgi C, Pandolfi PP, Pinton P (2013). Identification of PTEN at the ER and MAMs and its regulation of Ca(2+) signaling and apoptosis in a protein phosphatase-dependent manner. Cell Death Differ 20, 1631–1643.
Bonora M, Bononi A, De Marchi E, Giorgi C, Lebiedzinska M, Marchi S, Patergnani S, Rimessi A, Suski JM, Wojtala A, et al. (2013a). Role of the c subunit of the FO ATP synthase in mitochondrial permeability transition. Cell Cycle 12, 674–683.
Bonora M, Giorgi C, Bononi A, Marchi S, Patergnani S, Rimessi A, Rizzuto R, Pinton P (2013b). Subcellular calcium measurements in mammalian cells using jellyfish photoprotein aequorin-based probes. Nat Protoc 8, 2105–2118.
Chao JR, Wang JM, Lee SF, Peng HW, Lin YH, Chou CH, Li JC, Huang HM, Chou CK, Kuo ML, et al. (1998). mcl-1 is an immediate-early gene acti-vated by the granulocyte-macrophage colony-stimulating factor (GM-CSF) signaling pathway and is one component of the GM-CSF viability response. Mol Cell Biol 18, 4883–4898.
Chen H, Chomyn A, Chan DC (2005). Disruption of fusion results in mito-chondrial heterogeneity and dysfunction. J Biol Chem 280, 26185–26192. Chen TW, Wardill TJ, Sun Y, Pulver SR, Renninger SL, Baohan A, Schreiter
ER, Kerr RA, Orger MB, Jayaraman V, et al. (2013). Ultrasensitive fluores-cent proteins for imaging neuronal activity. Nature 499, 295–300. Clohessy JG, Zhuang J, de Boer J, Gil-Gomez G, Brady HJ (2006). Mcl-1
interacts with truncated Bid and inhibits its induction of cytochrome c release and its role in receptor-mediated apoptosis. J Biol Chem 281, 5750–5759.
Derenne S, Monia B, Dean NM, Taylor JK, Rapp MJ, Harousseau JL, Bataille R, Amiot M (2002). Antisense strategy shows that Mcl-1 rather than Bcl-2
Marchi S, Lupini L, Patergnani S, Rimessi A, Missiroli S, Bonora M, Bononi A, Corra F, Giorgi C, De Marchi E, et al. (2013). Downregulation of the mito-chondrial calcium uniporter by cancer-related miR-25. Curr Biol 23, 58–63. Marchi S, Marinello M, Bononi A, Bonora M, Giorgi C, Rimessi A, Pinton P
(2012). Selective modulation of subtype III IP(3)R by Akt regulates ER Ca(2)(+) release and apoptosis. Cell Death Dis 3, e304.
Marchi S, Patergnani S, Pinton P (2014). The endoplasmic reticulum-mito-chondria connection: one touch, multiple functions. Biochim Biophys Acta 1837, 461–469.
Marchi S, Pinton P (2014). The mitochondrial calcium uniporter complex: molecular components, structure and physiopathological implications. J Physiol 592, 829–839.
Maurer U, Charvet C, Wagman AS, Dejardin E, Green DR (2006). Glycogen synthase kinase-3 regulates mitochondrial outer membrane permeabili-zation and apoptosis by destabilipermeabili-zation of MCL-1. Mol Cell 21, 749–760. Minagawa N, Kruglov EA, Dranoff JA, Robert ME, Gores GJ, Nathanson MH
(2005). The anti-apoptotic protein Mcl-1 inhibits mitochondrial Ca2+ signals. J Biol Chem 280, 33637–33644.
Mitra K, Wunder C, Roysam B, Lin G, Lippincott-Schwartz J (2009). A hyper-fused mitochondrial state achieved at G1-S regulates cyclin E buildup and entry into S phase. Proc Natl Acad Sci USA 106, 11960–11965. Opferman JT, Letai A, Beard C, Sorcinelli MD, Ong CC, Korsmeyer SJ
(2003). Development and maintenance of B and T lymphocytes requires antiapoptotic MCL-1. Nature 426, 671–676.
Patergnani S, Giorgi C, Maniero S, Missiroli S, Maniscalco P, Bononi I, Martini F, Cavallesco G, Tognon M, Pinton P (2015). The endoplasmic re-ticulum mitochondrial calcium cross talk is downregulated in malignant pleural mesothelioma cells and plays a critical role in apoptosis inhibi-tion. Oncotarget 6, 23427–23444.
Perciavalle RM, Opferman JT (2013). Delving deeper: MCL-1’s contributions to normal and cancer biology. Trends Cell Biol 23, 22–29.
Perciavalle RM, Stewart DP, Koss B, Lynch J, Milasta S, Bathina M, Temirov J, Cleland MM, Pelletier S, Schuetz JD, et al. (2012). Anti-apoptotic MCL-1 localizes to the mitochondrial matrix and couples mitochondrial fusion to respiration. Nat Cell Biol 14, 575–583.
Pinton P, Giorgi C, Pandolfi PP (2011). The role of PML in the control of apoptotic cell fate: a new key player at ER-mitochondria sites. Cell Death Differ 18, 1450–1456.
Placzek WJ, Wei J, Kitada S, Zhai D, Reed JC, Pellecchia M (2010). A survey of the anti-apoptotic Bcl-2 subfamily expression in cancer types provides a platform to predict the efficacy of Bcl-2 antagonists in cancer therapy. Cell Death Dis 1, e40.
Renault TT, Floros KV, Elkholi R, Corrigan KA, Kushnareva Y, Wieder SY, Lindtner C, Serasinghe MN, Asciolla JJ, Buettner C, et al. (2014). Mito-chondrial shape governs BAX-induced membrane permeabilization and apoptosis. Mol Cell 57, 69–82.
Rimessi A, Patergnani S, Bonora M, Wieckowski MR, Pinton P (2015). Mi-tochondrial Ca(2+) remodeling is a prime factor in oncogenic behavior. Front Oncol 5, 143.
Scarpa A, Azzone GF (1970). The mechanism of ion translocation in mito-chondria. 4. Coupling of K+ efflux with Ca2+ uptake. Eur J Biochem 12, 328–335.
Scheckhuber C (2005). Mitochondrial dynamics in cell life and death. Sci Ag-ing Knowledge Environ 2005, pe36.
Scorrano L (2013). Keeping mitochondria in shape: a matter of life and death. Eur J Clin Invest 43, 886–893.
Shieh JJ, Liu KT, Huang SW, Chen YJ, Hsieh TY (2009). Modification of alternative splicing of Mcl-1 pre-mRNA using antisense morpholino oligonucleotides induces apoptosis in basal cell carcinoma cells. J Invest Dermatol 129, 2497–2506.
Shin HW, Shinotsuka C, Torii S, Murakami K, Nakayama K (1997). Identifica-tion and subcellular localizaIdentifica-tion of a novel mammalian dynamin-related protein homologous to yeast Vps1p and Dnm1p. J Biochem 122, 525–530.
Sieghart W, Losert D, Strommer S, Cejka D, Schmid K, Rasoul-Rocken-schaub S, Bodingbauer M, Crevenna R, Monia BP, Peck-Radosavljevic M, Wacheck V (2006). Mcl-1 overexpression in hepatocellular carcinoma: a potential target for antisense therapy. J Hepatol 44, 151–157. Skoda C, Erovic BM, Wachek V, Vormittag L, Wrba F, Martinek H,
Hei-duschka G, Kloimstein P, Selzer E, Thurnher D (2008). Down-regulation of Mcl-1 with antisense technology alters the effect of various cytotoxic agents used in treatment of squamous cell carcinoma of the head and neck. Oncol Rep 19, 1499–1503.
Skvara H, Thallinger C, Wacheck V, Monia BP, Pehamberger H, Jansen B, Selzer E (2005). Mcl-1 blocks radiation-induced apoptosis and inhibits clonogenic cell death. Anticancer Res 25, 2697–2703.
Smirnova E, Griparic L, Shurland DL, van der Bliek AM (2001). Dynamin-related protein Drp1 is required for mitochondrial division in mammalian cells. Mol Biol Cell 12, 2245–2256.
Spitali P, Aartsma-Rus A (2012). Splice modulating therapies for human disease. Cell 148, 1085–1088.
Suski JM, Lebiedzinska M, Bonora M, Pinton P, Duszynski J, Wieckowski MR (2012). Relation between mitochondrial membrane potential and ROS formation. Methods Mol Biol 810, 183–205.
Szabadkai G, Simoni AM, Chami M, Wieckowski MR, Youle RJ, Rizzuto R (2004). Drp-1-dependent division of the mitochondrial network blocks intraorganellar Ca2+ waves and protects against Ca2+-mediated apop-tosis. Mol Cell 16, 59–68.
Thomas LW, Lam C, Edwards SW (2010). Mcl-1; the molecular regulation of protein function. FEBS Lett 584, 2981–2989.
Tondera D, Santel A, Schwarzer R, Dames S, Giese K, Klippel A, Kaufmann J (2004). Knockdown of MTP18, a novel phosphatidylinositol 3-kinase-dependent protein, affects mitochondrial morphology and induces apoptosis. J Biol Chem 279, 31544–31555.
van der Bliek AM (1999). Functional diversity in the dynamin family. Trends Cell Biol 9, 96–102.
Varadarajan S, Butterworth M, Wei J, Pellecchia M, Dinsdale D, Cohen GM (2013). Sabutoclax (BI97C1) and BI112D1, putative inhibitors of MCL-1, induce mitochondrial fragmentation either upstream of or independent of apoptosis. Neoplasia 15, 568–578.
Vinogradov A, Scarpa A (1973). The initial velocities of calcium uptake by rat liver mitochondria. J Biol Chem 248, 5527–5531.
Wacheck V, Cejka D, Sieghart W, Losert D, Strommer S, Crevenna R, Monia BP, Selzer E (2006). Mcl-1 is a relevant molecular target for antisense oligonucleotide strategies in gastric cancer cells. Cancer Biol Ther 5, 1348–1354.
Westrate LM, Sayfie AD, Burgenske DM, MacKeigan JP (2014). Persistent mitochondrial hyperfusion promotes G2/M accumulation and caspase-dependent cell death. PLoS One 9, e91911.
Wieckowski MR, Giorgi C, Lebiedzinska M, Duszynski J, Pinton P (2009). Isolation of mitochondria-associated membranes and mitochondria from animal tissues and cells. Nat Protoc 4, 1582–1590.
Yang T, Kozopas KM, Craig RW (1995). The intracellular distribution and pat-tern of expression of Mcl-1 overlap with, but are not identical to, those of Bcl-2. J Cell Biol 128, 1173–1184.
Yin XM, Oltvai ZN, Korsmeyer SJ (1994). BH1 and BH2 domains of Bcl-2 are required for inhibition of apoptosis and heterodimerization with Bax. Nature 369, 321–323.
Yoon Y, Pitts KR, McNiven MA (2001). Mammalian dynamin-like protein DLP1 tubulates membranes. Mol Biol Cell 12, 2894–2905.