ORIGINAL ARTICLE
Hematopoietic stem cell transplantation in Europe 2014: more
than 40000 transplants annually
JR Passweg1, H Baldomero1, P Bader2, C Bonini3, S Cesaro4, P Dreger5, RF Duarte6, C Dufour7, J Kuball8, D Farge-Bancel9, A Gennery10,
N Kröger11, F Lanza12, A Nagler13, A Sureda6and M Mohty14for the European Society for Blood and Marrow Transplantation (EBMT)
A record number of 40 829 hematopoietic stem cell transplantation (HSCT) in 36 469 patients (15 765 allogeneic (43%), 20 704 autologous (57%)) were reported by 656 centers in 47 countries to the 2014 survey. Trends include: continued growth in transplant activity, more so in Eastern European countries than in the west; a continued increase in the use of haploidentical family donors (by 25%) and slower growth for unrelated donor HSCT. The use of cord blood as a stem cell source has decreased again in 2014. Main indications for HSCT were leukemias: 11 853 (33%; 96% allogeneic); lymphoid neoplasias; 20 802 (57%; 11% allogeneic); solid tumors; 1458 (4%; 3% allogeneic) and non-malignant disorders; 2203 (6%; 88% allogeneic). Changes in transplant activity include more allogeneic HSCT for AML in CR1, myeloproliferative neoplasm (MPN) and aplastic anemia and decreasing use in CLL; and more autologous HSCT for plasma cell disorders and in particular for amyloidosis. In addition, data on numbers of teams doing alternative donor transplants, allogeneic after autologous HSCT, autologous cord blood transplants are presented.
Bone Marrow Transplantation advance online publication, 22 February 2016; doi:10.1038/bmt.2016.20
INTRODUCTION
Hematopoietic stem cell transplantation (HSCT) is an established procedure for many acquired and congenital disorders of the hematopoietic system, including disorders of the immune
system, and as enzyme replacement in metabolic disorders.1–4
The annual activity survey of the European Society of Blood and
Marrow Transplantation (EBMT), describing the status
of HSCT in Europe and affiliated countries, has become an
instrument used to observe trends and to monitor changes in
technology use.5–12The survey captures the numbers of HSCT
performed in the preceding year from each participating team, divided by indication, donor type and stem cell source.
The standardized structure of the survey over many
years and the excellent commitment of the participating teams allow us to observe changes over time and to evaluate factors associated with these changes. More recently, the survey has included additional information on novel cell therapies with
hematopoietic stem cells for non-hematopoietic use, as
well as on the use of non-hematopoietic stem and progenitor cells. This coincides with the recent interest of the World Health Organization (WHO) (www.who.org) in cell and tissue transplants, and further stresses the need for adequate and
timely information.13 The analysis of the survey data spanning
over 20 years has shown a continued and constant increase in the annual numbers of HSCT and transplant rates (number of HSCT per 10 million inhabitants) for both allogeneic and autologous HSCT.
This report is based on the 2014 survey data. In addition to transplant rates and indications, this report focuses on the use of donors other than HLA identical siblings and matched unrelated donors for allogeneic HSCT.
PATIENTS AND METHODS Data collection and validation
Participating teams were invited to report data for 2014 by indication, stem cell source and donor type as listed in Table 1. The survey allows the possibility to report additional information on the numbers of subsequent transplants performed as a result of relapse, rejection or those that are part of a planned sequential transplant protocol. Supplementary information on the numbers of donor lymphocyte infusions, reduced intensity HSCT and the numbers of pediatric HSCT is also collected. Quality control
measures included several independent systems: confirmation of validity
of the entered data by the reporting team, selective comparison of the survey data with MED-A data sets in the EBMT Registry database and cross-checking with the National Registries.
Teams
In all, 680 centers from 49 countries were contacted for the 2014 survey
(40 European and 9 affiliated countries); of which 656 teams reported. This
corresponds to a 97% return rate and includes 553 active EBMT member teams. Twenty-six active teams failed to report in 2014.
Contacted teams are listed in the Supplementary information in alphabetical order by country, city, EBMT centre code, with their reported
numbers offirst and total HSCT, and of first allogeneic and autologous
HSCT. The WHO regional office definitions (www.who.org) were used to
1
EBMT Activity Survey Office, Division of Hematology, Department of Medicine, University Hospital Basel, Basel, Switzerland; 2
Klinik für Kinder- und Jugendmedizin, Universitätsklinikum Frankfurt, Goethe-Universität, Frankfurt am Main, Germany;3
Università Vita-Salute San Raffaele, Milan, Italy;4
Paediatric Haematology Oncology, Policlinico G. B. Rossi, Verona, Italy;5Medizinische Klinik V, University of Heidelberg, Heidelberg, Germany;6Hematology Department, Institut Català d’Oncologia, Hospital Duran I Reynals, Barcelona, Spain;7Hematology Unit, G.Gaslini Children’s Institute, Genova, Italy;8
Department of Haematology, University Medical Centre, Utrecht, The Netherlands;9
Service de Médecine Interne, Maladies Autoimmunes et Pathologie Vasculaire, Hôpital St Louis, Paris, France;10
Paediatric Team Children’s BMT Unit, Great North Children’s Hospital, Royal Victoria Infirmary, Newcastle University, Newcastle-Upon-Tyne, UK;11
Department of Stem cell Transplantation, University Hospital Eppendorf, Hamburg, Germany;12
Hematology and BMT Unit, Cremona, Italy;13
Chaim Sheba Medical Center, Tel-Hashomer, Israel and14
Department of Hematology, Hôpital Saint Antoine, Paris, France. Correspondence: Professor JR Passweg, EBMT Activity Survey Office, Division of Hematology, University Hospital Basel, Petergraben 4, Basel 4031, Switzerland.
E-mail: [email protected]
Table 1. Numbe rs of hem atopoie tic stem ce ll transp lants in Europe 2014 by ind ication, donor ty pe and stem cell sour ce Allogeneic Aut ologous Total Family To tal Fam ily Un related To tal Un related HLA -id No n-id Tw in BM PBPC Cord BM PB PC Cord BM PBPC BM PBPC cord BM only BM+PB PC Cord Allo Auto Tot al L eukem ias 754 3162 14 398 683 1 2 4 5018 909 5053 368 6330 13 492 0 1 1 348 505 11 853 Acute myelo id leukem ia 314 1695 9 206 358 0 1 1 2584 368 2592 190 3150 10 373 0 5734 383 6117 F irst CR 229 1210 4 7 8 171 0 1 0 1693 238 1628 111 1977 8 317 0 3670 325 3995 Not fi rst CR 85 485 5 128 187 0 0 1 891 130 964 79 1173 2 5 6 0 2064 58 2122 Acute lym phatic leukem ia 293 634 4 9 3 194 1 0 1 1220 312 818 105 1235 3 8 6 0 2455 89 2544 F irst CR 174 459 1 3 1 9 3 1 0 0 759 169 554 55 778 3 7 8 0 1537 81 1618 Not fi rst CR 119 175 3 6 2 101 0 0 1 461 143 264 50 457 0 8 0 918 8 926 Chron ic myeloid leukemia 27 118 1 9 13 0 1 0 169 46 183 15 244 0 3 0 413 3 416 Chronic phase 18 46 1 5 5 0 1 0 76 26 89 7 122 0 1 0 198 1 199 Not fi rst chron ic p hase 9 7 2 0 4 8 0 0 0 9 3 2 0 9 4 8 122 0 2 0 215 2 217 MDS or MD/M PN 94 461 0 6 9 9 5 0 0 1 720 148 964 46 1158 0 5 0 1878 5 1883 MPN 18 142 0 1 2 1 6 0 0 1 189 25 295 6 326 0 6 0 515 6 521 Chronic lym phocytic leuke mia 8 112 0 9 7 0 0 0 136 10 201 6 217 0 1 9 0 353 19 372 L ympho proli ferativ e disorder s 7 6 763 0 104 154 0 1 10 1108 83 1058 43 1184 25 18484 1 2292 18510 20802 Plasma ce ll disorder s -MM 12 203 0 6 15 0 1 5 242 12 287 9 308 6 10043 0 550 10049 10599 Plasma ce ll disorder s -other 1 1 2 0 1 1 0 0 0 1 5 0 15 0 1 5 0 372 0 3 0 372 402 Hodgkin's lymphom a 1 8 135 0 5 6 6 2 0 0 0 271 14 185 7 206 16 2012 0 477 2028 2505 Non-Hodgkin lymphoma 45 413 0 4 1 7 6 0 0 5 580 57 571 27 655 3 6057 1 1235 6061 7296 Solid tumors 5 9 0 1 17 0 0 1 3 3 4 7 0 11 49 1364 1 4 4 1414 1458 Neurobla stom a 3 1 0 0 9 0 0 0 1 3 2 1 0 3 2 9 438 0 1 6 467 483 Soft tissue sarcoma 0 1 0 0 4 0 0 1 6 0 3 0 3 1 18 0 9 19 28 Germinal tum ors 0 0 0 0 0 0 0 0 0 0 0 0 0 0 306 0 0 306 306 Breast cancer 0 5 0 0 0 0 0 0 5 0 0 0 0 0 31 0 5 31 36 Ewing 0 2 0 0 2 0 0 0 4 0 3 0 3 4 195 0 7 199 206 Other so lid tumo rs 2 0 0 1 2 0 0 0 5 2 0 0 2 1 5 376 1 7 392 399 Non-m alignant disorder s 619 235 25 125 140 2 2 0 1148 413 271 110 794 12 248 1 1942 261 2203 Bone marrow failure — SAA 208 109 1 1 6 3 2 0 2 0 368 129 109 11 249 0 2 1 617 3 620 Bone marrow failure — other 60 15 3 1 7 2 0 1 0 0 116 54 37 9 100 0 1 0 216 1 217 Hemog lobinopathies — thal 143 78 13 31 24 0 0 0 289 39 8 1 48 0 1 0 337 1 338 Hemog lobinopathies — othe r 6 8 5 3 1 3 4 0 0 0 9 3 9 3 0 12 2 0 0 105 2 107 P rima ry immun e d efi ci encies 109 20 5 3 7 5 0 0 0 0 221 130 90 58 278 2 3 0 499 5 504 Inh. d isorder s o f Metab olism 29 6 0 1 1 9 1 0 0 5 6 5 1 1 9 2 9 9 9 8 1 0 155 9 164 A uto immun e disea se 2 2 0 0 1 0 0 0 5 1 5 2 8 0 240 0 1 3 240 253 Others 27 16 0 8 11 0 0 0 6 2 2 8 3 2 1 7 7 7 0 14 0 139 14 153 Total p atients 1481 4185 39 636 1005 3 5 15 7369 1437 6421 538 8396 99 20 602 3 1 5 765 20 704 36 469 Retransp lants 42 235 0 7 6 225 1 1 2 582 76 398 49 523 1 1593 0 1105 1594 2699 A d d itional tran splan ts 5 1 6 0 5 1 0 0 0 0 36 2 3 6 2 40 2 1583 0 7 6 1585 1661 Total all transp lants 1528 4436 39 717 1240 4 6 17 7987 1515 6855 589 8959 102 23 778 3 1 6 946 23 883 40 829 P ediatric transplants 903 287 34 186 313 2 2 2 1729 859 441 250 1550 63 1056 2 3279 1121 4400 2
classify countries as European or Non-European. Nine non-European countries participated in the 2014 EBMT survey: Algeria, Iran, Israel, Jordan, Lebanon, Nigeria, Saudi Arabia, South Africa and Tunisia. Their data (2716 HSCT) from 30 actively transplanting teams makes up 6.7% of the total data set and are included in all analyses.
Patient and transplant numbers
Wherever appropriate, patient numbers corresponding to the number of
patients receiving afirst transplant and transplant numbers reflecting the
total number of transplants performed are listed.
The term sibling donor includes HLA identical siblings and twins but not siblings with HLA mismatches. Unrelated donor transplants include HSCT from unrelated donors with peripheral blood and marrow as a stem cell source but not cord blood HSCT, these are shown as cord blood HSCT in
Figure 3a. Mismatched family donors are termed‘haploidentical’ for the
purpose of this analysis, but this category includes also mismatched related donors that are mismatched to a lesser degree than a full haplotype. As the haplotype mismatched donors are the majority in this
category, the term‘haploidentical’ is used for the entire group.
Multiple transplants may include multiple transplants defined as
subsequent transplants within a planned double or triple autologous or allogeneic transplant protocol, and retransplants (autologous or
allogeneic) defined as unplanned HSCT for rejection or relapse after a
previous HSCT. Transplant rates
Transplant rates, defined as the total number of HSCT per 10 million
inhabitants, were computed for each country without adjustments for patients who crossed borders and received their HSCT in a foreign country. Population numbers were obtained from Eurostats for 2014 for the European countries (http://epp.eurostat.ec.europa.eu/portal/page/portal/ statistics/search_database), and the US census bureau database for the non-European countries (http://www.census.gov/population/international/ data/idb/rank.php).
Analysis
Wherever appropriate absolute numbers of transplanted patients,
trans-plants or transplant rates are shown for specific countries, indications or
transplant techniques.
RESULTS 2014 Data
Participating teams in 2014. Of the 656 teams, 410 (62%)
performed both allogeneic and autologous transplants; 227
(35%) restricted their activity to autologous HSCT, and 13 teams (2%) to allogeneic transplants only. Six teams (1%) reported having performed no transplants in 2014 due to renovation or temporary closure of the transplant unit. Of the 656 active centers, 118 (18%) centers performed transplants on both adult and pediatric patients. An additional 107 (16%) centers were dedicated pediatric transplant centers and 431 (66%) centers performed transplants on adults only.
Numbers of patients and transplants. In 2014, 40 829 transplants
were reported in 36 469 patients (first transplant) increasing the
number of transplants to over 40 000 for thefirst time since 1990.
Of these, 16 946 (42%) were allogeneic; 23 883 (58%) were autologous. When compared with 2013, the total number of transplants increased by 4.1% (4.5% allogeneic HSCT and 3.8%
autologous HSCT).11 Furthermore, there were 4360 second or
subsequent transplants 1181 allogeneic and 3179 autologous. The total number of transplants increased by 22% compared with 5 years (since 2010) and 80% compared with 15 years (2000) previously. The total number of patients transplanted under the age of 18 in both dedicated and joint adult-pediatric units was 4400 (3279 allogeneic and 1121 autologous HSCT). Of these, 3117 patients (71%) (2420 allogenic and 697 autologous) were performed in dedicated pediatric centers.
Indications. Indications for HSCT in 2014 are listed in detail in
Table 1. Main indications were leukemia’s (including primarily
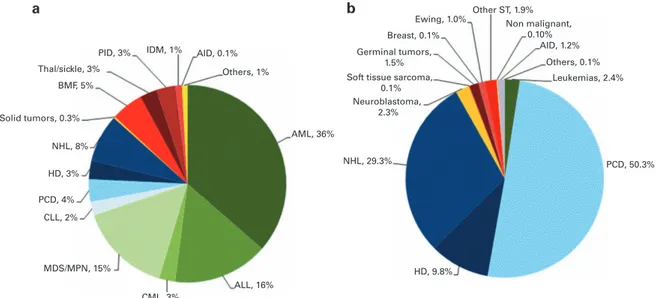
AML, ALL and myelodysplastic syndrome (MDS)/myelodysplastic (MD)/myeloproliferative neoplasm (MPN)): 11 853 (33% of total; 96% of which were allogeneic); lymphoid neoplasias including non-Hodgkin lymphoma (NHL), Hodgkin's lymphoma and plasma cell disorders: 20 802 (57%; 11% allogeneic); solid tumors: 1458 (4%; 3% allogeneic); and non-malignant disorders; 2203 (6%; 88% allogeneic). As seen in previous years, the majority of HSCT for lymphoid malignancies were autologous while most transplants for leukemia were performed using stem cells from allogeneic donors. Autologous HSCT for non-malignant disorders predomi-nantly include patients with autoimmune disorders (Figures 1a
and b). For thefirst time since 1990 450% of patients receiving
autologous HSCT had plasma cell disorders (Figure 1b).
Distributions of indications for HSCT are shown in Figures 1a and b for allogeneic and autologous HSCT, respectively. Compared with 2013, there were increases in allogeneic HSCT for AML in CR1 by 13%, myeloproliferative neoplasm 14% and severe aplastic
IDM, 1% AID, 0.1% AID, 1.2%
Others, 1% Ewing, 1.0% Breast, 0.1% Germinal tumors, 1.5% Others, 0.1% Other ST, 1.9% Non malignant, 0.10% PID, 3% BMF, 5% NHL, 8% HD, 3% PCD, 4% CLL, 2% CML, 3% ALL, 16% AML, 36%
Soft tissue sarcoma, 0.1% Neuroblastoma, 2.3% NHL, 29.3% HD, 9.8% PCD, 50.3% Leukemias, 2.4% MDS/MPN, 15% Solid tumors, 0.3% Thal/sickle, 3% a b
Figure 1. Relative proportions of indications for an HSCT in Europe in 2014. (a) Proportions of disease indications for an allogeneic HSCT in Europe in 2014. (b) Proportions of disease indications for an autologous HSCT in Europe in 2014.
anemia (SAA) by 12%. A decrease was seen in CLL by 21%. For autologous HSCT, there was an increase in myeloma by 5%, amyloidosis by 44% (N = 114), Hodgkin's lymphoma by 8% and autoimmune disease by 40%. No major decrease in activity was seen for any given disease. In all, 2649 patients received treatment with donor lymphocyte infusions, a 5.4% increase since 2013. In all, 6871 of the total allogeneic HSCT were performed using non-myeloablative conditioning. This is an increase of 5.2% since in 2014 and is 41% of all allogeneic HSCT.
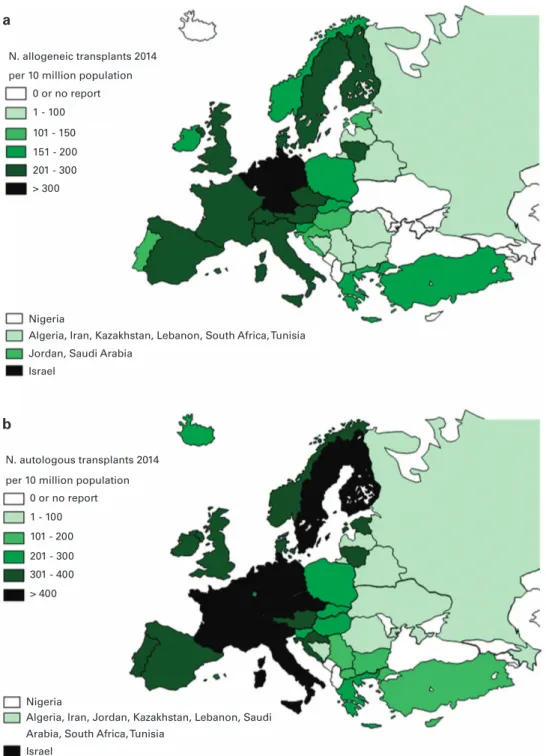
Transplant rates. Figures 2a and b show transplant rates by country
for allogeneic and autologous HSCT comparing rates in 2014. Median transplant rates per 10 million inhabitants were 133 (range, 5.2–495)
for allogeneic HSCT and 230 (range, 9.5–530) for autologous HSCT in
2014. As shown in Figure 3a, numbers of allogeneic HSCT continue to increase, more in unrelated donor HSCT than in sibling HSCT, while
cord blood transplants are slightly decreasing. There is a significant
increase in transplants from haploidentical donors and it appears that this comes at the expense of a slower increase in the use of
unrelated donors and cord blood.14–16
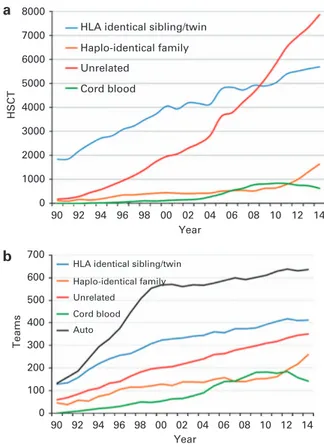
As these transplants are done by dedicated teams, Figure 3b shows the development of the number of teams since 1990
reporting any type of HSCT. Thefigure shows that the increase in
haploidentical HSCT is paralleled by the number of teams performing these types of HSCT and similarly a lower number of teams reporting cord blood HSCT in 2014.
N. allogeneic transplants 2014 per 10 million population
per 10 million population 0 or no report 0 or no report 1 - 100 1 - 100 > 400 101 - 200 201 - 300 301 - 400 101 - 150 151 - 200 201 - 300 > 300 Nigeria Nigeria
Arabia, South Africa, Tunisia
Algeria, Iran, Jordan, Kazakhstan, Lebanon, Saudi Jordan, Saudi Arabia
Israel
Israel
Algeria, Iran, Kazakhstan, Lebanon, South Africa, Tunisia
a
b
N. autologous transplants 2014
Figure 2. Transplant rates in Europe ( = total number of HSCT per 10 million inhabitants) by participating country in 2014. (a) Allogeneic transplant rates per 10 million population in 2014. (b) Autologous transplant rates per 10 million population in 2014.
The activity survey has collected data on allogeneic HSCT in patients having had a prior autologous HSCT either planned or to treat relapse. Figure 4 shows 566 allogeneic transplants after an autograft treatment protocol. The main indications were myeloma (39% N = 223), NHL (30% N = 171) and Hodgkin's lymphoma (20% N = 114). The numbers have remained more or less stable over the last 10 years.
Autologous cord blood transplantation. Information on cord
blood transplants has been collected since this stem cell source
was introduced in 1997. As numerous autologous cord blood
banks exist, the use of autologous cord blood is of interest.17We
found since 2007 a small number of confirmed autologous cord
blood HSCT. The main indication was SAA (N = 6) followed by NHL (N = 3), neuroblastoma (N = 3), MDS (N = 2), MPN (N = 1) and other solid tumor (N = 1).
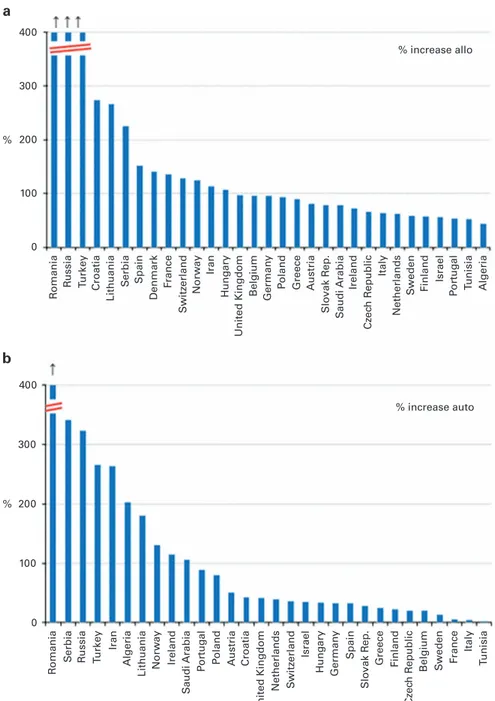
Evolving countries. HSCT activity is increasing in many countries;
in some countries, this increase was particularly striking; in particular a clear growth in transplant activity in countries of Eastern Europe can be seen. Figures 5a and b show increases in % of allogeneic and autologous transplant activity respectively since
2004, that is, for the last 10 years in all countries reporting4100
HSCT in 2014. The greatest increase was seen for allogeneic HSCT in Romania, Russia, Turkey, Croatia, Lithuania and Serbia (ranging
from 1000% to4200%, respectively) and for autologous HSCT in
Romania, Serbia, Russia, Turkey and Iran (ranging from 1200% to 4200%, respectively).
Additional cellular therapies. In all, 15 teams from 11 countries
reported through the activity survey the treatment of 160 patients with hematopoietic stem cells for non-hematopoietic use in 2014. A total of 152 therapies were performed using autologous HSCs with 8 using allogeneic HSCs for epithelial diseases. The main indications were cardiovascular, 88; neurolo-gical, 47; tissue repair, 17 and epithelial: 8. In addition, 525 patients in 93 teams and 20 countries received mesenchymal stromal cells for prevention/treatment of GvHD (450, increasing from 213 in 2010 and 344 in 2013), prevention/treatment of graft failure (27) and for unspecified reasons (48; 38 of which were allogeneic).
DISCUSSION
The EBMT activity survey has been conducted annually since
1990.6 The 2010 survey reported for the first time more than
30 000 patients transplanted in a given year,18 this is now
followed by440 000 transplants in this 2014 survey. Therefore,
transplant numbers continue to increase unabated.
HSCT for some indications continues to increase but not for others. Of interest is growth of allogeneic HSCT for AML in CR1, myeloproliferative neoplasia and marrow failure and a notable decrease in CLL possibly due to the availability of novel kinase inhibitors. In autologous HSCT, transplant activity in myeloma continues to increase and in particular in amyloidosis possibly
following publication of positive results.19
In allogeneic HSCT, the use of unrelated donors continues to increase but less so than in previous years (median 12% annual increase in the years 2004–2010 and 5% annual increase in the years 2011–2014). This is compensated for by an increase in the use of haploidentical donors, who are in some sense competition for unrelated and cord blood transplants (median 2% annual
increase in the years 2004–2010 and 25% annual increase in the
years 2011–2014).
In this year's survey, we looked at the number of teams performing these particular transplants and activity in unrelated donor cord blood HSCT and haploidentical HSCTs mirrors the transplant activity for these particular indications, that is, more haploidentical HSCTs are also performed by more teams doing haploidentical HSCT.
We looked for the first time at allogeneic HSCTs done after
autologous HSCTs. The majority of these transplants are for myeloma, non-Hodgkin lymphoma and Hodgkin's lymphoma
showing that probably the majority of this activity reflects salvage
allogeneic procedures after failed autologous HSCT.
Transplant activity is distributed unevenly throughout Europe, and several analyses have shown correlation with income. As shown here the majority in increased activity for allogeneic and
HLA identical sibling/twin Haplo-identical family Unrelated
Cord blood
HLA identical sibling/twin Haplo-identical family Unrelated Cord blood Auto 8000 7000 6000 5000 4000 3000 2000 1000 0 90 700 600 500 400 300 200 100 92 94 96 98 00 Year 04 10 12 0 HSCT Teams 02 06 08 14 90 92 94 96 98 00 Year 04 10 12 02 06 08 14
Figure 3. Numbers of HSCT and teams by transplant and donor type 1990–2014. (a) Absolute numbers of sibling, haploidentical, cord blood and unrelated donors HSCT in Europe 1990–2014. (b) Number of teams by choice of donor in Europe 1990–2014.
PCD 400 350 300 250 200 150 100 50 04 05 06 07 08 Year 09 10 11 12 13 14 0 HSCT NHL HD Acute leuk
Figure 4. Main indication for allogeneic HSCT after a previous autologous HSCT in Europe since 2004.
autologous HSCT are in middle income countries, particularly in Eastern Europe who are catching up with Western European countries.
We have added a paragraph on the use of autologous cord blood transplantation. These cord blood products were most
certainly retrieved from private autologous cord blood banks.17
The largest indication was for marrow failure. The numbers shown here, that is, slightly more than two procedures per year
reflect the rare indications for such transplants and may fuel the
discussion on the usefulness of autologous cord blood banks in Europe.
In conclusion, this year's activity survey shows a continued increase in the use of HSCT across Europe. Some trends are visible and are discussed here. The paper reflects current practice and results may be useful to health-care planning and health policy makers.
CONFLICT OF INTEREST
The authors declare no conflict of interest.
ACKNOWLEDGEMENTS
The cooperation of all participating teams and their staff (listed in the Supplementary information), the EBMT Co-ordination offices; Barcelona, Paris, London (C Ruiz de Elvira), the Austrian Registry (ASCTR) (H Greinix, B Lindner, C Wagner), the Belgium Registry (Yves Beguin, M Van Spauwen) the Czech Registry (P Zak, M Trnkova, K Benesova), the French Registry (SFGM) (I Yakoub-Agha, N Raus), the German Registry (DRST) (H Ottinger, K Fuchs, C Müller, H Neidlinger, F Hanke), the Italian Registry (GITMO) (F Bonifazi, B Bruno, E Oldani), the Dutch Registry (JJ Cornelissen, M Groenendijk), the Spanish Registry (GETH) (J Diez Martin, A Cedillo), the Swiss Registry (SBST) (U Schanz, H Baldomero), the Turkish Registry (G Gurman, M Arat) and the British Registry (BSBMT) (K Kirkland, J Perry) is greatly appreciated. We also thank D John for database support. EBMT is supported by grants from the corporate sponsors: Jazz Pharmaceuticals plc, Molmed S.p.A, AstellasPharma Europe Ltd, Celgene International SARL, Clinigen Group Ltd, Gilead Sciences Europe Ltd., GlaxoSmithKline plc., Hospira 400 300 200 100 0 400 300 200 100 0 % increase allo % increase auto % % R omania R omania R u ssia R ussia T u rk ey Tu rk e y Spain Spain Iran Iran Belgium Belgium German y German y P oland P oland Greece Greece Ireland Ireland Italy Italy S w eden S w eden Finland Finland Israel Israel P o rt ug al P o rt ug al T unisia T unisia Algeria Algeria Netherlands Netherlands Cz ec h R e public Cz ec h R e public Austria Austria Slo vak R ep. Slo vak R ep. S audi Arabia S audi Arabia Hung ary Hung ary United Kingdom United Kingdom F rance F rance Denmark Croatia Croatia Lithuania Lithuania S erbia S erbia Norw ay Norw ay S w itz erland S w itz erland a b
Figure 5. Percentage increase in HSCT activity between the years 2004 and 2014 in countries reporting 4100 HSCT in 2014. (a) Increase in allogeneic HSCT. (b) Increase in autologous HSCT.
Inc., Janssen, Medac Hematology GmbH, MiltenyiBiotec GmbH, MSD Sharp&Dohme GmbH, Neovii Biotech GmbH, Pfizer Oncology, Sanofi Oncology, Takeda Pharmaceu-ticals, Therakos Photopheresis, Alexion, Amgen Oncology GmbH, Kiadis Pharma, Macropharma, Mundipharma, Pierre Fabre Médicament and Terumo BCT.
REFERENCES
1 Copelan EA. Hematopoietic stem-cell transplantation. N Engl J Med 2006;354: 1813–1826.
2 Appelbaum FR. Hematopoietic-cell transplantation at 50. N Engl J Med 2007;357: 1472–1475.
3 Ljungman P, Bregni M, Brune M, Cornelissen J, deWitte T, Dini G et al. European Group for Blood and Marrow. Allogeneic and autologous transplantation for haematological diseases, solid tumours and immune disorders: current practice in Europe 2009. Bone Marrow Transplant 2010;45: 219–234.
4 Gratwohl A, Baldomero H, Aljurf M, Pasquini MC, Bouzas LF, Yoshimi et al. Hematopoietic stem cell transplantation: a global perspective. JAMA 2010;303: 1617–1624.
5 Alois G, Marcelo CP, Mahmoud A, Yoshiko A, Helen B, Lydia F et al. One million haemopoietic stem-cell transplants: a retrospective observational study. Lancet Haematol 2015;2: e91–e100.
6 Gratwohl A, Baldomero H, Schwendener A, Gratwohl M, Apperley J, Frauendorfer K et al. The EBMT activity survey 2008 impact of team size, team density and new trends. Bone Marrow Transplant 2011;46: 174–191.
7 Gratwohl A. Bone marrow transplantation activity in Europe 1990. Report from the European Group for Bone Marrow Transplantation (EBMT). Bone Marrow Trans-plant 1991;8: 197–201.
8 Gratwohl A, Baldomero H, Horisberger B, Schmid C, Passweg J, Urbano-Ispizua A. Accreditation Committee of the European Group for Blood and Marrow Trans-plantation (EBMT). Current trends in haematopoietic stem cell transTrans-plantation in Europe. Blood 2002;100: 2374–2386.
9 Gratwohl A, Baldomero H, Schwendener A, Rocha V, Apperley J, Frauendorfer K et al. The EBMT activity survey 2007 with focus on allogeneic HSCT for AML and novel cellular therapies. Bone Marrow Transplant 2009;43: 275–291.
10 Gratwohl A, Schwendener A, Baldomero H, Gratwohl M, Apperley J, Niederwieser D et al. Changes in use of hematopoietic stem cell transplantation; a model for diffusion of medical technology. Haematologica 2010;95: 637–643.
11 Passweg JR, Baldomero H, Peters C, Gaspar HB, Cesaro S, Dreger P et al. Hema-topoietic SCT in Europe: data and trends in 2012 with special consideration of pediatric transplantation. Bone Marrow Transplant 2014;49: 744–750. 12 Passweg JR, Baldomero H, Bader P, Bonini C, Cesaro S, Dreger P et al.
Hemato-poietic SCT in Europe 2013: recent trends in the use of alternative donors showing more haploidentical donors but fewer cord blood transplants. Bone Marrow Transplant 2015;50: 476–482.
13 World Health Organisation, WHO (http://www.who.int/topics/transplantation/en/). 14 Foeken LM, Green A, Hurley CK, Marry E, Wiegand T, Oudshoorn M. Monitoring
the international use of unrelated donors for transplantation: the WMDA annual reports. Bone Marrow Transplant 2010;45: 811–818.
15 Brunstein CG, Fuchs EJ, Carter SL, Karanes C, Costa LJ, Wu J et al. Blood and Marrow Transplant Clinical Trials Network. Alternative donor transplantation after reduced intensity conditioning: results of parallel phase 2 trials using partially HLA-mismatched related bone marrow or unrelated double umbilical cord blood grafts. Blood 2011;118: 282–288.
16 Luznik L, O'Donnell PV, Symons, Chen AR, Leffell MS, Zahurak M et al. HLA-haploidentical bone marrow transplantation for hematologic malignancies using nonmyeloablative conditioning and high-dose, posttransplantation cyclopho-sphamide. Biol Blood Marrow Transplant 2008;14: 641–650.
17 Ballen KK, Verter F, Kurtzberg J. Umbilical cord blood donation: public or private? Bone Marrow Transplant 2015;50: 1271–1278.
18 Passweg JR, Baldomero H, Gratwohl A, Bregni M, Cesaro S, Dreger P et al. The EBMT activity survey: 1990-2010. Bone Marrow Transplant 2012; 47: 906–923.
19 Anita D’Souza, Angela D, Baldeep W, Mei-Jie Z, Jiaxing H, Morie AG et al. Improved outcomes after autologous hematopoietic cell transplantation for light chain amyloidosis: a center for International blood and marrow transplant research study. J Clin Oncol 2015;33: 3741–3749.
This work is licensed under a Creative Commons Attribution-NonCommercial-NoDerivs 4.0 International License. The images or other third party material in this article are included in the article’s Creative Commons license, unless indicated otherwise in the credit line; if the material is not included under the Creative Commons license, users will need to obtain permission from the license holder to reproduce the material. To view a copy of this license, visit http:// creativecommons.org/licenses/by-nc-nd/4.0/