RPL5 on 1p22.1 is recurrently deleted in multiple myeloma and
its expression is linked to bortezomib response
Isabel JF Hofman1, Mark Van Duin2, Elke De Bruyne3, Laura Fancello1, George Mulligan4,
Ellen Geerdens5,6, Emanuela Garelli7, Cecilia Mancini8, Heidi Lemmens9, Michel Delforge9, Peter Vandenberghe9, Iwona Wlodarska5, Anna Aspesi10, Lucienne Michaux9, Karin
Vanderkerken3, Pieter Sonneveld2, and Kim De Keersmaecker1
1KU Leuven - University of Leuven, Department of Oncology, LKI - Leuven Cancer Institute,
Leuven, Belgium 2Department of Hematology, Erasmus Medical Center, Rotterdam, The
Netherlands 3Department of Hematology and Immunology, Myeloma Center Brussels, Vrije
Universiteit Brussels (VUB), Brussels, Belgium 4Takeda Pharmaceuticals International Co.,
Cambridge, MA, USA 5KU Leuven - University of Leuven, Center for Human Genetics, LKI -
Leuven Cancer Institute, Leuven, Belgium 6VIB Center for the Biology of Disease, Leuven,
Belgium 7Dipartimento Scienze della Sanità Pubblica e Pediatriche, Univ.Torino, Torino, Italy
8Dipartimento di Scienze Mediche, Univ.Torino, Torino, Italy 9Center for Human Genetics,
University Hospitals Leuven, Leuven, Belgium 10Department of Health Sciences, Universita' del
Piemonte Orientale, Novara, Italy
Abstract
Chromosomal region 1p22 is deleted in ≥20% of multiple myeloma (MM) patients, suggesting the presence of an unidentified tumor suppressor. Using high-resolution genomic profiling, we delimit a 58 kb minimal deleted region (MDR) on 1p22.1 encompassing two genes: ectopic viral
integration site 5 (EVI5) and ribosomal protein L5 (RPL5). Low mRNA expression of EVI5 and RPL5 was associated with worse survival in diagnostic cases. Patients with 1p22 deletion had lower mRNA expression of EVI5 and RPL5, however, 1p22 deletion status is a bad predictor of RPL5 expression in some cases, suggesting that other mechanisms downregulate RPL5 expression. Interestingly, RPL5 but not EVI5 mRNA levels were significantly lower in relapsed patients responding to bortezomib and; both in newly diagnosed and relapsed patients, bortezomib treatment could overcome their bad prognosis by raising their progression-free survival to equal
Users may view, print, copy, and download text and data-mine the content in such documents, for the purposes of academic research, subject always to the full Conditions of use:http://www.nature.com/authors/editorial_policies/license.html#terms
CORRESPONDENCE: Kim De Keersmaecker, Campus Gasthuisberg O&N1, box 603, Herestraat 49, 3000 Leuven. Tel 0032 16 373167, [email protected].
Authorship Contribution
IH designed and performed experiments and wrote the manuscript. MVD and PS performed outcome and gene expression analyses and critically reviewed the manuscript. EDB designed research and performed experiments. LF helped with bio-informatic analyses. GM provided survival and expression data and critically reviewed the manuscript. E Geerdens performed copy number arrays. E Garelli, CM and AA performed MLPA. HL performed FISH. IW designed FISH, wrote and critically reviewed the manuscript. MD, LM and PVDB collected patient samples and critically reviewed the manuscript. KVDK designed research and performed supervision. KDK designed and performed research, supervised the entire study and wrote the manuscript.
Author Manuscript
Leukemia. Author manuscript; available in PMC 2017 August 08.
Published in final edited form as:
Leukemia. 2017 August ; 31(8): 1706–1714. doi:10.1038/leu.2016.370.
Europe PMC Funders Author Manuscripts
that of patients with high RPL5 expression. In conclusion, our genetic data restrict the MDR on 1p22 to EVI5 and RPL5 and although the role of these genes in promoting MM progression remains to be determined, we identify RPL5 mRNA expression as a biomarker for initial response to bortezomib in relapsed patients and subsequent survival benefit after long-term treatment in newly diagnosed and relapsed patients.
Introduction
Multiple myeloma (MM) accounts for up to 10% of all hematologic malignancies. Patient outcome has improved significantly in the last decade, partially due to the introduction of novel agents, such as immunomodulatory drugs (IMiDs) as well as the proteasome inhibitors (bortezomib and second generation agents carfilzomib and ixazomib). Nevertheless, not all patients respond to these new drugs, and factors determining response are still poorly understood.1,2 In the light of high costs and higher occurrence of severe side-effects such as peripheral neuropathy associated with bortezomib treatment1,3, future efforts should be directed to developing biomarkers that can identify patients that will benefit from a particular drug or drug scheme.
MM, like other cancers, is caused by stepwise accumulation of genetic abnormalities. Chromosomal translocations involving the immunoglobulin heavy (IgH) locus causing overexpression of targeted oncogenes are primary events. The most prevalent of these translocations are t(11;14)(q13;q32) and t(4;14)(p16;q32), each present in 15% of cases. In the absence of IgH translocations, the disease is usually characterized by hyperdiploidy, specifically trisomy of odd chromosomes. Secondary hits then cause progression from asymptomatic monoclonal gammopathy of undetermined significance (MGUS), to smoldering myeloma, and finally to symptomatic myeloma with organ damage and bone lesions. Secondary events consist of mutations, chromosomal translocations and/or copy number changes. The mutational spectrum of MM has recently been characterized using genome wide next generation sequencing, which has revealed a heterogeneous mutational landscape with few recurrently affected genes. Only three genes have been found to be mutated in more than 10% of patients: KRAS (22% of cases), NRAS (20%) and FAM46C (12%).4–7 With regard to chromosomal abnormalities, secondary hits consist of t(8;14) (q24;q32) causing MYC activation, as well as copy number changes, with the most common ones being gains on 1q, 3p, 6p, 9p, 11q, 19p, 19q and 21q along with deletions of 1p, 4q, 16q and 22q. For some of these regions, candidate oncogenes and tumor suppressors contributing to disease progression have been identified.3, 8–10
Among the deleted regions, 1p is one of the most prevalent with up to 30% of myeloma patients carrying the deletion. Four distinct minimally deleted regions (MDRs) have been identified on 1p (1p12, 1p21.3p22.1, 1p31.1 and 1p32.3), of which 1p21.3p22.1 is the most common one (15-22% of patients).11–13 This region is associated with higher incidence of t(4;14)(p16;q32) and deletion of 17p and 13q14, and is a negative prognostic factor for progression-free survival (PFS) and overall survival (OS) in newly diagnosed patients.13 Low expression of several genes on 1p22 is part of a high risk MM gene signature.14 So far, however, no tumor suppressor has been identified on this cytoband. Previously, an MDR of
Europe PMC Funders Author Manuscripts
1p21.3p22.1 encompassing 35 genes was defined and MTF2 and TMED5 were proposed as candidate tumor suppressors in this region, as they show differential expression between deleted and non-deleted cases. However, no mutations were found in these genes, low MTF2 expression does not affect PFS or OS, and the association between low TMED5 expression and shorter survival is only borderline significant.11,12
To uncover potentially clinically relevant tumor suppressors on 1p22, we performed an in-depth genetic analysis of 1p22 in MM. We delineate an MDR encompassing only 2 genes (EVI5 and RPL5) and show for each of these genes that low expression is associated with lower survival in newly diagnosed but not in relapse patients. RPL5 expression is
significantly lower in relapse patients with initial response to bortezomib and both newly diagnosed and relapse patients with low RPL5 expression have better PFS when bortezomib is included in their treatment scheme. We thus identify RPL5 expression levels as a novel clinical biomarker for response to bortezomib.
Materials and Methods
Patient samplesWe studied 35 advanced diagnostic MM bone marrow samples available at UZ Leuven with at least 70% plasma cells (Supplementary Table 1). All cases were routinely characterized by FISH, as described previously.15 This study was approved by the ethical committee of the UZ Leuven. Copy number, mutation and gene expression data of the Multiple Myeloma Research Consortium (MMRC) (https://www.broadinstitute.org/mmgp/home) were also used. For survival analyses, we analyzed data from the phase III HOVON-65/ GMMG-HD4 and APEX trials.16–18 In the phase III HOVON-65/ GMMG-HD4 trial, newly diagnosed MM patients were treated with an experimental PAD protocol (bortezomib, doxorubicin, dexamethasone with bortezomib maintenance) or a conventional VAD protocol (vincristine, doxorubicin, dexamethasone with thalidomide maintenance). In the APEX trial, bortezomib versus high-dose dexamethasone monotherapy was tested in relapsed patients. All study participants provided informed consent to use their data for research purposes and all studies were conducted according to the Declaration of Helsinki.
High resolution copy number arrays
UZ Leuven cases were analyzed on Cytoscan HD arrays (Affymetrix). Data were processed using Chromosome Analysis Suite (ChAS) software (Affymetrix) with hg19 as reference. In order to call a deletion, we required at least 20 consecutive markers with a weighted log2 ratio of -0.15 or less. Raw data is available at NCBI as GEO accession GSE73976. Analysis of gene expression levels in patients
The 245 MMRC cases with copy number and expression data available on (https://
www.broadinstitute.org/mmgp/home) were analyzed. Patients with a log2 copy number ratio >-0.1 for 1p22.1 were considered non-deleted; ratios <-0.6 were considered deleted. Patients with values between -0.1 and -0.6 were excluded.
Europe PMC Funders Author Manuscripts
Bortezomib response analysis
Gene expression array data from the APEX trial were used (GSE9782). Only the bortezomib arm of the trial was used in this analysis. Patients with complete remission, partial response or minimal response were assigned to the group of responders. Patients with no change or progressive disease were considered non-responders. Probe sets with differential signal between responders and non-responders were calculated using limma (Bioconductor).19 The entire list of probe sets was ranked according to log2 fold changes and used as input for Gene Set Enrichment Analysis (GSEA) against the MSigDB C2 KEGG and C1 positional gene sets.20,21 Only GSEA results with a FDR q-value <0.2 were considered.
Survival analysis
For the analysis on the phase III HOVON-65/ GMMG-HD4 trial,16 327 patients with gene expression array profiling were included (GEO ID: GSE19784)). For the APEX trial, 264 patients from which gene expression array data were available were analyzed (GEO ID: GSE9782). On each of the trial datasets, Cox regression (including both arms of the trial) testing association between the indicated gene levels and survival was performed if the proportionality criterion was met (tested using covariate time analysis). Subsequently, patients were divided into groups with expression levels above the median (high expression) and below the median (low expression) or according to the specified threshold. Kaplan-Meier analysis was then performed on patients with either low or high expression to test the prognostic value of the indicated gene expression levels on survival and to test whether these patients differ in the benefit they get from each of the treatments.
More details on methods are available in the supplement.
Results
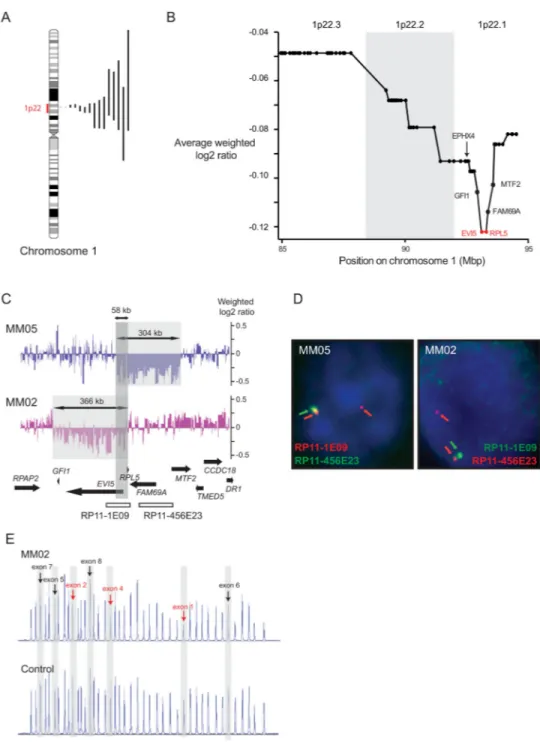
Delineation of a 58 kb MDR on 1p22.1 encompassing the EVI1 and RPL5 genes We analyzed 35 advanced MM samples on high resolution copy number arrays
(Supplementary table 1). The 1p22 cytoband, or part of it, was deleted in 15 out of 35 cases (43%), confirming the high incidence of 1p22 deletions in this disease (Figure 1A;
Supplementary table 2).11–13 Loss of 1p22 was detected in cases with hyperdiploid karyotype (7/15) or IGH-mediated translocation/deletion (5/15). The most frequent aberration associated with the 1p22 loss was del(13q14/RB1) (10/15) (Supplementary table 1). For 2 cases with deletions in bone marrow at diagnosis, buccal swab DNA was available and absence of the lesion in the buccal swab was confirmed by MLPA, supporting the somatic nature of these lesions (Supplementary figure 1).
To determine the MDR at 1p22, the average weighted log2 array values were calculated for each of the genes on 1p22 in our cohort (Figure 1B, Supplementary table 3), with the genes with the lowest value defining the MDR. Chromosome band 1p22.1 had lower values than 1p22.2 and 1p22.3. Of interest, patients MM05 and MM02, showed highly focal deletions of 304 kb and 366 kb with an overlap of only 58 kb. The deletion in MM05 affected the 5’ parts of the EVI5 and MTF2 genes, as well as the entire RPL5 and FAM69A genes and was confirmed by FISH (Figure 1C-D). For patient MM02, it was clear that the entire GFI1 and
Europe PMC Funders Author Manuscripts
EVI5 genes were deleted. The centromeric border in MM02 was hard to define on the array and by FISH, although it seemed within RPL5 (Figure 1C-D). To better delineate this centromeric border, the copy number status of the different exons of RPL5 was analyzed using MLPA (Figure 1E). This assay revealed that the deletion breakpoint was right within RPL5, with exons 1-4 deleted, whereas the 3’ of the gene was unaffected. We thus confirmed that RPL5 was part of the MDR. In conclusion, the MDR on 1p22.1 was restricted to a 58 kb region in our cohort, encompassing the 5’ parts of EVI5 and RPL5. EVI5 is a modulator of cell cycle progression, cytokinesis, and cellular membrane traffic. RPL5 encodes ribosomal protein L5, one of the 81 protein components of the ribosome.
RPL5 and EVI5 are the genes on 1p22.1 with most predicted functionally impairing
mutations
We reasoned that a relevant tumor suppressor might also be targeted by mutations.
Therefore, integration of the copy number data with mutation data might help in pinpointing relevant genes. Exome-wide mutation screening in large MM cohorts has been performed.4– 7 Whereas mutations in genes on 1p22 are rare in all of these studies, RPL5 was
significantly mutated in one study with an incidence of 2/84 (2.4%).4 We analyzed the mutational load of all 1p22.1 genes in the MMRC exome data of 203 patients6 and calculated a mutation score for each gene on 1p22.1 (with a higher score referring to more mutations in a gene that are likely to impair protein function) (Figure 2A, Supplementary tables 4-5). Whereas EPHX4, a gene outside the MDR, had a high mutation score because of a relatively high number of gene size corrected mutations with low predicted functional impact, the EVI5 and RPL5 genes had the highest mutation scores (Figure 1B, Figure 2A).
EVI5 and RPL5 mRNA levels are lower in 1p22.1 deleted cases
Next, we tested if deletion of 1p22 reduces RPL5 and/or EVI5 expression levels. No high quality RNA was available from our patients analyzed by copy number arrays. Therefore, we analyzed the association between gene expression and copy number status in the MMRC cohort. For both genes, expression levels were significantly lower in 1p22 deleted cases as compared to non-deleted cases (p<0.0001) (Figure 2B). However, for EVI5, there was less overlap in expression levels between 1p22 wild type and deleted cases than for RPL5, as reflected by a slightly larger fold change in expression for EVI5 than for RPL5 when comparing deleted versus non-deleted cases (0.59 versus 0.71).
Low EVI5 and RPL5 expression correlates with shorter PFS and OS in newly diagnosed but not in relapse cases
1p22 deletion is associated with lower PFS and OS in newly diagnosed MM.13 Since 1p22 deletion status was not available for the trial data we had access to, we could not confirm this previously described correlation. We tested however if EVI5 and or RPL5 expression levels can mirror the bad prognosis of 1p22 deletion. Cox regression analysis on the data from the phase III HOVON-65/ GMMG-HD4 trial (referred to as HOVON-65 later on) on newly diagnosed cases demonstrated that lower RPL5 levels were associated with shorter PFS and OS (Table 1). In agreement with this, Kaplan-Meier analysis showed a lower median PFS and OS in patients with RPL5 expression below median (‘RPL5 low’) than in patients with RPL5 expression above median (‘RPL5 high’) (Figure 3A). However, in the
Europe PMC Funders Author Manuscripts
APEX trial on relapsed patients, no association between RPL5 levels and survival was found (Supplementary figure 2; Table 1). Similarly, low EVI5 expression was associated with worse PFS and OS in the HOVON-65 but not in the APEX trial (Figure 3B and
Supplementary figure 2; Table 1). Optimal cutoff for RPL5 expression in relation to survival in the HOVON-65 trial was determined at the 22.5% lowest RPL5 expressers. Using this cutoff instead of median RPL5 expression gave a superior separation of patients in the HOVON-65 trial as well as in a validation cohort for which OS data were available in the R2: Genomics Analysis and Visualization Platform (Supplementary figure 3A-D). For EVI5 expression median expression was close to the best cutoff for PFS in the HOVON-65 trial while for OS, the optimal cutoff was determined at the 31.5% lowest EVI5 expressers. Application of this cutoff in the validation cohort in R2 again confirmed the superior separation (Supplementary figure 3E-G).
Bortezomib responders express lower levels of RPL5 and other ribosomal protein and translation genes
Proteasome inhibitors are now included in most therapeutic schemes of MM patients. Cellular protein metabolism and homeostasis, which are probably affected by proteasome inhibitors, might also be altered by reduced expression levels of a ribosomal protein like RPL5. To investigate this potential association, data from the APEX clinical trial were analyzed. In this trial, relapse patients were treated with bortezomib or dexamethasone as single agent.17 In the bortezomib arm of the trial (n=169), RPL5 mRNA expression was significantly lower in the bortezomib responders than in non-responders (fold change responders versus non-responders: 0.68, p<0.0001) (Figure 4A). When analyzing all differentially expressed genes between responders and non-responders in this trial arm, 1211 probe sets were significant (adjusted p-value < 0.2). Interestingly, the 2 probe sets that reliably detect RPL5 ranked on the 8th and 387th position when listing the genes by significance (adjusted p-values 0.014 and 0.112) (Supplementary table 6). EVI5 was not present in this list of significant probe sets. The top 20 of differentially expressed probe sets seemed enriched for genes involved in translation (RPS7, RPL5, RPS21, EIF3M, RPS29 and EIF3H) (Table 2). In agreement with this and with previous results18, GSEA revealed the ribosome as top downregulated KEGG pathway in bortezomib responders versus non-responders (Figure 4B, Supplementary table 7). Downregulation of the other ribosomal and translation associated genes besides RPL5 in our top 20 did not seem to be caused by 1p22 deletion associated downregulation of RPL5, because these genes did not differ in
expression level between 1p22 deleted and non-deleted cases (Supplementary figure 4). However, expression of RPL5 did correlate with expression of each of these other genes (Supplementary figure 5), suggesting that other mechanisms besides 1p22 deletion are regulating expression of this entire ribosome – translation gene set in MM.
Based on Cox regression analysis, only RPL5 expression was significantly associated with both PFS and OS (Supplementary figure 6A). We also ran GSEA comparing the genes differentially expressed between bortezomib responders and non-responders versus gene sets corresponding to each chromosome cytoband. Besides 1p22, region 14q was the only other one in the list showing recurrent deletions in MM (Supplementary Table 8). On 1p22, four additional genes besides RPL5 were in the list of differentially expressed genes in
Europe PMC Funders Author Manuscripts
bortezomib responders, but none ranked as high as RPL5 (SH3GLB1: position 841 in ranked list, LRRC8S: 157th, DR1: 342th and 643th and ZNF644: 756th) (Supplementary Table 6). These results suggest that although some other genes on 1p22 correlate with bortezomib response, expression of RPL5 is the best singular predictor. This is probably due to additional effects regulating the expression of RPL5 in MM patients, possibly regulating a set of ribosomal/translational genes as a whole. As such, in relation to bortezomib response, RPL5 expression acts as a biomarker independent of 1p22 deletion. ROC analysis was performed to find an optimal cutoff to predict Bortezomib response (Supplementary figure 7).
RPL5 expression levels are associated with the survival benefit of bortezomib
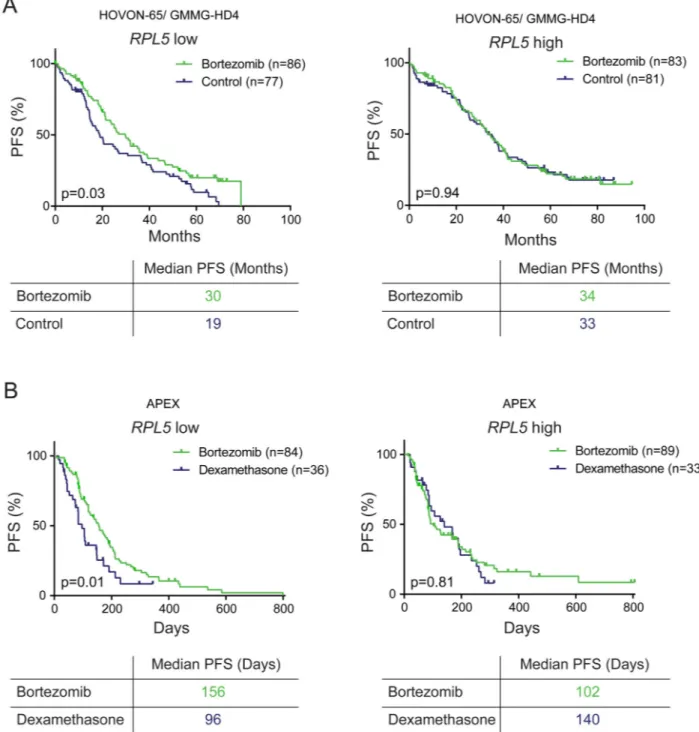
The association between RPL5 expression levels and clinical bortezomib response raised the question whether RPL5 levels also influence the survival benefit of bortezomib treatment. To address this question, we divided the patients from the HOVON-65 trial in two groups according to RPL5 expression levels below or above median, and compared survival in the bortezomib versus non-bortezomib arm in this trial. PFS of patients with low RPL5 expression was significantly raised when they were treated on the bortezomib arm to the point that their PFS did not differ significantly anymore with PFS of RPL5 high patients (median PFS bortezomib protocol 30 months versus 19 months for non-bortezomib, p=0.03; Figure 5A, left). On the other hand PFS of RPL5 high patients was not influenced by bortezomib (median PFS 34 months versus 33 months, p=0.94; Figure 5A, right). These findings were confirmed on the PFS data from the APEX trial (Figure 5B). We performed the same analyses for EVI5, but low levels of this gene did not significantly correlate with better PFS upon bortezomib treatment (Supplementary figure 8). Cox regression analysis was also performed on the other ribosome/translation components found in the GSEA analysis. Besides low RPL5 expression, only low RPS7 expression correlated with improved PFS on bortezomib treatment in the HOVON-65 and APEX trials (Supplementary figure 6B-C).
Discussion
Cytoband 1p22 is deleted in ≥20% of MM patients, although no tumor suppressors have been identified. Previously, an MDR encompassing 35 genes was defined with MTF2 and TMED5 proposed as candidate tumor suppressors. However, no mutations were found in these genes, low MTF2 expression does not affect survival, and the association between low TMED5 expression and shorter survival is only borderline significant.11,12
We studied a cohort of 35 advanced MM patients and found that 40% of them carried a 1p22 deletion with two patients having a focal deletion in the region. As such, we delineated a 58 kb MDR on 1p22.1 in our cohort encompassing only two genes: EVI5 and RPL5.
Interestingly, the genes in our MDR are also part of the most commonly deleted region on 1p22 in the public MMRC cohort (Supplementary figure 9). The lower resolution of the arrays used to analyze the MMRC cohort may however prohibit detection of smaller lesions affecting these genes. It is also worth noting that EVI5 and RPL5 are still part of the MRD in our cohort when removing the two cases with highly focal lesions (MM02 and MM05)
Europe PMC Funders Author Manuscripts
from our analysis, supporting that our MRD is not purely determined by only these two cases. Although mutations in EVI5 and RPL5 are rare, they are the genes in the region with the highest frequency of mutations which are predicted to impair protein function.
Additionally, as discussed below, we do find low expression of EVI5 and RPL5 to be correlated with lower PFS and OS.
Data on a potential role of EVI5 in cancer are scarce and support both tumor suppression and oncogenic functions.14,22–26 Data linking RPL5 to cancer are piling up and consistently support a tumor suppressor role. First, congenital inactivating mutations and deletions in RPL5 occur in Diamond Blackfan anemia, a rare bone marrow failure syndrome with elevated cancer risks.27,28 Also, inactivating mutations in RPL5 were recently described in T-ALL and glioblastoma29,30 and RPL5 is the only gene on 1p22 that was identified as recurrently mutated in the pan-cancer project.30–32
It is intriguing that RPL5 and EVI5 deletions are much more common than mutations. This may indicate that inactivation of both genes together is required to drive MM progression. On the other hand, the plot of RPL5 mRNA expression in 1p22 deleted versus non-deleted cases (Figure 2B) indicates that there are cases in which deletion status is a bad predictor of RPL5 expression level, suggesting that other mechanisms besides 1p22 deletion can downregulate RPL5 expression in MM.
In the second part of this study, we looked into the clinical relevance of RPL5 and EVI5 expression levels in MM. First of all, we observed a worse PFS and OS in cases with low RPL5 and EVI5 mRNA levels in the phase III HOVON-65/ GMMG-HD4 trial on newly diagnosed patients, but not in the APEX trial on relapsed patients. These data are in line with the known poor prognosis associated with 1p22 deletion at diagnosis.13 As far as we are aware, no data are available on the prognostic value of 1p22 lesions in relapse.
Secondly, we found an association between low RPL5 mRNA levels and initial response to bortezomib in relapse patients. Due to the lack of copy number data of the patients in the HOVON-65 and APEX trials, we could not test association between 1p22 deletion and bortezomib response. Our GSEA analysis for chromosomal regions enriched in the signature of responders did identify cytoband 1p22, but this enrichment was not as convincing as the enrichment we saw for downregulation of ribosome components. These results again indicate that the expression of ribosomal proteins is downregulated by additional mechanisms other than 1p22 deletion, which may make expression levels of ribosomal proteins and RPL5 in particular, more reliable to stratify patients for bortezomib response than 1p22 deletion. Although RPL5 expression may be useful to predict response to bortezomib in relapse patients, validation in an independent dataset is required. In addition, in the relapse patients tested, RPL5 levels were not perfectly associated with response, suggesting that adding as yet unknown markers may achieve this.
Thirdly, survival analysis showed that in addition to initial response, low RPL5 expression is also correlated with significantly longer PFS for patients treated with bortezomib both upon diagnosis and after relapse. Unfortunately, we were unable to analyze OS data because of cross-over of patients with progressive disease to an alternative treatment in both trials.16
Europe PMC Funders Author Manuscripts
Although the introduction of bortezomib has greatly improved prognosis of MM, it has been shown before that outcomes vary significantly among patient groups.8, 33 Therefore, Terragna et al. recently aimed to molecularly characterize complete response (CR) to bortezomib in diagnostic MM. In line with our results, they found loss of a region on 1p22 to be the CNV most significantly associated with CR after bortezomib treatment.34 Interestingly, the 660 kb region identified by them includes EVI5 but not RPL5. However, the size of RPL5 and the resolution of their copy number arrays may prevent proper delineation of the boundary of the deleted area, as we also needed to perform MLPA and FISH to confirm that RPL5 was included in one of our focal deletions. Additionally, they list another overlapping region on 1p22 as significantly associated with CR that does include RPL5. Terragna and colleagues did not find RPL5 to be significantly downregulated on mRNA level in CR cases. We suspect however that this could be because of the limited number of patients they analyzed. We also only see a slight reduction in the MMRC cohort which might escape statistical cutoff in smaller cohorts.
Previously, mutations in NRAS have been associated with lower response rates to single-agent bortezomib treatment35 while high tight junction protein 1 (TJP1) mRNA expression has been linked to a greater likelihood of responding to bortezomib.36,37 Indeed, both NRAS and TJP1 are ranked highly in our list of genes differentially expressed between responders and non-responders (Supplementary table 6). Additionally, proteomics profiling on diagnostic MM patient cells revealed that responders of bortezomib based protocols are characterized by altered expression of EIF2 signaling and by extension in refractory patients by altered expression of a subset of ribosomal proteins.38
In conclusion, our genetic analyses narrow down the MDR on 1p22 to two genes: EVI5 and RPL5, although the exact role of these genes in promoting MM progression remains to be determined. Survival analysis shows EVI5 and RPL5 expression are associated with worse survival in newly diagnosed patients. In addition, low RPL5 expression levels are linked to initial bortezomib response in relapse patients and to survival benefit on bortezomib treatment for both diagnostic and relapse patients, leading to a complete recovery of the bad prognosis of low RPL5 levels. We thus identify RPL5 mRNA expression as a novel
biomarker correlating with benefit from bortezomib treatment.
Supplementary Material
Refer to Web version on PubMed Central for supplementary material.
Acknowledgements
IH is recipient of an IWT strategisch basisonderzoek PhD fellowship. PVDB is FWO senior clinical investigator. This research was funded by an ERC starting grant (n°334946), FWO funding (G067015N and G084013N) and a Stichting Tegen Kanker grant (grant n° 2012-176) to KDK. We like to thank Rowan Kuiper for bio-informatic advice.
References
1. Kumar SK, Rajkumar SV, Dispenzieri A, Lacy MQ, Hayman SR, Buadi FK, et al. Improved survival in multiple myeloma and the impact of novel therapies. Blood. 2008; 111:2516–2520. [PubMed: 17975015]
Europe PMC Funders Author Manuscripts
2. Rajkumar SV. Treatment of multiple myeloma. Nat Rev Clin Oncol. 2011; 8:479–491. [PubMed: 21522124]
3. Kuehl WM, Bergsagel PL. Molecular pathogenesis of multiple myeloma and its premalignant precursor. J Clin Invest. 2012; 122:3456–3463. [PubMed: 23023717]
4. Bolli N, Avet-Loiseau H, Wedge DC, Van Loo P, Alexandrov LB, Martincorena I, et al.
Heterogeneity of genomic evolution and mutational profiles in multiple myeloma. Nat Commun. 2014; 5:2997. [PubMed: 24429703]
5. Davies FE, Morgan GJ, Walker BA, Boyle EM, Wardell CP, Murison A, et al. Mutational spectrum, copy number changes, and outcome: results of a sequencing study of patients with newly diagnosed myeloma. J Clin Oncol. 2015; 33:3911–3920. [PubMed: 26282654]
6. Lohr JG, Stojanov P, Carter SL, Cruz-Gordillo P, Lawrence MS, Auclair D, et al. Widespread Genetic Heterogeneity in Multiple Myeloma: Implications for Targeted Therapy. Cancer Cell. 2014; 25:91–101. [PubMed: 24434212]
7. Walker BA, Wardell CP, Murison A, Boyle EM, Begum DB, Dahir NM, et al. APOBEC family mutational signatures are associated with poor prognosis translocations in multiple myeloma. Nat Commun. 2015; 6:6997. [PubMed: 25904160]
8. Morgan GJ, Walker BA, Davies FE. The genetic architecture of multiple myeloma. Nature Reviews Cancer. 2012; 12:335–348. [PubMed: 22495321]
9. Corre J, Munshi N, Avet-Loiseau H. Genetics of multiple myeloma: another heterogeneity level? Blood. 2015; 125:1870–1876. [PubMed: 25628468]
10. López-Corral L, Sarasquete ME, Beà S, García-Sanz R, Mateos MV, Corchete LA, et al. SNP-based mapping arrays reveal high genomic complexity in monoclonal gammopathies, from MGUS to myeloma status. Leukemia. 2012; 26:2521–9. [PubMed: 22565645]
11. Walker BA, Leone PE, Chiecchio L, Dickens NJ, Jenner MW, Boyd KD, et al. A compendium of myeloma-associated chromosomal copy number abnormalities and their prognostic value. Blood. 2010; 116:e56–e65. [PubMed: 20616218]
12. Boyd KD, Ross FM, Walker BA, Wardell CP, Tapper WJ, Chiecchio L, et al. Mapping of Chromosome 1p Deletions in Myeloma Identifies FAM46C at 1p12 and CDKN2C at 1p32.3 as Being Genes in Regions Associated with Adverse Survival. Clin Cancer Res. 2011; 17:7776–7784. [PubMed: 21994415]
13. Hebraud B, Leleu X, Lauwers-Cances V, Roussel M, Caillot D, Marit G, et al. Deletion of the 1p32 region is a major independent prognostic factor in young patients with myeloma: the IFM
experience on 1195 patients. Leukemia. 2013; 28:675–679. [PubMed: 23892719]
14. Shaughnessy JD, Zhan F, Burington BE, Huang Y, Colla S, Hanamura I, et al. A validated gene expression model of high-risk multiple myeloma is defined by deregulated expression of genes mapping to chromosome 1. Blood. 2006; 109:2276–84. [PubMed: 17105813]
15. Put N, Lemmens H, Wlodarska I, Konings P, Moreau Y, Hagemeijer A, et al. Interphase fluorescence in situ hybridization on selected plasma cells is superior in the detection of cytogenetic aberrations in plasma cell dyscrasia. Genes Chromosomes Cancer. 2010; 49 991-7-997.
16. Sonneveld P, Schmidt-Wolf IGH, van der Holt B, Jarari el L, Bertsch U, Salwender H, et al. Bortezomib Induction and Maintenance Treatment in Patients With Newly Diagnosed Multiple Myeloma: Results of the Randomized Phase III HOVON-65/ GMMG-HD4 Trial. J Clin Oncol. 2012; 30:2946–2955. [PubMed: 22802322]
17. Richardson PG, Sonneveld P, Schuster MW, Irwin D, Stadtmauer EA, Facon T, et al. Bortezomib or high-dose dexamethasone for relapsed multiple myeloma. N Engl J Med. 2005; 352:2487–98. [PubMed: 15958804]
18. Mulligan G, Mitsiades C, Bryant B, Zhan F, Chng WJ, Roels S, et al. Gene expression profiling and correlation with outcome in clinical trials of the proteasome inhibitor bortezomib. Blood. 2006; 109:3177–88. [PubMed: 17185464]
19. Ritchie ME, Phipson B, Di Wu, Hu Y, Law CW, Shi W, et al. limma powers differential expression analyses for RNA-sequencing and microarray studies. Nucleic Acids Res. 2015; 43:e47–e47. [PubMed: 25605792]
Europe PMC Funders Author Manuscripts
20. Subramanian A, Tamayo P, Mootha VK, Mukherjee S, Ebert BL, Gillette MA, et al. Gene set enrichment analysis: a knowledge-based approach for interpreting genome-wide expression profiles. Proc Natl Acad Sci USA. 2005; 102:15545-50-15550. [PubMed: 16199517] 21. Mootha VK, Lindgren CM, Eriksson K-F, Subramanian A, Sihag S, Lehar J, et al. PGC-1
α-responsive genes involved in oxidative phosphorylation are coordinately downregulated in human diabetes. Nat Genet. 2003; 34:267–273. [PubMed: 12808457]
22. Samur MK, Shah PK, Wang X, Minvielle S, Magrangeas F, Avet-Loiseau H, et al. The shaping and functional consequences of the dosage effect landscape in multiple myeloma. BMC Genomics. 2013; 14:672. [PubMed: 24088394]
23. Liao X, Buchberg AM, Jenkins NA, Copeland NG. Evi-5, a common site of retroviral integration in AKXD T-cell lymphomas, maps near Gfi-1 on mouse chromosome 5. J Virol. 1995; 69:7132–7. [PubMed: 7474133]
24. Li Y, Xu D, Bao C, Zhang Y, Chen Di, Zhao F, et al. MicroRNA-135b, a HSF1 target, promotes tumor invasion and metastasis by regulating RECK and EVI5 in hepatocellular carcinoma. Oncotarget. 2014; 6:2421–33.
25. Baron BW, Anastasi J, Bies J, Reddy PL. GFI1B, EVI5, MYB—Additional genes that cooperate with the human BCL6 gene to promote the development of lymphomas. Blood Cells. 2014; 52:68– 75.
26. Jacob B, Osato M, Yamashita N, Wang CQ, Taniuchi I, Littman DR, et al. Stem cell exhaustion due to Runx1 deficiency is prevented by Evi5 activation in leukemogenesis. Blood. 2010; 115:1610– 1620. [PubMed: 20008790]
27. Gazda HT, Sheen MR, Vlachos A, Choesmel V, O'Donohue M-F, Schneider H, et al. Ribosomal protein L5 and L11 mutations are associated with cleft palate and abnormal thumbs in Diamond-Blackfan anemia patients. Am J Hum Genet. 2008; 83:769–80. [PubMed: 19061985]
28. Vlachos A, Rosenberg PS, Atsidaftos E, Alter BP, Lipton JM. Incidence of neoplasia in Diamond Blackfan anemia: a report from the Diamond Blackfan Anemia Registry. Blood. 2012; 119:3815– 3819. [PubMed: 22362038]
29. De Keersmaecker K, Atak ZK, Li N, Vicente C, Patchett S, Girardi T, et al. Exome sequencing identifies mutation in CNOT3 and ribosomal genes RPL5 and RPL10 in T-cell acute lymphoblastic leukemia. Nat Genet. 2013; 45:186–190. [PubMed: 23263491]
30. Lawrence MS, Stojanov P, Mermel CH, Robinson JT, Garraway LA, Golub TR, et al. Discovery and saturation analysis of cancer genes across 21 tumour types. Nature. 2014; 505:495–501. [PubMed: 24390350]
31. Tamborero D, Gonzalez-Perez A, Perez-Llamas C, Deu-Pons J, Kandoth C, Reimand J, et al. Comprehensive identification of mutational cancer driver genes across 12 tumor types. Sci Rep. 2013; 3:2650. [PubMed: 24084849]
32. Kandoth C, McLellan MD, Vandin F, Ye K, Niu B, Lu C, et al. Mutational landscape and significance across 12 major cancer types. Nature. 2013; 502:333–339. [PubMed: 24132290] 33. Corre J, Avet-Loiseau H. The impact of genomics on the management of myeloma. J Natl Compr
Canc Netw. 2011; 9:1200–6. [PubMed: 21975916]
34. Terragna C, Remondini D, Martello M, Zamagni E, Pantani L, Patriarca F, et al. The genetic and genomic background of multiple myeloma patients achieving complete response after induction therapy with bortezomib, thalidomide and dexamethasone (VTD). Oncotarget. 2016; 7:9666–9679. [PubMed: 26575327]
35. Mulligan G, Lichter DI, Di Bacco A, Blakemore SJ, Berger A, Koenig E, et al. Mutation of NRAS but not KRAS significantly reduces myeloma sensitivity to single-agent bortezomib therapy. Blood. 2013; 123:632–9. [PubMed: 24335104]
36. Zhang X-D, Baladandayuthapani V, Lin HY, Barlogie B, Usmani SZ, Yang L, et al. Identification Of Tight Junction Protein (TJP)-1 As a Modulator and Biomarker Of Proteasome Inhibitor Sensitivity In Multiple Myeloma. Blood. 2013; 122:123.
37. Zhang X-D, Baladandayuthapani V, Lin H, Mulligan G, Bin Li, Esseltine D-LW, et al. Tight Junction Protein 1 Modulates Proteasome Capacity and Proteasome Inhibitor Sensitivity in Multiple Myeloma via EGFR/JAK1/STAT3 Signaling. Cancer Cell. 2016; 29:639. [PubMed: 27132469]
Europe PMC Funders Author Manuscripts
38. Dytfeld D, Rosebeck S, Kandarpa M, Mayampurath A, Mellacheruvu D, Alonge MM, et al. Proteomic profiling of naïve multiple myeloma patient plasma cells identifies pathways associated with favourable response to bortezomib-based treatment regimens. Br J Haematol. 2015; 170:66– 79. [PubMed: 25824111]
Europe PMC Funders Author Manuscripts
Figure 1. Genetic analysis of chromosomal region 1p22 reveals RPL5 and EVI5 as candidate tumor suppressors
(A) Ideogram of chromosome 1 with indication of the size of the 1p22 deletions detected in this study. (B) Average weighted log2 array ratio of 1p22 genes. Each dot in the graph represents a gene on 1p22, and genes are represented from telomeric (left, 85 Mbp) to centromeric (right, 95 Mbp). The region that shows the lowest average weighted log2 array ratio defining the MDR in our cohort is indicated in red and gene names are shown. (C) Focal 1p22.1 deletions in cases MM05 and MM02. Deleted areas are indicated by the grey shaded areas, the dark grey shaded area shows the overlapping deleted region (MDR). (D)
Europe PMC Funders Author Manuscripts
FISH with probes RP11-1E09 and RP11-456E23 on bone marrow of patients MM05 and MM02. Schematic representation of the genomic region targeted by the FISH probes is shown in panel C. Note loss of one RP11-1E09 (green) signal in MM02 and loss of one RP11-456E23 (green) signal in MM05. The latter case displayed both RP11-1E09 (red) signals, because the BAC covers a larger region than the deleted sequences in MM05. (E) MLPA assay confirming deletion of exon 1-4 of the RPL5 gene in case MM02. The assay measures copy number of exons of several ribosomal protein genes. Peaks representing signals that correspond to exons of RPL5 are indicated, with deleted exons in red and non-deleted exons in black.
Europe PMC Funders Author Manuscripts
Figure 2. EVI5 and RPL5 show the highest incidence of mutations predicted to impair protein function and their expression levels correlate with 1p22 deletion status
(A) Mutation score for all 1p22.1 genes. Mutation score per gene was calculated by taking the mutation count for each gene and by correcting this value for gene length and predicted functional impact of the mutations. The MDR identified in Figure 1B is again indicated in red. (B) Gene expression plots of EVI5 (probe set 209717_s_at) and RPL5 (200937_s_at) in 1p22 wt versus deleted cases. The red horizontal lines indicate the average value in the group and the standard deviations. p-values were calculated using a 2-tailed Mann-Whitney test. The fold change below the plot indicates the fold downregulation in 1p22 deleted cases.
Europe PMC Funders Author Manuscripts
Figure 3. Low EVI5 and RPL5 expression correlates with shorter PFS and OS in newly diagnosed but not in relapse patients
(A) Kaplan-Meier curves comparing PFS (left) and OS (right) of RPL5 low and high expressing cases in the phase III HOVON-65/ GMMG-HD4 trial. (B) PFS and OS of EVI5 low and high expressing cases in the phase III HOVON-65/ GMMG-HD4 trial. ‘Low’ and ‘high’ are defined here as expression below and above median. p-values were calculated with Log-rank tests.
Europe PMC Funders Author Manuscripts
Figure 4. Reduced expression of RPL5 and other ribosomal proteins correlates with response to bortezomib
(A) Gene expression plots of RPL5 (probe set 200937_s_at) in bortezomib responders and non-responders in the APEX trial. The red horizontal lines indicate the average value in the group and the standard deviations. P-values were calculated using a 2-tailed Mann-Whitney test. The fold change indicates the fold downregulation in responders. (B) GSEA plot supporting downregulation of the genes in KEGG pathway ‘ribosome’ in bortezomib responders.
Europe PMC Funders Author Manuscripts
Figure 5. RPL5 expression levels are associated with the benefit of bortezomib on PFS
(A) Kaplan-Meier curves comparing PFS of RPL5 low (left) and high (right) expressing patients for bortezomib versus non-bortezomib arms in the HOVON-65/ GMMG-HD4 trial. (C) Kaplan-Meier curves comparing PFS of RPL5 low (left) and high (right) expressing patients for bortezomib versus dexamethasone arms in the APEX trial. Low and high expression are defined here as below and above median. All p-values were calculated with Log-rank tests.
Europe PMC Funders Author Manuscripts
Europe PMC Funders Author Manuscripts
Europe PMC Funders Author Manuscripts
Table 1
Cox regression values
Cox regression analysis of OS and PFS (Figure 3)
PFS OS Exp (B) 95% CI p HR 95% CI p HOVON-65/GMMG-HD4 RPL5 0.81 0.70-0.93 0.003 0.78 0.65-0.93 0.006 EVI5 0.89 0.79-1.01 0.072 0.78 0.65-0.93 0.006 APEX RPL5 1 0.85-1.14 0.848 1.03 0.89-1.21 0.677 EVI5 0.98 0.85-1.12 0.731 0.89 0.76-1.04 0.149
Cox regression analysis on PFS in RPL5 low versus high expressing cases for bortezomib versus control treatment (Figure 5)
PFS Exp (B) 95% CI p HOVON-65/GMMG-HD4 RPL5 low: Bz vs. CTRL 0.67 0.47-0.96 0.03 RPL5 high: Bz vs. CTRL 0.99 0.69-1.41 0.9 APEX RPL5 low: Bz vs. CTRL 0.57 0.37-0.89 0.01 RPL5 high: Bz vs. CTRL 0.95 0.59-1.51 0.8
Europe PMC Funders Author Manuscripts
Europe PMC Funders Author Manuscripts
Table 2
Top 20 of probe sets with differential signal in bortezomib responders versus non-responders in the APEX trial
Probe Gene log2FC P adj.
210532_s_at C14orf2 -0.408 0.002 225335_at ZNF496 -0.540 0.002 217988_at CCNB1IP1 -0.590 0.002 229586_at CHD9 0.424 0.008 224985_at NRAS -0.470 0.008 224616_at DYNC1LI2 0.459 0.014 213941_x_at RPS7 -0.340 0.014 200937_s_at RPL5 ; SNORD21 -0.553 0.014 206790_s_at NDUFB1 -0.388 0.019 200834_s_at RPS21 -0.431 0.019 202232_s_at EIF3M -0.521 0.019
224841_x_at GAS5 ; SNORD44 ; SNORD47 ; SNORD74 ; SNORD76 ; SNORD77 ; SNORD79 ; SNORD80 ; SNORD81
-0.854 0.019
224741_x_at GAS5 ; SNORD44 ; SNORD47 ; SNORD74 ; SNORD76 ; SNORD77 ; SNORD79 ; SNORD80 ; SNORD81 -0.879 0.019 221180_at MAP3K19 0.580 0.019 208752_x_at NAP1L1 -0.406 0.019 213846_at COX7C -0.394 0.019 238025_at MLKL 0.607 0.019 200921_s_at BTG1 -0.666 0.019 201094_at RPS29 -0.419 0.019 201592_at EIF3H -0.383 0.020