Shape and size constraints on dust
optical properties from the Dome C
ice core, Antarctica
M. A. C. Potenza
1, S. Albani
2, B. Delmonte
3, S. Villa
1, T. Sanvito
3, B. Paroli
1, A. Pullia
1,
G. Baccolo
3,4,5, N. Mahowald
2& V. Maggi
3,5Mineral dust aerosol (dust) is widely recognized as a fundamental component of the climate system and is closely coupled with glacial-interglacial climate oscillations of the Quaternary period. However, the direct impact of dust on the energy balance of the Earth system remains poorly quantified, mainly because of uncertainties in dust radiative properties, which vary greatly over space and time. Here we provide the first direct measurements of the aerosol optical thickness of dust particles windblown to central East Antarctica (Dome C) during the last glacial maximum (LGM) and the Holocene. By applying the Single Particle Extinction and Scattering (SPES) technique and imposing preferential orientation to particles, we derive information on shape from samples of a few thousands of particles. These results highlight that clear shape variations occurring within a few years are hidden to routine measurement techniques. With this novel measurement method the optical properties of airborne dust can be directly measured from ice core samples, and can be used as input into climate model simulations. Based on simulations with an Earth System Model we suggest an effect of particle non-sphericity on dust aerosol optical depth (AOD) of about 30% compared to spheres, and differences in the order of ~10% when considering different combinations of particles shapes.
Dust influences global climate both directly, by changing the radiative properties of the atmosphere through scat-tering and absorption of solar (shortwave) and terrestrial (longwave) radiation1, and indirectly, by impacting on
cloud formation and properties2. While most modeling studies assume a spherical shape for dust particles1, detailed
analyses of modern desert dust reveal significant deviations of light scattering from scattering properties of homo-geneous spheres3–5 and highlight that the modeling of the light scattering by non-spherical particles is required for
both accurate remote sensing and improved modeling of the climate impact of modern aerosols and dust. For past climate conditions, ice cores offer a unique opportunity to study the optical properties of mineral dust aerosol and their role on climate evolution, as they preserve a pristine atmospheric input from the past. The EPICA-Dome C and Vostok Antarctic ice cores provide evidence of the significant increase in ice-age dust deposition flux that is inversely correlated with temperature, global sea level and atmospheric CO2 concentration
over the last ~800 kyrs6,7. Dust could potentially play an important role in glacial-interglacial cycles6,8, but model
simulations show that dust can potentially dampen or reinforce glacial–interglacial climate changes depending on its optical parameters9. Thus, one of the most important sources of uncertainty in paleo-climate studies is related
to the poor knowledge of dust optical properties and the way they can change under different climate conditions and within a given climate period10,11.
Optical characterization of dust in ice cores is challenging12 because (1) the dust concentration is extremely low,
especially in interglacial ice, (2) sample availability is limited if a good time resolution is desired, and (3) the parti-cle size distribution is broad (sample polydispersity), which generally reduces size resolution. The extremely low number of particles in ice core samples limits the application of traditional light scattering approaches, except for single-particle detectors. Optical particle counters (OPC) and single particle optical sizing (SPOS, single particle obscuration sensor) are effective. The former method measures the size from the scattering cross section13–15, the
latter from extinction (scattering plus absorption16,17) and it has been systematically applied in continuous flow 1Department of Physics, University of Milan, via Celoria, 16–I20133 Milan, Italy. 2Department of Earth and Atmospheric Sciences, Cornell University, Ithaca NY, USA. 3Department of Earth and Environmental Sciences, University Milano-Bicocca, Piazza della Scienza 1, I20126 Milan, Italy. 4Graduate School in Polar Sciences, University of Siena, Via Laterina 8, I53100 Siena, Italy. 5INFN, section Milano Bicocca, Piazza della Scienza, 3 - 20126 Milano Italy. Correspondence and requests for materials should be addressed to M.A.C.P. (email: [email protected]) received: 16 October 2015
accepted: 31 May 2016 Published: 16 June 2016
OPEN
www.nature.com/scientificreports/
systems for high-resolution analyses of ice cores6,18. In both cases particle size is obtained from one parameter,
thus any other feature affecting light scattering remains unknown. In particular, composition, internal structure, shape and orientation of each grain can affect the measurements19–25, introducing errors in size estimates. In addition
to optical methods, the Coulter Counter technique, based on electrical impedance, is widely applied in ice core meas-urements, mostly because of its accurate size measurement and sensitivity to low concentration levels. The Coulter Counter technique gives volume-size distributions of equivalent spherical particles without a priori assumptions on shape and composition. However, results from Coulter Counter and optical extinction methods often disagree, pri-marily because key information is missing about single particles, such as particle shape, orientation, refractive index. In this work we applied, for the first time, the Single Particle Extinction and Scattering (SPES) method26–28
to East Antarctic ice core samples from the LGM and the Holocene. We derive information about dust particle shapes (in particular the aspect ratio), which is critical to determine the intrinsic optical properties of dust, which are needed by radiative transfer models. The SPES data, here obtained at a wavelength λ = 635 nm, consist of two terms: the extinction coefficients (Cext), generally plotted on the abscissa (μ m2), and optical thickness (ρ ,
adimen-sional), plotted on the ordinate. Optical thickness is defined as ρ = k <t> (n/n0 −1), where k = 2 π /λ (λ is the
wavelength of light), <t> is the geometrical average thickness over the geometrical cross section in the transverse plane with respect to the incoming light, n and n0 are, respectively, the refractive indices of the particle and of the
surrounding medium. The SPES method is thus able to uniquely constrain dust optical properties, which is not possible with measurements from Coulter Counter or optical extinction techniques.
Optical Properties of Glacial and Holocene Dust From Dome C
The last climatic cycle provides a logical first target for the analysis of the paleodust optical properties from cen-tral East Antarctica, since glacial and Holocene dust size, concentration in ice, depositional flux, and sources are relatively well known29–31. On a global scale, LGM dust deposition rates were 2–4 times higher than during the
Holocene32,33. In central Antarctica the observed ratios were up to ~25, mostly because of enhanced dust emission
from southern South American sources and changes in dust atmospheric lifetime34.
In this work, we analyzed ice sections from the “old Dome C” ice core35 drilled in 1977–78 about 50 km
away from the site where some years later the EPICA Dome C drilling was deployed. We analyzed samples (see Methods) from both the Holocene (H1 group ~4.2 ka BP, H2 group ~7.4 ka BP) and the LGM (G1 group ~22.3 ka BP, G2 group ~24.8 ka BP). Coulter Counter and SPES measurements were performed on two aliquots of the same sample, in order to make results fully comparable.
In order to highlight the information achievable from the SPES method, we present a subset of samples dis-playing very similar Coulter Counter size distribution, but very different optical properties (determined by SPES), which appreciably affect the propagation of light in the atmosphere.
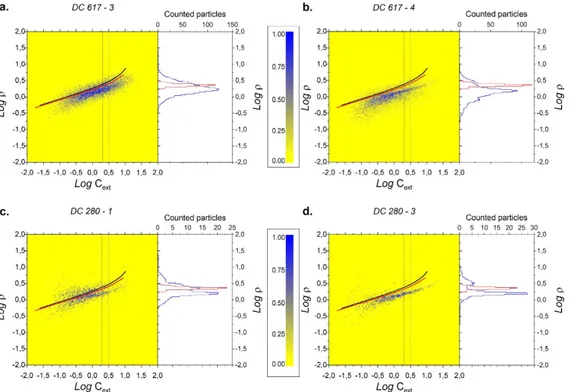
In Fig. 1a,b we show SPES results obtained from two adjacent samples (DC-617-3 and DC-617-4) from the last glacial maximum (G1 group), spanning a time period of less than 15 years overall. Figure 1c,d depict the SPES plots obtained from two Holocene samples from the H2 group (DC-280-1 and DC-280-3), covering a time period of less than 10 years. Data (Cext versus ρ) are presented as 2D histograms, the yellow-blue color scale indicating
the number of particles in each 2D bin (linear scale, yellow = 0) normalized to the maximum value of each plot (blue). Continuous lines represent the SPES results expected for spheres with a refractive index n = 1.55 + 0 i (black) and n = 1.50 + 0 i (red), very close to the indices of the minerals found in the Dome C ice core12.
SPES data in the scatterplots are characterized by an almost horizontal dispersion, which is similar for all the samples, and is mainly driven by the size polydispersity (i.e. the particles size distribution) of samples29. On the
other hand, optical thickness (ρ) illustrates a visible difference between samples from the same climate period (Fig. 1a vs. 1b, 1c vs 1d). Optical thickness is dependent on the (1) size, (2) effective refractive index, and (3) orientation of each particle. In order to better illustrate this difference, to the right of each SPES plot we show the distribution of the optical thickness within a given range of Cext (vertical blue lines), as well as the corresponding
results for the distribution of spheres (in red), for comparison. An important point to stress is that for a fixed extinction cross section (Cext ) the distribution of the optical thickness is well described by lognormal curves
whose standard deviations depend on the refractive indices of the particles as well as on their orientation imposed by shear in the liquid during the measurements (supplementary material). The range selected for Cext is motivated
by the appreciable broadening of data for the smallest Cext, (i.e. the smallest sizes) attributable to experimental
noise. Thus, information about the shape of the particles can be extracted from the region of the plots where noise is smaller, namely for Cext > 2 μ m2 (1.1 μ m in spherical equivalent diameter). Nevertheless, the whole set of data is
useful for two reasons: 1) it can be directly compared to the traditional extinction measurements; 2) a very precise sizing, based upon a method which incorporates the shape effects, can be obtained by extrapolating the proper-ties of the particles from the upper size region to the whole range. We derive information about particle shape by combining the results of numerical simulations performed for different aspect ratios, as briefly described in the supplementary material. Notice that a uniform distribution of the aspect ratio for different sizes can be reasonably assumed here, as discussed in5,36 for desert dust.
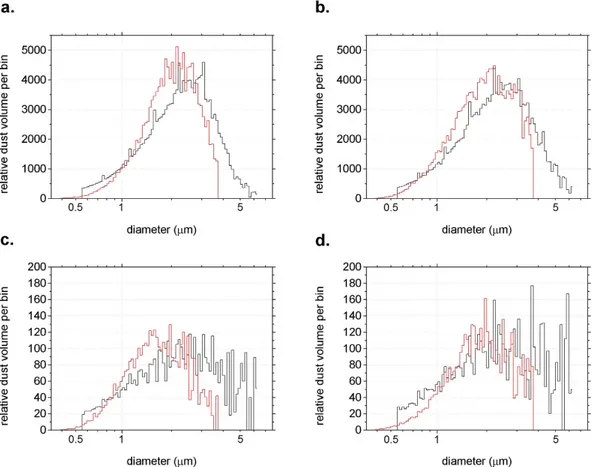
Figure 2 shows Coulter Counter volume-size distributions of samples, performed according to the protocol adopted for the EPICA Dome C ice core29, and size distributions obtained from the SPES extinction data (red).
These latter correspond to data which could be obtained with a traditional extinction instrument, interpreting the extinction cross sections as due to spherical particles of a given material. A specific algorithm was applied to convert extinction data into volume distributions (see Methods), to make this results as consistent as possible to earlier studies18. We considered the sample DC-280-3 as reference, and we used the same procedure for all the
data set. Still, small differences can be observed between DC-617-3 and DC-617-4 (Fig. 2a vs. Fig. 2b), as well as between DC-280-1 and DC-280-3 (Fig. 2c vs. 2d). We interpret these discrepancies as related to different Cext
In order to interpret SPES data we rely upon a large number of numerical simulations of the radiation scat-tered by known, non-spherical particles with given composition, sizes, shapes, aspect ratios and orientations. Almost 106 particles have been simulated and the results organized in such a way to build a benchmark of
numer-ical results in terms of ρ and Cext. This approach is well described elsewhere37, and some examples are reported in
the supplementary material (Fig. SM4). Figure 1a,d show the typical populations obtained for oblate and prolate particles, respectively37. In Fig. 1b the simultaneous presence of oblate and prolate particles is evident from the
superposition of two optical thickness distributions with different widths, and we can estimate a population of 75% ± 10% oblates and 25% ± 10% prolates. In Fig. 1c we have evidence of a mixture of prolate and isometric particles, as evident from the bimodal distribution of Log ρ, in which one of the modes is close to the sphere lines. Here a population of 60% ± 10% prolates and 40% ± 10% spheres is estimated. On the basis of the numerical simulations it is possible to extract information about the aspect ratio of dust particles. The modes of the aspect ratio distributions are 0.2 ± 0.1 (oblates, Fig. 1a) and 3.5 ± 1.3 (prolates Fig. 1d). Although the method is based upon optical measurements, strictly speaking we retrieve the geometric aspect ratio (methods).
No independent direct check is possible on these results, but independent SPES measurements have been per-formed on calcined standard reference materials of known composition for which precise numerical simulations for the expected shapes are possible (Fig. SM2). These results support our interpretation of ice core data.
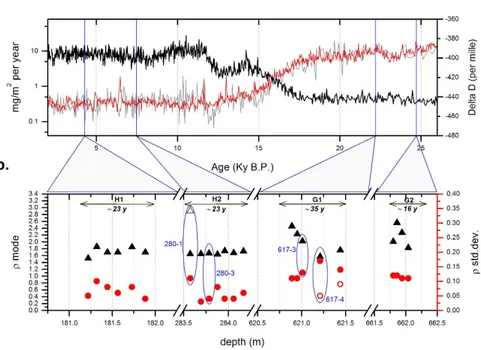
In Fig. 3a we show the chronostratigraphic position of the groups of samples selected for this study from the old Dome C ice core with respect to the EPICA-Dome C stable isotope (paleo-temperature proxy38) and
dust flux6 records. In Fig. 3b we show the mode and standard deviation of the optical thickness distributions
obtained for 2 μ m2 < C
ext < 3.1 μ m2 (0.3 < Log Cext < 0.5), e.g. corresponding to the features of the curves in the
right panels of Fig. 1. Discriminating between ensembles of particles having different grain shapes is possible, in particular between samples dominated by oblate particles (DC-617-3, Fig. 1a), which reveal a large spread and a significant standard deviation in ρ , and samples characterized by a mixture of both prolate and oblate particles (DC-617-4, Fig. 1b). These latter display a distribution composed by the superposition of two lognormal curves: one characterized by a reduced spread in the vertical direction, the other by a broad vertical distribution (open and solid circle, respectively). Aeolian mineral dust at Dome C consists of a mixture of different minerals having different shapes, such as clays (illite, kaolinite, chlorite, smectite), crystalline and amorphous silica, feldspars, pyroxenes-amphiboles, metallic oxides and volcanic glasses39. We can therefore interpret our data as resulting
from a population of particles that are preferentially oblate in some cases, and both oblate and prolate in others.
Figure 1. SPES optical data from the old Dome C ice core represented as the adimensional optical thickness (ρ) versus extinction coefficient (Cext) (μm2). Data are 2D histograms, the color scale indicating
the number of particles (yellow = 0, blue = 1, linear scale) in each 2D bin, normalized to the maximum value of each plot. In a and b two adjacent glacial samples (LGM, ca. 22300 yrs B.P.) are considered (DC-617-3 and 617-4 respectively); in c and d we show two Holocene samples (ca. 7430–7440 yrs B.P.; 280-1 and DC-280-3). Time interval is < 15 years for a and b, < 10 years for c and d. Continuous lines represent the expected SPES results for spheres with refractive index n = 1.55 (black) and n = 1.50 (red), very close to the indices of the minerals found in the Dome C ice core (Gaudichet et al.39). Each plot shows the optical thickness distribution
evaluated in the Cext range within the vertical lines which is 2 μ m2 < Cext < 3.1 μ m2 (blue SPES data, red
www.nature.com/scientificreports/
Interestingly, the standard deviation of ρ is systematically higher during the LGM (average st.dev. 0.12) with respect to the Holocene (average st.dev. 0.06). This preliminary observation suggests a different shape of particles in the two climatic periods, possibly related to a different mineralogical mix. An interesting note is that preferen-tial shape is not constant in the same climatic period, but it can vary sharply within a decade, both in glacial and Holocene climate conditions. Here we do not discuss the reason for this interesting and potentially informative high frequency mineralogical variability, but only the potential climate implications of the observed variety of shapes and associated optical properties.
Climate Implications.
Given the novelty of our approach, which provides access to properties hidden to traditional methods, we will briefly examine and discuss the corresponding effects on the airborne particles. Radiative transfer models embedded in Earth System Models usually calculate the alteration of irradiance fluxes by aerosols in the atmosphere, by combining the simulated mass mixing ratios of specific constituents and their prescribed (size- and wavelength-dependent) intrinsic optical properties (e.g. mass extinction efficiency (MEE), single scattering albedo (SSA), asymmetry parameter). Those latter can be derived off-line based on information of the particles physical properties assuming a homogeneous composition40.Different sets of values of MEE for airborne particles (Fig. 4a) were derived by numerical simulations of the particles used to interpret the data presented in Fig. 1, taking also into account aspect ratios. Different shapes have been considered (ellipsoids, cylinders, prisms with 3,4,5,6 lateral faces), but negligible differences in the optical properties were observed for a given aspect ratio; in contrast, important changes occur upon changing the aspect ratios26. We thus considered prisms with aspect ratios in the range 3–4 for prolate particles and 0.25–0.35 for
oblate particles. No surface roughness has been included in our simulations. For comparison we also generated a reference data set for spherical particles with the same volume-equivalent size distribution, thus mimicking the Coulter Counter measurements. We consider four sets of optical properties (Fig. 4a), obtained from samples that show similar particle size distributions when measured with a Coulter Counter. This will allow us to explore and quantify the space of potential variability in the climate impacts of changing optical properties, which is hidden when not considering variability in particles shapes.
We consider the first-order impacts of different sets of optical properties derived from the SPES analyses on atmospheric dust AOD, based on dust mixing ratios simulated by the Community Earth System Model (CESM) tuned to match size and deposition at Dome C41 (supplementary information). In the model, CESM default values
of dust optical properties have been replaced by SPES-derived optical properties, calculated for each size bin that is used in the model (4 bins). The set of MEE calculated from SPES assuming spheres is very similar (Fig. 4a) to
Figure 2. Coulter counter size distributions (black) for samples shown in Fig. 1 and volume-size distributions obtained from SPES Cext data (red). The SPES size range is limited between 0.5 and 3 μ m
those currently used in CESM41, which are based on AERONET and TOMS retrievals42 which assume spherical
properties, giving additional confidence in our results. On the other hand, the measured samples consisting of mixtures of prolate, oblate and isometric particles (the latter approximate spheres) show substantial differences compared to the spheres, especially for particles in the 1.0–2.5 μ m range. Smaller particles are more efficient scat-terers, but for a given dust mass, the net effect on atmospheric extinction is modulated by the particles size distri-butions, which tend to be fine at the southern high latitudes (Fig. 4b). As the atmospheric dust load decreases far from the dust source areas, so does the dust AOD at 550 nm (Fig. 4c).
Next we isolate the effects on dust AOD of a realistic range of variation in dust load, size distribution and particle shape. Simulations suggest a 35-fold variability in dust AOD on the Southern Ocean and Antarctica on glacial-interglacial time scales (Fig. 4d), mostly related to variations in dust load41. Considering the effects of size
alone (i.e. same total dust mixing ratios), constrained by the LGM and Holocene size distributions, model simu-lations suggest an increase of ~30% in dust AOD at high southern latitudes (Fig. 4e), associated with the finer size distributions observed during the LGM (Fig. 4b). The amplitude of the change in AOD due to size is the same as of considering actual particles shapes instead of assuming spheres (Fig. 4f), which shows the importance of our novel measurement. To reiterate with an example, on the basis of the numerical simulations, the average Cext for
the sample DC-617-3 is 3.14 μ m2 and 4.57 μ m2 for spheres and oblate particles respectively, whereas those same
samples are very similar when only considering their extinction properties (Fig. 2c,d).
In addition, the net effect of considering the actual variability in particles shapes is also significant and can contribute changes in AOD up to ~10% (Fig. 4g,h). The effects of changing shapes is not spatially uniform: the anomalies vary as the particle size distributions shift from coarse to fine along the transport routes, highlighting again the modulation of this signal by the size distributions, which could result in sharpening or damping the gra-dients in dust AOD. Note that in the real world spatial and temporal variations in load, particle size distributions and shape will combine together to determine the net effects on atmospheric extinction.
Future analyses that include effects from absorption and the partitioning of back- versus forward-scattering will allow more detailed investigations of the direct impacts of dust on the atmospheric energy balance based on SPES measurements. The impact of shape variations on AOD tend to be linear with radiative forcing8;
there-fore, once regional information will be known about the shape of particles through this innovative methodology, significant changes to calculated radiative forcing will result. The important role of mineral dust aerosol in past climate changes has been widely recognized. While previous studies highlighted the role of particle shape3–5 in
association to mineralogy and size in determining dust impacts on climate, we applied here for the first time the SPES method to measure dust optical properties and shape in ice cores. We anticipate that this technique will provide important constraints to climate and paleoclimate models determining the dust radiative forcing and its role on climate change.
Figure 3. (a) EPICA-Dome C stable isotope profile (Jouzel et al.38; black line) and dust flux records from
Lambert et al.6, and Delmonte et al. 2008 (Coulter Counter in grey, and Abacus in red); vertical blue lines mark
the average position of the four set of samples (H1, H2, G1, G2) selected for this study from the old Dome C ice core. (b) Mode (triangles) and standard deviation (circles) of the optical thickness distributions from SPES data. The two values reported for sampleDC-617-4 (solid and open circle), are related to the presence of two populations (Fig. 1b). Ellipses evidence results obtained from samples discussed in Figs 1 and 2. Experimental errors are comparable to the size of the symbols.
www.nature.com/scientificreports/
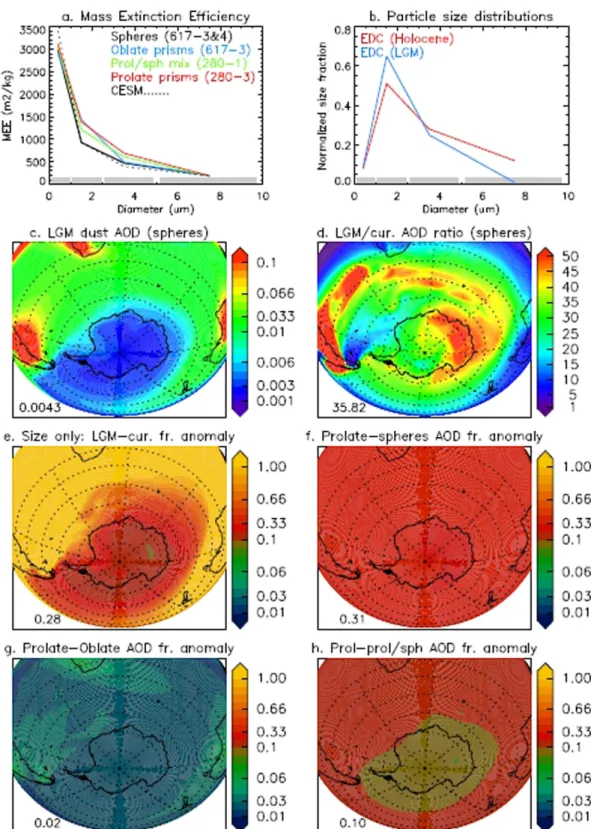
Figure 4. Effects of the particle size distributions and shapes on dust AOD evaluated as described in the text. (a) Size-resolved (on the CESM size bins, identified by the grey solid lines on the x-axis) sets of MEE (um2)
from the SPES analyses (solid lines), and as used in the CESM [Albani et al.41] (dotted line). (b) Normalized
particle size distributions (on the CESM size bins) from the EPICA Dome C (EDC) core for the LGM and Holocene periods (average distributions) [Delmonte et al.30]. (c) Atmospheric column extinction (AOD) due
to dust, assuming (1) the dust mixing ratio and size distributions from a CESM simulation of the LGM climate (C4fn-lgm) [Albani et al.41], tuned to match dust deposition and size distributions at EDC, and (2) the MEE
determined from SPES analyses of sample DC-617-3&4, assuming spherical particles. (d) LGM/current climate ratio of dust AOD, calculated assuming the dust mixing ratio and size distributions from the CESM simulations (C4fn & C4fn-lgm) [Albani et al.41], tuned to match dust deposition and size distributions at EDC, and the MEE
determined from SPES analyses of sample DC-617-3&4, assuming spherical particles. (e) Dust AOD anomaly for changes in dust size distributions alone (comparing the LGM vs current size distributions), assuming the dust load of the tuned current climate simulation of d) and MEE of spheres (DC-617-3&4). (f) Anomaly
Methods
In this work we apply the novel single particle extinction and scattering method (SPES); it provides two inde-pendent parameters for each detected particle and is particularly efficient for very diluted and polydisperse sam-ples such as Antarctic ice. This approach is based upon combined and simultaneous measurements of the power reduction of a laser beam in presence of the particle (i.e. extinction by very definition) and the interference between the intense transmitted beam and the much fainter forward scattered wave (i.e. scattering). In such a way it is possible to access the amplitude and phase of the scattered wave (i.e. the real and imaginary parts of the complex field amplitude43,44, see supplementary information). From SPES data each particle is thus characterized
by the extinction cross section, Cext, and the optical thickness ρ = k <t> (n/n0 −1), where k = 2 π /λ (λ is the
wavelength of light), <t> is the geometrical average thickness over the geometrical cross section in the transverse plane with respect to the incoming light, n and n0 are respectively the refractive indices of the particle and of the
surrounding medium. By imposing preferential orientations to the particles through shear of meltwater sample flowing into the scattering volume, we are able to evidence non-spherical particles (oblate and prolate) and to obtain a good estimate of the average aspect ratio from the measurement of a few thousands of particles (supple-mentary material). A benchmark of expected SPES data has been obtained from accurate numerical simulations of about 106 representative particles by means of the A-DDA simulation code45,46. We have simulated the scattered
fields from single particles with diameters from 0.5 to 5 μ m, refractive index from n = 1.45 to 1.60, aspect ratios between 0.1 to 1 (oblate) and from 1 to 8 (prolate). For practical reasons we define the aspect ratio as the ratio between the smaller dimension and that perpendicular to it for oblate particles, and the inverse for prolates. It is thus possible to build look up tables for inferring the distribution of the aspect ratios, and therefore to achieve an accurate sizing based upon the actual shapes. Notice that, despite the optical approach, in such a way SPES partially overcomes the typical limitation of optical methods, namely to give the so called “optical diameter” and “optical aspect ratio”. Indeed, just by recovering the aspect ratio from the geometrical characteristics of the parti-cles through proper numerical simulations, we directly provide an estimate of the geometrical aspect ratio. As a direct consequence, also the size is estimated on the basis of the true shapes, instead of the common optical size which is the diameter of a sphere having the measured cross section. These results are of great importance when extracting optical properties of the airborne particles, as discussed here.
It is impossible in general to assign one size value to a given Cext, as it is evident in the supplementary
mate-rial Fig. SM3 for the oblate particles case. For prolates, conversely, it is easier to recover particle size thanks to a one-to-one relationship between size and Cext (see Fig. 1d, DC-280-3), as explained in the supplementary
mate-rial. Therefore, by following the same procedure adopted with traditional SPOS technique, we have recovered the size distribution from our extinction measurements on sample DC-280-3 (Fig. 2d, red) by assuming spherical shapes and fitting a free parameter ultimately related to the apparent refractive index, or to the optical thickness itself, to reproduce the corresponding Coulter measurements (Fig. 2d, black). The same conversion with the same parameter has been applied to the other samples. Discrepancies among Coulter and extinction in Fig. 2(a–d) can be reasonably attributed to shape effects.
The simulated dust mixing ratios, which were used as a basis for the estimation of the effects on atmospheric dust AOD of the newly retrieved optical properties, were performed with the Community Earth System Model and extensively validated for different climate conditions (including present-day and the LGM) against climate and dust observations41,47,48 (see supplementary material). For each horizontal grid cell in the model:
= ∑= ∗
DustAODVIS b4 1MEEb VIS DLb
, where b represents each of the four size bins in the CESM dust model
(spanning 0.1–10 μ m in diameter), MEEb,VIS is the size-dependent MEE in the visible wavelengths spectral band
(i.e. 550 nm), and DLb is the column dust loading in each size class.
References
1. Tegen, I. & Lacis, A. A. Modeling of particle size distribution and its influence on the radiative properties of mineral dust aerosol.
J. Geophys. Res. 101(D14), 19237–19244 (1996).
2. Carslaw, K. S. et al. A review of natural aerosol interactions and feedbacks within the Earth system. Atmos. Chem. Phys. 10, 1701–1737 (2010).
3. Mishchenko, M. I., Hovenier, J. W. & Travis. Light Scattering by Nonspherical Particles. (Academic Press, 2000).
4. Dubovik, O. Variability of Absorption and Optical Properties of Key Aerosol Types Observed in Worldwide Locations. J. Atmos. Sci.
59, 590–608 (2002).
5. Dubovik, O. et al. Application of spheroid models to account for aerosol particle nonsphericity in remote sensing of desert dust.
J. Geophys. Res. 111, D11208 (2006).
6. Lambert, F. et al. Dust-climate couplings over the past 800,000 years from the EPICA Dome C ice core. Nature 452, 616–619 (2008). 7. Petit, J. R. et al. Climate and atmospheric history of the past 420,000 years from the Vostok ice core, Antarctica. Nature 399, 429–436
(1999).
8. Lambert, F. et al. The role of mineral-dust aerosols in polar temperature amplification. Nature Clim. Change 3(5), 487–491 (2013). 9. Bauer, E. & Ganopolski, A. Sensitivity simulations with direct shortwave radiative forcing by aeolian dust during glacial cycles.
Climate of the Past 10, 1333–1348 (2014).
10. Formenti, P. et al. Recent progress in understanding physical and chemical properties of African and Asian mineral dust. Atmos.
Chem. Phys. 11, 8231–8256 (2011).
(expressed as fraction) between the dust AOD based on MEE assuming prolate prisms (DC-280-3) with respect to that of spheres, assuming the same dust size distributions for current climate as in (d). (g) Same as (f), comparing the cases with prolate (DC-280-3) and oblate (DC-617-3) prisms. (h) Same as (f), comparing the cases with prolate 280-3) prisms and a mixture (1:0.6) of prolate prisms and isometric particles (DC-280-1). Numbers in the bottom left corner of panels c-f represent the average value of the respective fields for latitudes < 60 S. This figure was plotted by S. Albani specifically for this paper by means of an own-made script with IDL. IDL Version 8.2.1 (linux x86_64 m64). (c) 2012, Exelis Visual Information Solutions, Inc.
www.nature.com/scientificreports/
11. Mahowald, N. et al. The size distribution of desert dust aerosols and its impact on the Earth system. Aeolian Research 15, 53–71 (2014).
12. Royer, A., De Angelis, M. & Petit, J. R. A 30000 Year record of Physical and Optical properties of microparticles from an East Antarctic Ice Core and implications for Paleoclimate Reconstruction Models. Clim. Chang. 5, 381–412 (1983).
13. Sachweh, B., Umhauer, H., Ebert, F., Buttner, H. & Friehmelt, R. In situ optical particle counter with improved coincidence error correction for number concentrations up to 10(7) particles cm(-3). J. Aerosol Sci. 29, 1075–1086 (1998).
14. Terrell, E., Beal, D. & Gromala, J. Understanding Liquid Particle Counters (PMS Inc. Boulder, Colorado, 2006).
15. Heim, M., Mullins, B. J., Umhauer, H. & Kasper, G. Performance evaluation of three optical counters with an efficient “multimodal” calibration method. Aerosol Sci. 39, 1019–1031 (2008).
16. Pelssers, E. G. M., Cohen, M. A. & Fleer, G. J. Single Particle Optical Sizing (SPOS): I. Design and improved SPOS instrument and application to stable dispersions. J. Colloid Interf. Sci. 137, 350–361 (1990).
17. Ruth, U. Concentration and Size Distribution of Microparticles in the NGRIP Ice Core (Central Greenland) during the Last Glacial Period. PhD Thesis, Bremen University (2002).
18. Ruth, U., Wagenbach, D., Bigler, M., Steffensen, J. P., Röthlisberger, R. & Miller, H. High-resolution microparticle profiles at NorthGRIP, Greenland: case studies of the calcium-dust relationship. Ann. Glaciol. 35, 237–242 (2002).
19. Whitby, K. T. & Vomela, R. A. Response of Single Particle Optical Counters to Nonideal Particles. Envir. Sci. Tech. 10, 801–814 (1967). 20. Chylek, P., Grams, G. W. & Pinninck, R. G. Light Scattering by Irregular Randomly Oriented Particles. Science 193, 480–482 (1976). 21. Bohren, C. F. & Huffman, D. R. Absorption and Scattering of Light by Small Particles. (Wiley & Sons, Berlin, 1983) (1998). 22. Gebhart, J. Response of Single-Particle Optical Counters to Particles of irregular shape. Part. Part. Syst. Char. 8, 40–47 (1991). 23. Liu, Y. & Daum, P. H. The effect of refractive index on size distributions and light scattering coefficients derived from optical particle
counters. J. Aerosol Sci. 31, 945–957 (2000).
24. Tinke, A. P. et al. Particle shape and orientation in laser diffraction and static image analysis size distribution analysis of micrometer sized rectangular particles. Powder Technol. 186, 154–167 (2008).
25. Mishchenko, M. I., Travis, L. D., Kahn, R. A. & West, R. A. Modelling phase functions for dustlike tropospheric aerosols using a shape mixture of randomly oriented polydisperse spheroids. J. Geophis. Res. 102(D14), 16831–16847 (1997).
26. Potenza, M. A. C. & Milani, P. Free nanoparticle characterization by optical scattering field analysis: opportunities and perspectives.
J. Nanopart. Res. 16, 2680 (2014).
27. Potenza, M. A. C., Sanvito, T. & Pullia. Measuring the complex field scattered by single submicron particles. AIP Advances. 5, 117222 (2015).
28. Potenza, M. A. C. et al. Single particle optical extinction and scattering allows real time quantitative characterization of drug payload and degradation of polymeric nanoparticles. Nat. Sci. Rep. 5, 18228 (2015).
29. Delmonte, B., Petit, J. R. & Maggi, V. Glacial to Holocene implications of the new 27,000 year dust record from the EPICA Dome C (East Antarctica) ice core, Clim. Dynam. 18(8), 647–660 (2002).
30. Delmonte, B. et al. Dust size evidence for opposite regional atmospheric circulation changes over east Antarctica during the last climatic transition. Clim. Dynam. 23, 427–438 (2004).
31. Delmonte, B. et al. Ice core evidence for secular variability and 200-year dipolar oscillations in atmospheric circulation over East Antarctica during the Holocene. Clim. Dynam. 24, 641–654 (2005).
32. Maher, B. A. et al. Global connections between aeolian dust, climate and ocean biogeochemistry at the present day and at the last glacial maximum. Earth Sci. Rev. 99, 61–97 (2010).
33. Kohfeld, K. E. & Harrison, S. P. DIRTMAP: The geological record of dust. Earth Sci. Rev. 54, 81–114 (2001).
34. Petit, J. R. & Delmonte, B. A model for large glacial-interglacial climate-induced changes in dust and sea salt concentrations in deep ice cores (central Antarctica): paleoclimatic implications and prospects for refining ice core chronologies. Tellus 61B, 768–790 (2009). 35. Lorius, C., Merlivat, L., Jouzel, J. & Pourchet, M. A 30,000-yr isotope climatic record from Antarctic ice. Nature 280, 644–648 (1979). 36. Reid, J. S. et al. Comparison of size and morphological measurements of dust particles from Africa. J. Geophys. Res. 108, 8593 (2003). 37. Villa S. et al. Measuring shape and size of micrometric particles from the analysis of the forward scattered field. Accepted by Journal
of Applied Physics.
38. Jouzel, J. et al. Orbital and millennial Antarctic climate variability over the past 800,000 years. Science 317, 793–796 (2007). 39. Gaudichet, A., Petit, J. R., Lefevre, R. & Lorius, C. An investigation by analytical transmission electron microscopy of individual
insoluble microparticles from Antarctic (Dome C) ice core samples. Tellus B 38B, 250–261 (1986).
40. Hess, M., Koepke, P. & Schult, I. Optical properties of aerosols and clouds: The software package OPAC. Bull. Am. Meteorol. Soc. 79, 831–844 (1998).
41. Albani, S. et al. Improved dust representation in the Community Atmosphere Model. J. Adv. Model. Earth Syst. 6, 541–570 (2014). 42. Sinyuk, A., Torres, O. & Dubovik, O. Combined use of satellite and surface observations to infer the imaginary part of refractive
index of Saharan dust. Geophys. Res. Lett. 30(2), 1081 (2003).
43. Van de Hulst, H. C. Light Scattering by Small Particles. (Dover Publications, New York, 1957).
44. Potenza, M. A. C., Sabareesh, K. P. V., Alaimo, M. D., Carpineti, M. & Giglio, M. How to measure the optical thickness of scattering particles from the phase delay of scattered waves: Application to turbid samples. Phys. Rev. Lett. 105, 193901 (2010).
45. Yurkin, M. A. & Hoekstra, A. G. The discrete-dipole-approximation code ADDA: capabilities and known limitations. J. Quant.
Spectrosc. Radiat. Transfer 112, 2234–2247 (2011).
46. Hoekstra A. G., Grimminck M. D. & Sloot P. M. A. Large scale simulations of elastic light scattering by a fast discrete dipole approximation. Int. J. Mod. Phys. C 9, 87–102 (1998).
47. Albani, S. et al. Twelve thousand years of dust: the Holocene global dust cycle constrained by natural archives, Clim. Past, 11, 869–903 (2015).
48. Mahowald, N. M. et al. Change in atmospheric mineral aerosols in response to climate: Last glacial period, preindustrial, modern, and doubled carbon dioxide climates. J. Geophys. Res. 111, D10202 (2006).
Acknowledgements
We thank Dr. J.R. Petit for providing ice core samples and for useful comments to the manuscript. We acknowledge Francesco Cavaliere and Daniele Viganò for the realization of mechanical components of the instrumentation.
Author Contributions
M.A.C.P., S.A., B.D. and V.M. conceived this study. M.A.C.P. designed and realized the SPES instrument, analyzed and interpreted data; S.A. studied the climate implications; B.D. contributed to the measurements and the data interpretation; S.V. did the measurements and developed the data interpretation schemes; T.S. realized the instrument and gave support to the data interpretation; B.P. and A.P. gave support to the instrumental device; G.B. performed the Coulter measurements and interpreted data; N.M. and V.M. contributed to the general overview of the work.
Additional Information
Supplementary information accompanies this paper at http://www.nature.com/srep Competing financial interests: The authors declare no competing financial interests.
How to cite this article: Potenza, M. A. C. et al. Shape and size constraints on dust optical properties from the
Dome C ice core, Antarctica. Sci. Rep. 6, 28162; doi: 10.1038/srep28162 (2016).
This work is licensed under a Creative Commons Attribution 4.0 International License. The images or other third party material in this article are included in the article’s Creative Commons license, unless indicated otherwise in the credit line; if the material is not included under the Creative Commons license, users will need to obtain permission from the license holder to reproduce the material. To view a copy of this license, visit http://creativecommons.org/licenses/by/4.0/