UNIVERSITA’ DEGLI STUDI DI MESSINA DIPARTIMENTO DI MEDICINA CLINICA E
SPERIMENTALE Dottorato di Ricerca in Biotecnologie Mediche e Chirurgiche XXX ciclo
Hypergammaglobulinemia is a strong predictor of disease progression,
hepatocellular carcinoma development and death in patients with
compensated cirrhosis
PhD STUDENT
:Dott
. FILOMIA ROBERTOSUPERVISOR
:Index
PAGE
1
INTRODUCTION
...32
AIM
...63
PATIENTS AND METHODS
...74
STATISTICAL ANALYSIS
...95
RESULTS
...106
DISCUSSION
...137
FIGURES AND TABLES...
15Introduction
Cirrhosis represents the end stage of chronic liver disease (CLD) due to different causes,
including viral hepatitis, autoimmune and genetic illnesses, alcohol abuse and metabolic
disorders. In addition, cirrhosis itself is largely the most important risk factor for the
development of hepatocellular carcinoma (HCC). In fact, cirrhosis is a major health problem
worldwide and accounts for significant morbidity and mortality1. Moreover, its incidence is
apparently rising as a consequence of the hepatitis B virus (HBV) and hepatitis C virus (HCV)
outbreak that occurred in the second half of the past millennium, as well as of the spread of CLD
related to metabolic disorders that has been observed in the last decades. 2-4
Actually, the term cirrhosis includes clinical conditions with different grades of severity that
have been categorized by applying various scoring systems.
The natural history of cirrhosis is characterized by an asymptomatic phase, termed
‘compensated’ cirrhosis followed by a rapidly progressive phase marked by the development of
complications of portal hypertension and/or liver dysfunction, termed ‘decompensated cirrhosis’.
In the compensated phase, portal pressure may be normal or below the threshold level identified
for the development of varices or ascites (‘clinically significant portal hypertension’). As the
disease progresses, portal pressure increases and liver function decreases, resulting in the
jaundice. The development of any of these complications marks the transition from a
compensated to a decompensated phase5.
Although many prognostic models have been proposed in the last two decades to predict
mortality in cirrhosis, the Child–Pugh score is by far the most largely used both in clinical
practice and in clinical research5.
Child-Pugh (C-P) score, based on three biochemical (albumin, bilirubin and prothrombin time)
and two clinical (ascites and encephalopathy) parameters, identifies three classes (A, B, and C)
corresponding to different stages of cirrhosis6,7 .
In a systematic review D’amico et al showed that the Child–Pugh score and/or its components
was the most consistent and ‘robust’ predictor of death in cirrhosis in particular when considered
studies that included only patients with compensated cirrhosis5.
In addition to these markers of liver insufficiency, in the compensated stage, significant
predictors that come to light are those related to portal hypertension, such as the presence of
varices, splenomegaly and platelet count as well as gamma-globulin levels.
In particular, presence of esophageal varices at time of first observation was associated to a
significantly higher cumulative incidence of hepatic decompensation, HCC development and
death 8,9.
Indeed, patients in C-P class A (compensated phase) usually have a mild and often totally
asymptomatic disease that may either be clinically stable over time or may quite rapidly progress
The lack of reliable and routinely available predictors makes it difficult to foresee the clinical
Aim
The aim of this study was to evaluate the clinical/biochemical/ultrasonographic/endoscopic
parameters at the time of diagnosis and during the subsequent long-lasting follow-up in patients
with C-P class A cirrhosis due to unknown or not curable causes, with the final objective of
finding any possible predictor of clinical outcome in these patients in which the natural history
Materials and methods
Six-hundred-thirty-one consecutive patients attending the Liver Unit of the University
Hospital of Messina from January 1st, 2004 to December 31st, 2010 were diagnosed as having
C-P class A cirrhosis. Diagnosis and staging of cirrhosis were performed according to
histology in 85 cases who underwent liver biopsy and to the established clinical,
ultrasonographic, endoscopic and biochemical criteria in 187 cases. The design of this
observational cohort study foresaw the exclusion of patients with a well-defined and
potentially treatable cause of the disease. Consequently, 299 out of 631 individuals were
excluded because their cirrhosis was HBV-related (114 cases), auto-immune or primary
biliary (36 cases), alcohol-related (106 cases), or HCV related treatable with IFN-based
therapies (43 cases) that were the only therapeutic approaches available at the time of the
patients’ enrolment. Therefore, a total number of 332 patients were included in the study,
107 of whom had cryptogenic cirrhosis and 225 had HCV-related cirrhosis untreatable by
IFN, as defined by one or more of the following conditions: lack of response to previous
treatment, presence of leuko-thrombocytopenia, age >70 years or presence of major
co-morbidities that contraindicated IFN therapy. In accordance with previous studies evaluating
the clinical outcome in compensated cirrhosis6,10,11, all patients were followed-up after
diagnosis for a minimum of 60 months [to death or to orthotropic liver transplantation
(OLT)] through clinical and biochemical examinations performed every 3-6 months, US
performed every six months, and esophagogastroduodenoscopy (EGD) scheduled at intervals
according to international guidelines. 12-14 In particular, data of haematological tests included:
hemoglobin (Hb) values, counts of red blood cells (RBC), white blood cells (WBC), and
platelets (PLT); values of serum alanine aminotransferase (ALT), aspartate aminotransferase
proteins, albumin and gamma-globulin, creatinine, urea, and international normalized ratio
(INR). All data collected at basal time and at the subsequent controls were recorded in a
digitalized dataset. The study was performed in accordance with the principles of the
Declaration of Helsinki and it was approved by the Ethics Committee of the Messina
Statistical analysis
Continuous numerical variables are expressed as median and range (minimum-maximum)
and categorical variables as number and percentage. Examined continuous variables did not
present normal distribution as verified by Kolmogorov Smirnov test and the non-parametric
approach was consequently used. Mann Whitney U test was used to compare patients with
HCV and cryptogenic liver disease for continuous variables. Kruskal Wallis test was applied
in order to compare distribution of follow-up time among different categories of patients
(stable disease over time, onset of HCC and C-P class progression). For categorical variables
[such as gender, etiology, comorbidities, hypertension, diabetes and presence of esophageal
varices (EV)], χ2 test or exact Fisher test (when appropriated) was applied. Univariate Logistic Regression Models were estimated to assess the possible dependence of the
outcomes of interest (stable clinical picture over time, C-P score progression, development of
HCC, death/OLT) by all the examined variables [sex, age, body mass index (BMI), liver
disease aetiology, diabetes, presence of esophageal/gastric varices, PLT, Hb, RBC, WBC,
AST, ALT, GGT, bilirubin, albumin, gamma-globulin, cholesterol, triglycerides, INR,
creatinine, and urea]. Multivariate logistic regression models were estimated including
variables resulting significant at univariate analyses. Survival curves were plotted using the
Kaplan–Meier method, and comparisons between subgroups were performed by log-rank
test. Survival curves of patients with compensated cirrhosis at presentation included patients
who developed HCC during the study period. The Cox regression model was used to identify
prognostic factors of survival. Statistical analysis was performed using SPSS 17.0 for
Results
Three-hundred-thirty-two consecutive C-P class A cirrhotic patients with either untreatable
HCV-related (225 cases) or cryptogenic (107 cases) liver disease were enrolled. None of
them had history of liver disease decompensation and none had any evidence of bacterial
infection. According to the design of the study, 60 (42 with cryptogenic, 18 with
HCV-related cirrhosis) out of 332 patients were excluded from the final analysis because they were
either lost to follow-up (52 cases), developed HCC within twelve months after enrolment (5
cases) or developed a non-hepatic malignancy within sixty months after starting follow-up (3
cases: 1 lung cancer, 1 breast cancer, 1 leukemia). Consequently, a total of 272 cases were
finally analysed (figure 1). These patients were followed-up for a median time of 96 months
(range 21-144) by clinical/biochemical/instrumental tests. Baseline characteristics of the
included patients are reported in table 1. Comparing the two subsets of patients (HCV-related
and cryptogenic cirrhosis), no statistically significant difference concerning age, sex
distribution, BMI, arterial hypertension, portal vein diameter, presence/absence and sizes of
esophageal varices, counts of RBD, WBC and PLT, Hb values, serum albumin, bilirubin,
INR, GGT, creatinine and urea was observed at basal time. On the contrary, presence of
diabetes, higher cholesterol values, and spleen longitudinal diameter were significantly
associated with cryptogenic cirrhosis (p<0.001,p=0.02 and p=0.01 respectively), whereas
AST and ALT values were significantly higher in the HCV group (p=0.001) as was the
gamma-globulin amount (p=0.02).
Ninety-seven/272 (36%) individuals showed a stable clinical picture and no C-P class
progression over the whole follow-up period, although 21 of them developed or showed
increasing size of EV without bleeding events or other signs of liver disease deterioration.
and 24/65 (36.9%) with cryptogenic cirrhosis, p=0.80]. Seventy-one/272 additional patients
(26%) progressed towards C-P class B or C without developing HCC. Of note, the median
follow-up was comparable between patients with stable grade of liver disease over time and
patients who showed progression of C-P score grade or who developed HCC (p=0.5, by
Kruskal Wallis test) (table 2). A total number of 123 patients died during the follow-up, and
8 underwent OLT. Of these cumulative 131 individuals (48%), 88 had HCC, 31 developed
liver failure without HCC, and 4 died because of non-hepatic malignant tumors. Finally, no
statistically significant difference in terms of clinical evolution was observed between
subjects with HCV-related and cryptogenic cirrhosis (figure 2).
When we examined the possible association between all parameters collected at the time of
cirrhosis diagnosis and the study outcomes (namely, stable C-P class A over time, worsening
of C-P score, HCC development and death), the univariate logistic regression analysis
showed that a clinical picture stable over time was associated with older age, absence of
diabetes as well as of EV, levels of serum albumin >3.5gr/dl (conventionally, the lower value
in the normal range) and of gamma-globulin <1.8gr/dl (the median value in our cohort of
patients and the optimal cut-off by ROC curve), PLT >150,000 mmc3 and cholesterol values
>151 mg/ml (table 3a). Older age, absence of both diabetes and EV, serum albumin >3.5
mg/dl and serum gamma-globulin <1.8 mg/dl maintained the significant association with
disease stability of the disease at the multivariate regression analysis (p<0.001, p=0.04,
p<0.001, p=0.01, p<0.001, respectively) (table 3a).
C-P score progression was associated with younger age, HCV positivity, diabetes, presence
and size of EV, PLT <150,000 mmc, serum albumin <3.5 gr/dl, serum gamma-globulin ≥1.8
gr/dl, and lower cholesterol values. The statistical significance was maintained at the
values and hypergammaglobulinemia (p<0.001, p=0.03, p=0.01, p=0.02 respectively) (table
3b).
The univariate logistic regression analysis showed that HCC development was associated
with younger age and gammaglobulinemia ≥1.8 gr/dl, and these associations were confirmed
by multivariate regression analysis (p<0.01, p<0.001) (table 3c).
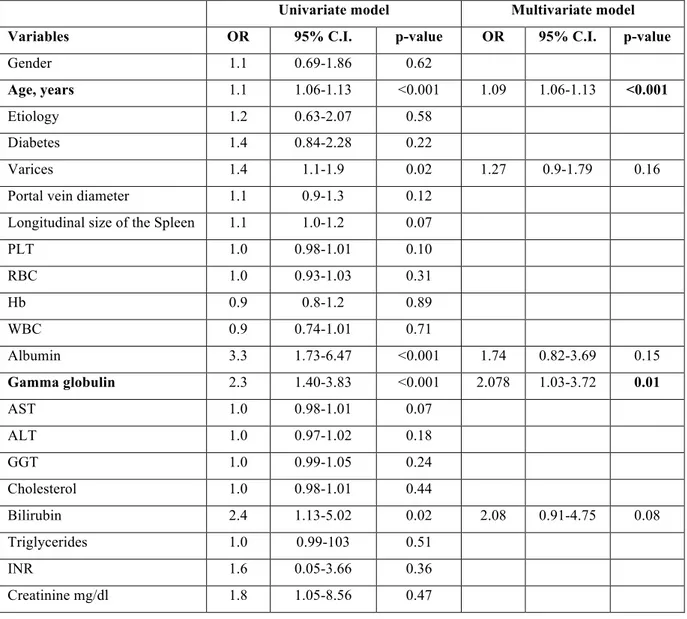
At univariate logistic regression analysis, death was associated with younger age at the time
of diagnosis as well as with the presence of EV, albumin values <3.5 g/dl, gamma-globulin
values ≥1.8 g/dl, and bilirubin levels >1 mg. Only younger age and increased
gamma-globulin values were confirmed to be associated with the death at multivariate analysis
(p<0.001, p=0.01) (table 3d). However, multivariate Cox regression analysis showed that
only gamma-globulin values ≥1.8 g/dl at the time of cirrhosis diagnosis was a significant
predictor of death (p<0.02; Hazard Ratio 1.9 95% CI). Of note, Log Rank test showed such
an effect was maintained when patients with HCC and those with progression of cirrhosis
without HCC were evaluated separately (p=0.01 and p= 0.05, respectively). Kaplan-Maier's
survival analysis confirmed that patients with gamma-globulin levels ≥1.8 mg/dl had a
significantly higher risk of death compared to those with gamma-globulin levels <1.8 mg/dl
(p<0.01) (Figure 3). This higher risk was maintained when Kaplan-Maier’s analysis was
performed on the subgroup of patients who developed HCC and on the subgroup of those
who experienced liver deterioration over time (p=0.48, p<0.01, respectively. Figure 4A and
4B). Of note, patients with hypergammaglobulinemia at baseline maintained or even
increased the gammaglobulin values over time. Indeed, the values were significantly higher
at the end of the follow-up than at basal time (p=0.003 by Will-Coxon test).
Finally, the time of occurrence of both liver decompensation events and HCC development
was significantly shorter in patients with gamma-globulin values ≥1.8 g/dl (p=0.01 and
Discussion
As expected, this study showed a spectrum of different possible outcomes in patients with
compensated cirrhosis. In fact, more than one third of the examined patients maintained the
clinical stability over the whole follow-up, whereas a similar number of cases developed
HCC. About one fourth of the patients showed evidence of liver disease deterioration and
progression of the cirrhosis score over time without developing HCC. Finally, about 50% of
the patients died or underwent OLT. Of great interest, the clinical evolution appeared to be
wholly comparable between subjects with HCV-related and cryptogenic cirrhosis in our
cohort, suggesting that the cause of the liver disease had a marginal or no influence at all on
the outcome and survival of C-P class A patients, at least in the absence of curative etiologic
therapies. Some important information have arisen from the analysis of a quite large number
of routinely available parameters collected at the time of cirrhosis diagnosis. Our results, in
fact, showed that patients in whom cirrhosis occurs at a more advanced age, who do not have
diabetes and gastro-esophageal varices, and who show albumin and gamma-globulin values
>3.5 gr/dl and <1.8 gr/dl, respectively, have a longer survival and higher chances to maintain
a stable disease over time. On the contrary, the presence at basal time of EV, lower serum
albumin and cholesterol values and hypergammaglobulinemia were predictors of C-P score
progression over time. In addition, younger cirrhotics (i.e., under 63 years of age in our
cohort) with hypergammaglobulinemia have a higher risk of developing HCC and of dying
as shown by multivariate logistic regressions analyses. In particular, values of serum
gamma-globulin ≥1.8 gr/dl increased between 2.7 and 3 times the risk of liver disease progression,
HCC development and death over time. Moreover, hypergammaglobulinemia remained the
only and strong predictor of death at Kaplan Mayer analysis in our C-P class A cirrhotics. In
a tertiary care academic center, where cirrhotics are carefully followed-up, promptly
diagnosed and treated when clinical complications and worsening of the disease occur.
Consequently, events such as – for instance – development of EV of advanced grade that are
known to negatively impact on the natural history of the cirrhosis, had no significant effect
on survival in our cohort, likely because of timely administration of therapy with
beta-blockers and/or band ligation. Long-lasting elevation of serum gamma-globulin levels is
known to be a frequent occurrence in patients with chronic liver disease, and it may be
considered an indirect marker of the persistent high grade of intrahepatic inflammation
maintained by the agent (or factor) responsible for the liver disease. 15-17 In fact, the
normalization of serum gamma-globulin values is an event that may occur in cirrhotic
patients when they undergo effective curative treatment, as observable in chronic hepatitis B
patients treated with nucleot(s)ide analogues and in many cured chronic hepatitis C subjects.
Indeed, several studies performed in the past decade had identified increased
gamma-globulin levels among the biochemical predictors of severe fibrosis and cirrhosis
development in patients with HCV as well as HBV chronic hepatitis.18-21 However, serum
gamma-globulin is usually not evaluated as a possible prognostic indicator in patients with
already well-defined cirrhosis, and indeed the most recent studies aimed at investigating the
clinical outcome in cirrhotic patients have not included evaluation of gamma-globulin values
among the parameters potentially capable of prognosticating the disease evolution.4 7-9 22-24
Our results provide clear evidence that hyper-gamma-globulinemia may help in identifying
the C-P class A cirrhotics with poorer prognosis and make gamma-globulin measurement –
that is an easy to perform and cheap test – a very useful prognostic tool that should be
Figures and tables
Figure 1 - Flowchart of enrolment. C-P class A cirrhotic patients with HCV related or cryptogenic cirrhosis
Figure 2 - Clinical outcome in 272 subjects with HCV-related (207) and cryptogenic (65) cirrhosis.
Figure 3 - Survival curves of 272 C-P class A cirrhotic patients with gamma-globulin <1.8 gr/dl (blue line) and ≥1.8 gr/dl (grey line).
Figure 4 – Survival curves in patients with gamma-globulin <1.8 gr/dl (blue line) and ≥1.8 gr/dl (grey line) according with liver decompensation events (A) and HCC development (B).
Figure 5 – Incidence of liver decompensation events (A) and HCC development (B) in patients with gamma-globulin <1.8 gr/dl (blue line) and ≥1.8 gr/dl (grey line).
Table 1. Demographic, clinical, biochemical, and instrumental data of 272 C-P
class A cirrhotic patients with untreatable HCV-related (207 cases) or
cryptogenic (65 cases) cirrhosis.
Overall Patients
HCV group Cryptogenic
group
p value
Age, years (range) 63 (34-81) 63 (34-81) 64 (34-81) 0.8
Male, N (%) 155 (57) 119 (57) 36 (55) 0.8 BMI kg/m2, Mean (±SD) 26.0 (3.8) 25.9 (3.1) 27.2(5.6) 0.07 Diabetes, N (%) 109 (40) 69 (33) 40 (62) <0.001 Esophageal varices, Absent N (%) 110 (40.4) 90 (43.5)* 20 (30.8)* Small size N (%) 115 (42.3) 88 (42.5)* 27 (41.5)* Medium size N (%) 29 (10.7) 17 (8.2)* 12(18.5)* Large size N (%) 18 (6.6) 12(5.8)* 6 (9.2)* *0.06
Portal vein diameter [25] 12.2 (9-18) 12.7 12.0 0.06
Longitudinal size of the Spleen [25] 142.3 (82-180) 139.6 150.1 0.01
Arterial Hypertension, N (%) 141 (52) 109 (53) 32 (49) 0.6 PLT, mmc x 103 112 (58-562) 113 (69-562) 101(58-273) 0.2 RBC, mmc x106 4.5 (2.8- 6.6) 4.5 (2.9-6.6) 4.4 (2.8-6.3) 0.2 Hb gr/dl, Median (range) 13.2 (10.3-17.2) 13.3 (10.3-17.2) 12.8(11.1-16.3) 0.3 WBC, mmc x 103 4.8 (2.2-12.6) 5.1 (2.2-12.6) 4.5 (2.7-11.9) 0.4 Total protein, gr/dl 7.5 (5.6-9.9) 7.6 (5.9-9.9) 7.2 (5.6-9.1) 0.2 Albumin, gr/dl 3.9 (2.5-4.9) 3.9 (2.5-4.9) 4 (3-4.9) 0.8 Gamma globulin, gr/dl 1.7 (0.8-3.8) 1.8 (0.8-3.8) 1.6 (0.8-2.6) 0.02 AST, U/L 57 (14-330) 71 (14-330) 39 (19-163) <0.001 ALT, U/L 66 (10-306) 81 (14-306) 35(10-246) <0.001 GGT U/L 67 (9-289) 66 (9-279) 78(11-289) 0.06 Bilirubin total, mg/dl 1 (0.4-2.8) 0.9 (0.4-2.8) 0.9 (0.4-2.8) 0.5 INR 1 (0.9-2.1) 1.1 (0.9-2.1) 1.1 (0.9-2.1) 0.3 Cholesterol, mg/dl 151 (65-282) 149 (65-282) 161 (92-289) 0.02 Triglycerides, mg/dl 93 (45-340) 87 (45-340) 99 (95-340) 0.2 Creatinine, mg/dl 0.85 (0.4-2.3) 0.8(0.4-2.3) 0.8 (0.4-2.1) 0.5 Urea, mg/dl 36 (11-97) 36 (11-97) 36 (13-64) 1
All numerical parameters are expressed as median and range excepted for those otherwise indicated Bold characters identify statistically significant variables
Abbreviations: BMI (body mass index) RBC (red blood cells), Hb (Hemoglobine), WBC (white blood cells), PTL (platelets), ALT (alanine aminotransferase), AST (aspartate aminotransferase), GGT (gamma glutamyltranspeptidase) INR (international normalized ratio)
Table 2. Duration of follow-up and clinical outcomes in 272 C-P class A
cirrhotic patients
N. of cases (%) Months of follow-up Median
(range) p-value
Stable C-P class A 97 (36) 95 (60-144)
p=0.5 C-P class progression without HCC 71 (26) 95 (10-144)
Table 3a. Logistic regression analyses of different variables with respect to
clinical stability over time
Bold characters identify statistically significant variables at multivariate analysis
Abbreviations: BMI (body mass index) RBC (red blood cells), WBC (white blood cells), PTL (platelets), ALT (alanine aminotransferase), AST (aspartate aminotransferase), GGT (gamma glutamyltranspeptidase) INR (international normalized ratio).
*Varices: absent, small, medium and large size
Univariate model Multivariate model
Variables OR 95% C.I. p-value O.R 95% C.I. p-value
Sex 1.2 0.69-2.07 0.50 Age 0.9 0.89-0.94 <0.001 0.93 0.96-0.99 <0.001 BMI 1 0.92-1.06 0.9 Etiology 1.3 0.67-2.49 0.47 Diabetes 0.5 0.26-0.37 0.01 0.45 0.21-0.96 0.04 Varices* 0.23 0.14-0.38 <0.001 0.26 0.14-0.49 <0.001
Portal vein diameter 0.8 0.7-0.9 0.07
Longitudinal size of the Spleen 0.98 0.97-0.99 0.06
PLT 1.0 1.00-1.01 0.03 0.99 0.98-1.01 0.25 RBC 1.1 1.06-1.19 <0.001 1.09 0.99-1.16 0.19 Hb 1.0 0.9-1.1 0.52 WBC 1.3 1.07-1.14 <0.001 1.08 1.01-1.16 0.42 AST 1.0 0.99-1.04 0.78 ALT 1.0 1.01-1.02 0.64 GGT 1.0 0.99-1.01 0.13 Bilirubin 0.8 0.35-1.48 0.38 Albumin 6.7 3.27-14.2 <0.001 0.35 0.16-0.76 0.01 Gamma globulin 0.3 0.14-0.46 <0.001 0.26 0.13-0.53 <0.001 Cholesterol 1.0 1.00-1.01 0.047 0.34 1.09-0.87 1.00 Triglycerides 1.0 0.99-1.00 0.10 INR 1.0 0.99-1.03 0.13 Creatinine 0.4 0.10-1.19 0.09
Table 3b. Logistic regression analyses of different variables with respect to
progression of C-P score
Bold characters identify statistically significant variables at multivariate analysis
Abbreviations: BMI (body mass index) RBC (red blood cells), Hb (Hemoglobin), WBC (white blood cells), PTL (platelets), ALT (alanine aminotransferase), AST (aspartate aminotransferase), GGT (gamma glutamyltranspeptidase) INR (international normalized ratio).
*Varices: absent, small, medium and large size
Univariate model Multivariate model
Variables OR 95% C.I. p-value O.R 95% C.I. p-value
Sex 1.0 0.59-1.55 0.87 Age 1.0 1.01-1.06 <0.01 1.03 0.99-1.06 0.07 BMI 1.1 0.94-1.07 0.82 Etiology 2.4 1.35-4.31 <0.01 0.46 0.25-1.02 0.06 Diabetes 2.5 1.50-4.05 <0.001 1.69 0.91-3.21 0.09 Varices * 3.6 2.4-5.3 <0.001 3.4 2.1-5.4 <0.001
Portal vein diameter 1.3 0.8-1.6 0.08
Longitudinal size of the Spleen 1.1 1.0-1.2 0.09
PLT 1.0 0.97-0.99 <0.01 0.99 0.99-1.00 0.35 RBC 0.9 0.86-0.95 0.66 Hb 0.9 0.8-1.1 0.26 WBC 0.9 0.76-1.02 0.15 AST 1.0 0.99-1.01 0.53 ALT 1.0 0.99-1.00 0.03 0.99 0.99-1.03 0.40 GGT 1.0 0.98-1.05 0.06 Bilirubin 1.6 0.86-3-15 0.12 Albumin 3.56 0.18-6.74 <0.001 2.41 1.11-5.23 0.03 Gamma globulin 2.38 1.46-3.86 <0.001 1.75 0.94-3.22 0.02 Cholesterol 0.98 0.97-0.99 <0.01 0.98 0.97-0.99 0.01 Triglycerides 0.99 0.94-1.03 0.47 INR 0.05 0.03-0.57 0.27 Creatinine 0.86 0.34-2.16 0.76
Table 3c. Logistic regression analyses of different variables with respect to
HCC development
Univariate models Multivariate model
Variables OR 95% C.I. p-value OR 95% C.I. p-value
Gender 1.6 0.95-2.72 0.074 Age 1.0 1.01-1.07 0.002 1.04 1.01-1-07 <0.01 BMI 0.9 0.87-1.01 0.09 Etiology 1.5 0.79-2.75 0.22 Diabetes 0.9 0.54-1.53 0.73 Varices * 1.0 0.8-1.4 0.93
Portal vein diameter 0.9 0.8-1.1 0.77
Longitudinal size of the Spleen 1.0 0.9-1.1 0.51
PTL 1.0 0.97-1.04 0.13 RBC 1.0 0.92-1.02 0.18 Hb 0.9 0.8-1.0 0.21 WBC 0.9 0.81-1.11 0.48 Albumin 1.2 0.63-2.16 0.62 Gamma globulin 3.2 1.86-5.44 <0.001 3.05 1.76-5.29 <0.001 AST 1.0 0.99-1.06 0.49 ALT 1.0 0.99-1.04 0.87 GGT 1.0 0.99-1.01 0.24 Bilirubin 0.7 0.36-1.38 0.30 Cholesterol 1.0 0.98-1.01 0.26 Triglycerides 1.0 0.98-1.00 0.42 INR 1.2 0.22-6.21 0.87 Creatinine 0.8 0.32-2.29 0.75
Bold characters identify statistically significant variables at multivariate analysis
Abbreviations: BMI (body mass index) RBC (red blood cells), WBC (white blood cells), PTL (platelets), ALT (alanine aminotransferase), AST (aspartate aminotransferase), GGT (gamma
glutamyltranspeptidase) INR (international normalized ratio). *Varices: absent, small, medium and large size
Table 3d. Logistic regression analyses of different variables with respect to
death
Univariate model Multivariate model
Variables OR 95% C.I. p-value OR 95% C.I. p-value
Gender 1.1 0.69-1.86 0.62
Age, years 1.1 1.06-1.13 <0.001 1.09 1.06-1.13 <0.001
Etiology 1.2 0.63-2.07 0.58
Diabetes 1.4 0.84-2.28 0.22
Varices 1.4 1.1-1.9 0.02 1.27 0.9-1.79 0.16
Portal vein diameter 1.1 0.9-1.3 0.12
Longitudinal size of the Spleen 1.1 1.0-1.2 0.07
PLT 1.0 0.98-1.01 0.10 RBC 1.0 0.93-1.03 0.31 Hb 0.9 0.8-1.2 0.89 WBC 0.9 0.74-1.01 0.71 Albumin 3.3 1.73-6.47 <0.001 1.74 0.82-3.69 0.15 Gamma globulin 2.3 1.40-3.83 <0.001 2.078 1.03-3.72 0.01 AST 1.0 0.98-1.01 0.07 ALT 1.0 0.97-1.02 0.18 GGT 1.0 0.99-1.05 0.24 Cholesterol 1.0 0.98-1.01 0.44 Bilirubin 2.4 1.13-5.02 0.02 2.08 0.91-4.75 0.08 Triglycerides 1.0 0.99-103 0.51 INR 1.6 0.05-3.66 0.36 Creatinine mg/dl 1.8 1.05-8.56 0.47
Bold characters identify statistically significant variables at multivariate analysis
Abbreviations: BMI (body mass index) RBC (red blood cells), Hb (Hemoglobine), WBC (white blood cells), PTL (platelets), ALT (alanine aminotransferase), AST (aspartate aminotransferase), GGT (gamma glutamyltranspeptidase) INR (international normalized ratio)