UNIVERSITÀ DEGLI STUDI DELLA TUSCIA
Dipartimento di Scienze dell’Ambiente Forestale e delle sue Risorse DISAFRI
Dottorato di ricerca in ecologia forestale Ciclo XXIII
Development of a novel set of microsatellite markers and genetic characterization of Italian natural Tamarix populations
(AGR/05)
Coordinatore del corso: Prof. Paolo De Angelis
Tutori:
Dott.ssa Elena Kuzminsky Dott. Maurizio Sabatti
Correlatore:
Dott. Isacco Beritognolo
La dottoranda: Serena Terzoli
There is grandeur in this view of life, with its several powers, having been originally breathed by the Creator into a few forms or into one; and that, whilst this planet has gone circling on according to the fixed law of gravity, from so simple a beginning endless forms most beautiful and most wonderful have been, and are being evolved.
Charles Darwin
Non omnes arbusta iuvant humilesque Myricae; si canimus silvas, silvae sint consule dignae. Virgilio
Table of contents
Introduction 1
Chapter 1: Genomic resources in Tamarix spp. 4
1.1. The genus Tamarix 4
1.2. The genus Tamarix in Italy 6
1.3. Ecological features 7
1.4. Uses 7
1.5. Tamarix invasiveness 8
1.6. Molecular systematics 8
1.7. Hybridization 10
1.8. Expressed Sequences Tag analysis in Tamarix 11
Chapter 2: Microsatellites or SSRs (Simple Sequence Repeats) 13
2.1. Definitions and applications 13
2.2. Genomic distribution 15
2.3. Functional perspectives 16
2.3.1. Chromatin organization 17
2.3.2. Regulation of DNA metabolic processes 19
2.3.3. Regulation of gene expression 19
2.4. Mutation rates and mechanisms 22
2.5. Origin 24
2.6. Microsatellite transferability 25
2.7. Microsatellite markers in taxonomic studies 26
2.8. Potential applications 27
Chapter 3: Population genetics in plants 28
3.1. Population genetics: goals and applications 28
3.2. The hardy-weinberg principle 29
3.3. The theoretical models 32
3.4. Measures of genetic variation 33
3.5. F-statistics in genetic differentiation 34
3.6. Computer programs for population genetics 37
3.7. Bayesian inference in phylogeny estimation 38
Chapter 4: Materials and methods 40
4.1. Plant Material 40
4.2. DNA extraction 41
4.3. Quantification genomic DNA 42
4.4. Microsatellite markers detection and scoring 43
4.6. Criteria for EST-SSRs markers development 44
4.7. Designing of primers 44
4.8. Ssrs and EST-SSRs amplification tests and screening of polymorphism 45
4.9. Sequencing of EST-SSRs amplicons 46
4.10. EST-SSRs putative homology 46
4.11. Assessment of EST-SSRs characteristics 47
4.12. SSRs and EST-ssrs analyses in natural populations 47
4.13. Species assignment 49
4.14. Selection of the most informative markers 50
4.15. Population genetic analysis 51
4.16. Computer programs used in this work 53
Chapter 5: Results 54
5.1. DNA extraction and quantification 54
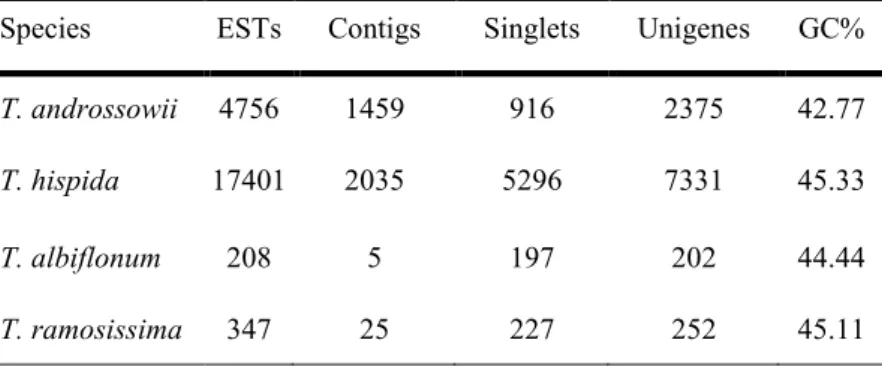
5.2. Analyses of EST sequences 54
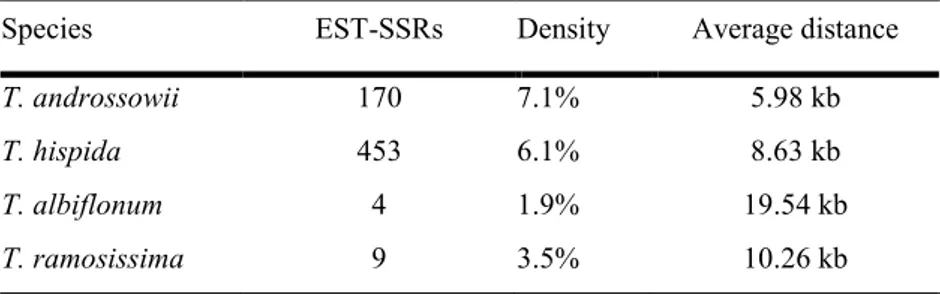
5.3. Frequency and distribution of EST-SSRs 55
5.4. Distribution of EST-SSRs based on number of repeats and their motif 55
5.5. Primer design 58
5.6. EST-ssrs amplification tests and detection of polymorphism 58
5.7. EST-ssrs putative homology 61
5.8. Characteristics of the novel set of EST-ssrs 62
5.9. Assignment test 63
5.10. Selection of best performing loci 66
5.11. Population Genetics 69
5.11.1. T. africana 69
5.11.1.1. Genetic variability within T. africana populations 69 5.11.1.2. Genetic differentiation among T. africana populations 71 5.11.1.3. Population genetic structure in T. africana 73
5.11.1.4. Detection of loci under selection 80
5.11.2. T. gallica-like group 82
5.11.2.1. Genetic variability within T. gallica-like group populations 82 5.11.2.2. Genetic differentiation among T. gallica-like group populations 83 5.11.2.3. Population genetic structure in T. gallica-like group 85
5.11.2.4. Detection of loci under selection 92
Chapter 6: Discussion 94
6.1. Analyses of Expressed Sequences in Tamarix 94
6.2. EST-SSRs mining in Tamarix 94
6.4. EST-SSRs amplification tests and detection of polymorphism 96
6.5. Characteristics of the novel set of EST-SSRs 97
6.6. Species assignment by Bayesian approach 98
6.7. Selection of best performing loci 100
6.8. Population genetics 101
6.8.1. T. africana 102
6.8.1.1. Diversity within population 102
6.8.1.2. Differentiation among populations 103
6.8.1.3. Population genetic structure in T. africana 104
6.8.1.4. Detection of loci under selection 105
6.8.2. T. gallica-like 105
6.8.2.1. Diversity within population 105
6.8.2.2. Differentiation among populations 106
6.8.2.3. Population genetic structure in T. gallica -like group 106
6.8.2.4. Detection of loci under selection 107
Conclusions 108
References 110
Acknowledgements 119
Abstract
Tamarix plants are characterized by tolerance to extreme environmental conditions and represent an alternative
resource for the recovery of marginal areas. However, their taxonomy is troublesome, and few molecular markers are available to enable species identification. Transcriptome sequencing projects offer a potential source for the development of new markers, named EST-SSRs.
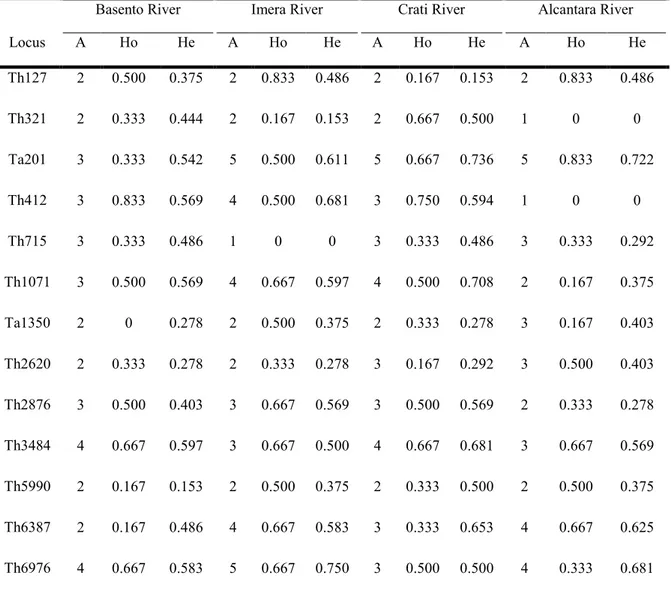
Thirteen polymorphic simple sequence repeat (SSRs) markers derived from Expressed Sequence Tags (ESTs) from Tamarix hispida, T. androssowii, T. ramosissima, and T. albiflonum were identified and screened on 24 samples of T. africana to detect polymorphism. The number of alleles per locus ranged from two to eight, with an average of 4.3 alleles per locus, and the mean expected heterozygosity was 0.453. Amplification products of these 13 loci were also generated for T. gallica.
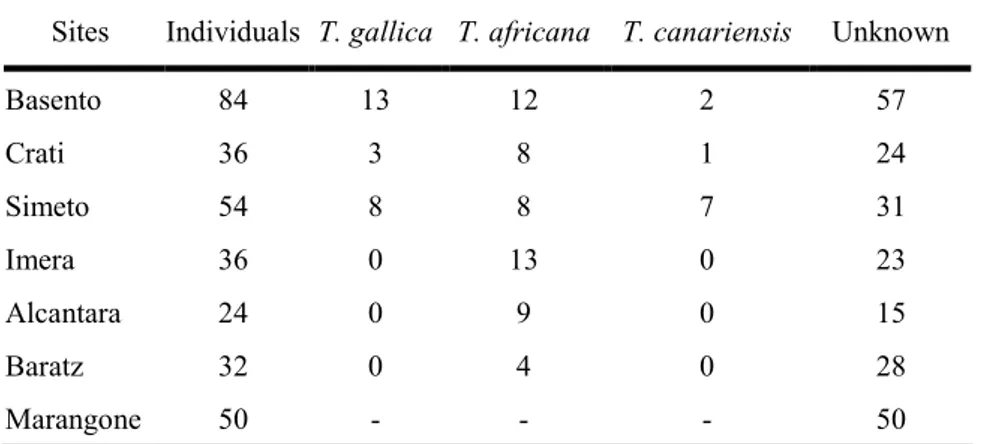
Tamarix plants were collected in seven sites from Italian islands, Central and Southern Italy: Imera, Simeto and
Alcantara from Sicily, Crati from Calabria, Basento from Basilicata, Baratz from Sardinia, and Marangone from Lazio. It was performed a blind sampling, thus individuals were collected without any regard for species identity. Indeed, despite during our germplasm collection flowers for species identification were collected; a large set of samples remained unidentified. The number of individuals surveyed for site ranges from 24 to 84, with a total of 316 plants. The identities of 85 plants were determined with Baum’s morphological keys, while all the rest (72% of the total) remained unidentified. An assignment method based on the use of molecular markers with a Bayesian statistical approach allowed the identification of individuals among species. It was found a clear assignment of T. africana individuals. Otherwise, it was not the same for T. gallica and T. canariensis, whose individuals were assembled together in a unique genetically homogeneous group (T. gallica-like), consistent with the hypothesis of introgression between species. Starting from a total of 221 unidentified plants the Bayesian approach assigned 142 individuals to T. africana, 78 to the T. gallica-like group, while 11 individuals (3.49%) were considered admixed and discarded for further analysis. The advantage concerning the use of molecular markers for classification purposes is that they can be used to assess differentiation across a wide range of taxonomic levels and address questions of species status by comparing inter-intra taxa differentiation. Thus, a high assignment power panel could be employed not only in the species studied in the present work, but could represent a new, fast and cheap method for species identification in all the taxa belonging to the genus
Tamarix. It is noteworthy that only two loci, T1B8 and Ta1350, were required to achieve assignment to the
species.
Three sites resulted monospecific stands of T. africana (Alcantara, Baratz, and Marangone), four stands resulted mixed with T. africana and T. gallica-like group contemporarily present in the same site (Crati, Imera Basento, and Simeto), while no any monospecific composition of T. gallica-like was found. The analyses of genetic structure of these populations pointed out the existence of a unique gene pool in Southern Italy for both
populations from Central Italy and Sardinia resulted more differentiated, despite the Mantel test for isolation by distance was not significant. It means that probably the genetic variability is affected by environmental factors, but it is not clear yet which features are involved.
At the best of our knowledge the present work is the first one regarding the characterization of genetic resources in Italian tamarisks.
Key-words: Tamarix, microsatellite, population genetics, taxonomy, EST-SSRs
Riassunto
Le tamerici sono caratterizzate da una elevate tolleranza a condizioni ambientali estreme e rappresentano una potenziale risorsa per il recupero delle aree marginali. Tuttavia, la tassonomia del genere Tamarix è problematica ed esistono pochi marcatori molecolari che possano essere utilizzati per l’identificazione delle specie. I progetti di sequenziamento del trascrittoma offrono, tuttavia, una risorsa per lo sviluppo di nuovi marcatori.
Sono stati sviluppati 13 nuovi marcatori microsatellite derivati da sequenze espresse (EST) di Tamarix hispida,
T. androssowii, T. ramosissima e T. albiflonum. Questi marcatori sono stati testati su 24 individui di T. africana
per evidenziarne il polimorfismo. Il numero di alleli per locus varia da due a otto con una media di 4.3 alleli per locus, mentre l' eterozigosi attesa media è pari a 0.453. L’amplificazione di questi 13 loci è stata inoltre verificata in T. gallica.
Le tamerici sono state raccolte in sette siti localizzati nelle isole e nell'Italia centrale e meridionale: Imera, Simeto e Alcantara dalla Sicilia, Crati dalla Calabria, Basento dalla Basilicata, Baratz dalla Sardegna e Marangone dal Lazio. È stato condotto un campionamento alla cieca in cui le piante sono state raccolte senza nessuno riguardo per l'identità specifica. Infatti, sebbene durante la collezione del germoplasma Italiano siano stati raccolti i fiori per l’identificazione specifica, non si è pervenuti all’identificazione di molti campioni. Il numero di individui collezionati per sito varia da 24 a 84 per un totale di 316 tamerici. È stata determinata l'identità specifica di 85 piante utilizzando la chiave morfologica di Baum, mentre le rimanenti piante (72%) sono state considerate indeterminate. L'identificazione specifica degli individui indeterminati è stata realizzata mediante un metodo di assegnazione basato sull'utilizzo di marcatori microsatelliti ed un approccio statistico di tipo Bayesiano. Gli individui della specie T. africana hanno presentato un chiara assegnazione. Mentre, non è stato ottenuto lo stesso risultato per le specie T. gallica e T. canariensis i cui individui hanno formato un unico gruppo omogeneo dal punto di vista genetico (T. gallica-like), coerente con l’ipotesi di introgressione tra le specie. Complessivamente gli individui indeterminati erano 221, il metodo Bayesiano ha asseganto 142 individui alla specie T. africana, 78 al gruppo ascrivibile a T. gallica, mentre 11 individui (3.49% del totale) non sono stati assegnati e quindi sono stati scartati dalle analisi successive. Il vantaggio dell'utilizzo dei marcatori molecolari negli studi di classificazione che questi possono essere utilizzati per evidenziare la differenziazione a diversi
livelli tassonomici, e possono chiarire lo status delle specie comparando la differenziazione all'interno e tra taxa. Un gruppo di marcatori caratterizzati da un alto livello di confidenza nell'identificazione specifica potrebbe essere utilizzato non soltanto nelle specie studiate nel presente lavoro, ma potrebbe rappresentare un nuovo metodo, poco costoso, riproducibile e veloce per l'identificazione delle specie appartenenti al genere Tamarix. È da sottolineare che i nostri risultati hanno evidenziato che per ottenere l'identificazione specifica sono sufficienti due loci, T1B8 e Ta1350.
Tre siti sono risultati essere formazioni monospecifiche di T. africana (Alcantara, Baratz, e Marangone), quattro popolamenti sono misti con la contemporanea presenza di T. africana e del gruppo ascrivibile a T. gallica (Crati, Imera Basento, e Simeto), mentre non sono state riscontrate formazioni monospecifiche del gruppo ascrivibile a
T. gallica. L’analisi della struttura genetica delle popolazioni ha evidenziato l’esistenza di un unico pool genico
presente nelle regioni del meridione d’Italia per entrambe le specie, con popolazioni caratterizzate da una bassa variabilità genetica. D’altro canto, le popolazioni di T. africana provenienti dall’Italia centrale e dalla Sardegna appaiono differenziate rispetto alle altre, nonostante il test di Mantel per l’isolamento per distanza non sia risultato significativo. Ciò significa che presumibilmente la variabilità genetica è affetta da parametri ambientali che tuttavia ancora non sono stati definiti.
Al meglio della nostra conoscenza, il presente lavoro è il primo riguardante la caratterizzazione delle risorse genetiche del genere Tamarix in Italia.
Introduction
Introduction
The Mediterranean Basin is located in the transition zone between the northern latitudes and the desert belt. Due to this specific location, the present global warming is expected to result in lower precipitations and higher temperature. This may cause a general degeneration of Mediterranean forests, as water availability and quality are determinant for productivity and sustainability of plant, crop, and agro-forestry plantations. Conservation strategies represent crucial issue in this area which is one of the world’s major centers of plant diversity (Médail and Quézel 1999). Nevertheless, some species of the Mediterranean Basin natural vegetation, such as Tamarix plants, thrive in zones where extreme climate conditions are regular phenomena; so, during their evolution, they have developed stress-adapted mechanisms. For these reasons this genus is likely to be well adapted to future conditions caused by the global warming effects. Moreover, these plants live in habitats that could become extremely fragile as subjected to flooding by the increasing sea level due to the melting of polar ices. In this scenario tamarisks represent an additional resources that should be protected and appreciate.
Since the last century, some specimens of tamarisks were introduced in North America and became invasive in riparian habitats with negative ecological and environmental impacts (Gaskin and Schaal 2002). Conversely, in Europe the genus Tamarix is native and does not show invasiveness, moreover it is considered interesting for its tolerance of abiotic stresses and for recovering of marginal areas.
At the best of our knowledge our work is the first contribution about Italian germplasm with molecular approach. Our work is a part of a wide collection of Tamarix spp. germplasm in Italy, where the main two species are T. africana and T. gallica, anyway even T. canariensis was found. The genetic resources for these species are very poor, and there is no any information about the structure of Italian natural populations.
The present work is included in a broader international project in collaboration with the Tel Aviv University (Israel), and other Ph.D. students were involved in the same project. In particular, Renée Abou Jaoudé was involved in germplasm collection and physiological characterization of tamarisks in response to salt and flooding stress, and Grazia Abbruzzese’s
Introduction
work was concerned the characterization of Tamarix micro-morphology of leaf and flower features in relation to environmental condition and taxonomy.
As described in literature, the taxonomy of this genus is troublesome, as the species cannot be distinguished at vegetative status and the floral traits used in the species identification could often be misleading, varying from season to season on the same individual (Gaskin 2003). For this reason, most of the Tamarix plants sampled during our germplasm collection in Southern and Central Italy remained unidentified. Unfortunately, only few molecular markers have been developed in Tamarix (Gaskin et al. 2006). For this reason, in the present work a novel set of gene based microsatellite markers has been developed. These markers are named EST-SSRs. Nonetheless, the increasing number of available sequences from large-scale transcriptome sequencing of Tamarix species offers a potential resource for a rapid and cheap development of these markers. Expressed sequence tag (EST) from four Asian species (T. hispida, T. androssowii, T. ramosissima, and T. albiflonum) were used for mining of EST-SSRs, and a cross-species amplification on Italian specimens was conduct.
These newly developed EST-SSRs represent additional resources for genetic characterization in this genus, and, with their large transferability, they could be used as new tool for species identification or to track the spread of invasive genotypes where tamarisks represent a threat.
Species identity represents the fundamental unit in ecology and evolution, although biological species definition is still matter of debate (Goldstein et al. 2000; De Queiroz 2007). Thus, it was realized a new method for species identification based on the use of molecular markers and a Bayesian statistical approach, instead of the classical method relied on morphological traits. It was found a clear assignment of T. africana individuals. Otherwise, it was not same for T. gallica and T. canariensis, whose individuals were assembled together in a unique molecularly homogeneous group (T. gallica-like). This result suggested the existence of a unique taxon or introgression between species, and it is consistent with a recent speciation scenario.
Microsatellite markers at the whole had a tremendous impact on population genetics and have became the genetic markers most commonly employed (Balloux and Goudet 2002). Population genetics describe the genetic structure of populations more or less connected by gene flow. Beyond, it is a starting point to suggest which evolutionary processes are actually involved in shaping population variability. Understanding gene flow and its effects is crucial for many fields of research including population genetics, populations ecology, conservation
Introduction
biology and epidemiology (Balloux and Lugon-Moulin 2002). In particular, in this work it was found that Italian populations of T. africana are characterized by a great genetic differentiation between Southern Italy, Central Italy and Sardinia populations. Whereas, T. gallica-like showed a higher genetic diversity within populations and a low differentiation among populations.
The set of markers described in this work was tested even in T. jordanis, T. tetragyna, and T. aphylla from the desert of Negev (Israel), showing transferability and polymorphism. Even if only one genotype for species was available, we could demonstrate the transferability of our loci among species geographically distant, which, for this reason, are genetically different.
Chapter 1: Genomic resources in Tamarix spp.
Chapter 1
Genomic resources in Tamarix spp.
1.1. The genus Tamarix
The family Tamaricaceae comprises three genera (Tamarix, Myricaria, and Reaumuria) and contains about 80 species. The genus Tamarix (the largest one) is composed by 54 species of shrubs or trees that can outcross, self pollinate, and propagate clonally from woody fragment (Gaskin and Schaal 2002). Tamarix plants, also called tamarisks or saltcedars, are broadly spread across many habitats with a great variability of environmental conditions. In fact, it native in Europe, Asia and North Africa and thrives in several riparian habitats like dunes, banks of rivers, and alluvial planes (Figure 1.1).
Figure 1.1: Native range distribution of the genus Tamarix. The centre of differentiation is located in central Asia.
The latest comprehensive revision of the genus by Baum (1978) contains three distinct sections, separated primarily by stamen number, petal length, androecial disk shape, and
Chapter 1: Genomic resources in Tamarix spp.
position of filament insertion on the androecial disk. These sections are further divided into nine series based on morphological characters. In parenthesis are reported the species that will be studied in this work.
Sections I Tamarix: series Gallicae (T. gallica, T. ramosissima), Leptostachyae (T. arborea, T. canariensis, T. hispida), Vaginates (T. aphylla), Sections II Oligadenia: series Laxae (T. chinensis), Anisandrae (T. africana,
T. tetragyna), Arbusculae (T. androssowii), Fasciculatae, Sections III Polyadenia: series Arabiacae, Pleiandrae.
The taxonomy of the genus Tamarix is one of the most difficult among Angiosperms as its members offer few distinctive external features. The floral morphology include some characteristics which can be used for species identification, but they can be discerned after the dissection of the tiny flowers (Baum 1978). The inflorescence consists of solitary or compound racemes that occur on the branches, which are composed by clustered tetra or pentamerous small flowers. The width of the racemes show inter-specific variation, while the length is more variable even within the same species (Figure 1.2). Leaves are usually small, scale-like, and adpressed to the branches along their major axes, moreover, on the surface the presence of deep salt-secreting glands is common.
Figure 1.2: T .africana raceme (courtesy Grazia Abbruzzese) and salt glands in T. tetragyna leaves.
All the species belonging to this genus are deciduous with the except of T. aphylla which is the only one evergreen (Baum 1978).
Chapter 1: Genomic resources in Tamarix spp.
1.2. The genus Tamarix in Italy
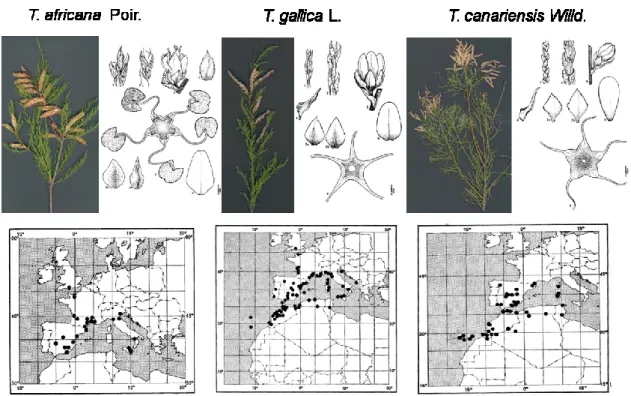
In 1984 De Martis and co-workers found 11 species in Sardinia, however the species T. parviflora was considered cultivated and become naturalized, while the species T. nilotica was found for the first time in Europe, but it was not reported in successive works. In fact, a later paper reports the existence of 10 species in Italy (Conti et al. 2005) that thrive in several natural habitats like dunes, banks of rivers, and alluvial planes. The main two species are T. gallica and T. africana, anyway even T. canariensis (Figure 1.3), T. dalmatica, T. parviflora, T. arborea, T. hampeana, T. passerinoides, and T. tetragyna were observed. In a recent work, Venturella and co-workers (2007) added two specimens usually used as ornamental T. rosea and T. chinensis that did not have been found before in the wild, moreover, they did not find T. dalmatica during their investigation in Sicily.
Figure 1.3: Flowering branch, floral features and native range distribution of T. africana, T. gallica, and
T. canariensis which are the species more deeply investigated in this study (modified from Baum, 1978). Despite sometimes the genus Tamarix is considered a treat as it became invasive in North America, in the native range it does not show any trait of invasiveness. On the other hand, it is considered a very interesting genus for its tolerance to abiotic stress and for the recovery of degraded lands. Anyway, no information is available about the genetic structure of the Italian natural germplasm of Tamarix.
Chapter 1: Genomic resources in Tamarix spp.
1.3. Ecological features
Tamarix species are pheatophytes, characterized by deep roots that reach the water table for their water supply. However, under particular conditions they can grow where the groundwater is not accessible, thus Tamarix are defined facultative phreatophyte rather than obligate phreatophyte (Zhang et al. 2002). Temperature has strong effect on plant growth and survival limiting the geographical distribution of the species (Sexton et al. 2002), in fact, for instance T. aphylla, T. nilotica, T. dioica, T. macrocarpa show high temperature requirement, otherwise other species inhabit temperate regions withstanding freezing temperatures of the European winters. The species also differ in their degree salt tolerance, in fact, some species are considered extreme halophytes (e.g., T. chinensis, T. hispida) while others are not (Baum 1978).
1.4. Uses
Tamarix species were used as wind-breaks, hedges in desert conditions or dunes fixers along costal zones as some species are tolerant of salt spray, moreover the deep root allow to use Tamarix plants for the fixation of river banks to prevent erosion (Baum 1978) (Figure 1.4).
Figure 1.4: Tamarisks are able to survive in extreme environmental conditions
Recently this adaptation to an extreme range of environmental condition pointed out the suitability of tamarisks to be employed for the reforestation of degraded lands that might be irrigated by saline water or by reused urban and industrial water waste.
Chapter 1: Genomic resources in Tamarix spp.
1.5. Tamarix invasiveness
Since the last century around ten species of Tamarix were introduced in north America to be use for shade and erosion control, and became invasive in riparian habitats with negative ecological and environmental impacts. The ability of invasive plants to compete and proliferate can be caused by intrinsic factor such as physiological or reproductive capacities, and to extrinsic factor such as a loss of competitors, herbivores, or pathogens upon introduction. An additional influence may be due to the creation of new genotypes; in fact, the introduction of species in a new region can provide opportunities for hybridization events, bringing into contact related species that previously were isolated (Gaskin and Schaal 2002). Once naturalized recombination of genetic variation can provide a range of hereditable phenotype to respond to local selection pressures and produce offspring with a greater fitness (Sexton et al. 2002).
Many species have become noxious due to their invasive habit and competition with neighbouring plants, and even because they impoverish water sources thought transpiration, lowering the water table and altering stream and river dynamics (Gaskin 2003). Salt secretion may led to the desalinization of deeper soil layers, while increasing the salinity of upper soil layers, often the soil surface being covered year by year by a layers of twiggy salty litter (Baum 1978). In fact, once established, Tamarix can tolerate drought by utilizing deep ground water sources. Moreover they can exclude excess salt from salinized water sources from glands in their scale-like leaves, which seasonally are dropped, forming a saline duff on the soil surface that inhibits the germination of other plants. Thus Tamarix have also a negative role being a strong competitor which can form monospecific stand that decrease biodiversity (Zhang et al. 2002).
1.6. Molecular systematics
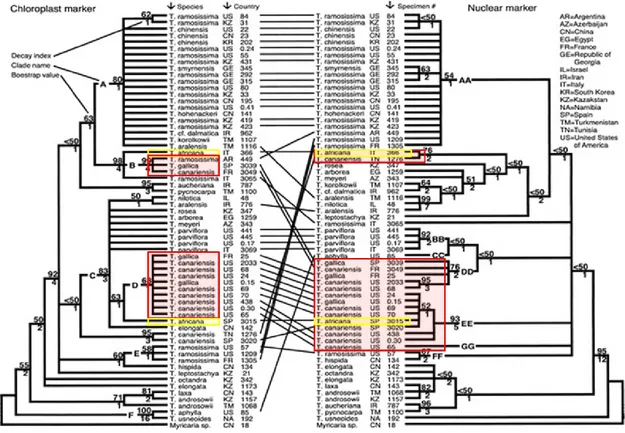
Recently studies about the molecular systematic of Tamarix (Gaskin and Schaal 2002; Gaskin 2003) pointed out that the molecular analyses did not support the three taxonomic sections identified by Baum, and morphological traits are often misleading as a means of identifying specimens. Gaskin and Schaal (2003) used both nuclear and chloroplast markers to compare the evolutionary dynamics of the maternally and biparentally inherited genome, allowing the investigation of putative hybridization within the genus Tamarix. In that study
Chapter 1: Genomic resources in Tamarix spp.
they analysed several Tamarix species collected both across the native range (Europe, Asia, southern Africa) and in north America. The molecular phylogenetic analysis was performed using both nuclear ribosomal ITS and chloroplast trnS-trnG intergenic spacer sequence data, but the results were incongruent with earlier partitioning of the genus. For example, some species that in Baum’s classification belong to different sections, have identical phylogeny both in nuclear and chloroplast genome. Moreover, they found incongruence between nuclear and chloroplast evolutionary histories and not all species could be distinguished with these molecular markers. In particular, in this work T. gallica and T. canariensis had the same chloroplastic DNA sequences (Figure 1.5), otherwise following the nuclear sequences data these species fell into two clades, the first composed by T. gallica and T. canariensis alone, and the other one include T. africana as well. Gaskin and Schaal (2003) suggested that the inability of their molecular markers to distinguish between T. canariensis and T. gallica may be due to these species being the same taxon or the species are introgressive.
Chapter 1: Genomic resources in Tamarix spp.
1.7. Hybridization
Hybrids formation is a common phenomenon in plants both in the wild and under cultivation, it is caused by the formation of gametes from two different entities (species, subspecies, etc) (Weising et al. 2005). Gaskin and Schaal (2002) conducted a study on the spread of invasive population of Tamarix in USA. In that study nuclear sequence form an intron of phosphoenolpyruvate carboxylase (PepC) gene was used and vouchered Tamarix species both from native and invasive range were collected. This study showed that within the USA invasion many of the plants were novel hybrids between T. chinensis and T. ramosissima. In fact, it was found that the most common genotype is a hybrid combination between two species-specific haplotype that were geographically isolated in Tamarix native range in Asia. Moreover, they observed a lower genetic diversity than the native rage, suggesting the hypothesis of founder events or genetic bottleneck. In a successive work Gaskin and Krazmer (2006) tried to establish a relationship between ornamental and wild saltcedars by means of chloroplast trnS-trnG intergenic spacer sequence and the fourth intron of phosphoenolpyruvate carboxylase (PepC) gene. This second study confirmed the hybrid origin of invasive Tamarix in USA and indicate that the wild genotype originated from wild plants, as chloroplast and nuclear genotypes found in ornamental plants were dissimilar from genotypes found in nearby wild stands of Tamarix. The same authors studied the introgression of invasive saltcedars in USA with AFLP markers including both plant material from Asia and USA (Gaskin and Krazmer 2009). They found that T. ramosissima and T. chinensis plants from Asia were genetically distinct, and that the USA plants were genetically intermediate the parental species, forming a continuum between the parental genotypes. A recent study on Tamarix cold hardiness was conducted on native T. chinensis and T. ramosissima and invasive population from USA with microsatellites markers (Friedman et al. 2008); the authors pinpointed the lack of a strong genetic isolation among invasive populations, with a gradual trend from individuals that resemble to T. chinensis in the southern to individual that resemble to T. ramosissima in the northern latitude. In that study the absence of genetic isolation and the similarity with the parental species were observed, supporting the hypothesis of a post-introduction hybridization, which may allowed the creation of a greater genetic variability with respect to cold hardiness than any of the originally introduced population.
Chapter 1: Genomic resources in Tamarix spp.
1.8. Expressed Sequences Tag analysis in Tamarix
The knowledge of the distribution of genetic variability between and within natural plant populations is essential to adopt competent strategies for ex situ and in situ germplasm conservation, for molecular breeding or for detecting the spread of invasive specimens. Anyway, only 10 neutral microsatellite markers have been developed for T. chinensis, T. ramosissima and their hybrids, but it is worth to note that the transferability of microsatellite loci across different species is not complete, since, usually, the primer sequences are species-specific (see Chapter 2). Nonetheless, the increasing number of available sequences from large-scale transcriptome sequencing of Tamarix species offers a potential resource for rapid and cheap development of new markers, EST-SSRs. As mentioned above tamarisks are one of the most remarkable salt-tolerance woody plant species, however, only recently studies on their stress resistance mechanisms have been conducted. Two species from China were investigated, T. androssowii and T. hispida, for the construction of cDNA libraries which lead to a better understanding of the gene expression profiles manifested in response to stress. In these studies an expressed sequence tags (ESTs) analysis was conducted. It is an effective method in discovering novel genes that is a hard topic especially in Tamarix, as in this genus, the genomic data are poor.
In the first work, Wang and co-workers (2006) constructed a cDNA library of T. androssowii stressed by NaHCO3, and obtained 2455 EST sequences. The authors found about 400
differential expressed genes in response to NaHCO3 stress, which were analyzed using
BLASTX, and the ESTs of known putative function were further grouped into 12 functional categories. The most abundant ESTs were involved in defence and photosynthesis and a high portion of them were identified as salt stress related genes in T. androssowii. The authors compared the gene expression pattern of T. androssowii with those of other species to allow a better understanding of transcripts profile under salinity stress, and they found that metallothionein-like (MTL) proteins, lipid transfer protein (LTP), and Germin-like proteins (GLPs) were significantly expressed suggesting a role in the salinity tolerance processes in plants. It is worth noting that even Late embryogenesis abundant protein (LEA), a well known osmotic stress related gene, was found in the EST collection (Wang et al. 2006). This gene was cloned and introduced in tobacco, where, the over expression of LEA gene conferred high tolerance to salt, dehydration and cold (Zhao et al. 2011). Moreover the differential expression of genes involved in defence from reactive oxygen species (ROS) were observed during the construction of T. androssowii cDNA library (Wang et al. 2006). Recently, these
Chapter 1: Genomic resources in Tamarix spp.
observation were employed for the transformation of transgenic poplars with a manganese superoxide dismutase (MnSOD); the overexpression of this gene conferred enhanced salt tolerance to a hybrid poplar (Populus davidiana X P. bolleana) (Wang et al. 2009).
A second work by Gao and co-workers (2008) produced a cDNA library in response to NaHCO3 and NaCl in T. hispida. They obtained 9447 expressed sequences from leaf tissue
after increasing time of exposure to NaHCO3 stress. Once identified the genes responsive to
NaHCO3, nine of them were further investigated and the expression patterns in response to
NaHCO3 and NaCl were compared by real time RT-PCR. The authors found that the
expression patterns of T. androssowii and T. hispida were very similar, in fact, even in this later work an increased expression level of LEA genes, LTP and ROS scavenging (MTLs) genes were observed. The authors observed that in T. hispida the short-term response in NaHCO3 and NaCl stresses were similar, but prolonged stress triggers different mechanisms
in saline or saline-alkali stress.
Moreover, in a recent work (Dong et al. 2007) the gene encoding the plasma aquaporin of T. albiflonum was cloned an sequenced. Aquaporins are water selected channels involved in seed germination, cell elongation, stoma movement and also play a role in drought stress response. The authors obtained the sequence of the T. albiflonum aquaporin (AQP) from a subtractive hybridization library constructed under drought stress and conducted a BlastX homology search to assess the homology with kwon genes. The comparative molecular analysis of the nucleotide sequences of T. albiflonum AQP showed 95% homology with the gene of Arabidopsis thaliana.
Each of these works provided a large number of expressed sequences that were deposited in publicly available gene bank, that enriched the scarce genetic resources in Tamarix and could allow a better knowledge of stress tolerance in woody plants. Even if these sequences belong the species that are not present in Italy, the expressed sequences promise for the development of molecular markers (Ellis and Burke 2007).
Chapter 2: Microsatellites or SSRs (Simple Sequence Repeats)
Chapter 2
Microsatellites or SSRs (Simple Sequence Repeats)
2.1. Definitions and applications
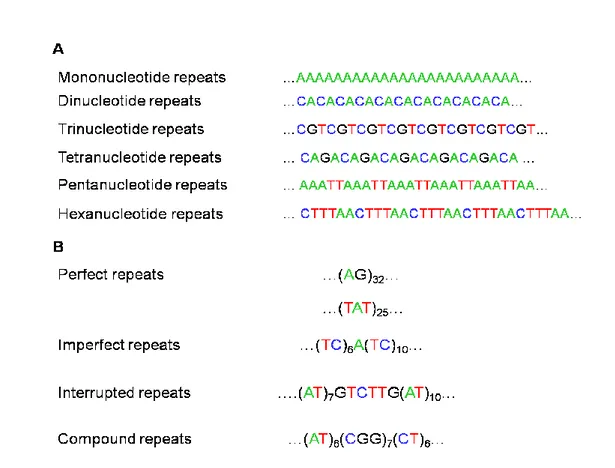
Microsatellites, also known as simple sequence repeats (SSRs), consist of short motifs of 1 to 6 nucleotide tandem repeats stretches of DNA, that are widely spread across the genome occurring both in coding and non-coding regions (Pashley et al. 2006). SSRs located in non-coding portion of the genome are defined neutral as they are not subjected to environmental selection, but it is clear now that microsatellites could be located also in expressed sequences within both the coding and the untranslated regions. (Ellis and Burke 2007). Moreover, microsatellites could be classified according to their type of repeat sequence as perfect, imperfect, interrupted or composite. In a perfect microsatellite the repeated sequence is not interrupted by any base not belonging to the motif, while in an imperfect microsatellite there is a pair of bases between the repeated motif that does not match with the motif sequence. In the case of an interrupted microsatellite there is a small sequence within the repeated sequence that does not match with the repeated sequence, while in a composite microsatellite the sequence contains two adjacent distinctive sequence-repeats (Figure 2.1) (Bhargava and Fuentes 2010).
Chapter 2: Microsatellites or SSRs (Simple Sequence Repeats)
Figure 2.1: A. Examples of perfect microsatellites composed by mono-, di-, tri-, tetra-, Penta-, and Hexanucleotide repeats, respectively. B. Examples of perfect, imperfect, interrupted and compound microsatellites (modified from Weising et al. 2005).
Microsatellites are highly polymorphic regions and the polymorphism between individuals arises from the different number of repeated units within the sequence (Figure 2.2).
Figure 2.2: Three different alleles of a tri-nucleotide microsatellite where the allele A has eight repeated units, B seven repeated units, and the longest C has nine repeated units.
Chapter 2: Microsatellites or SSRs (Simple Sequence Repeats)
So, an homozygous microsatellite locus has the same number of repeats on both homologous chromosomes, whereas a heterozygous microsatellite locus has different number of repeats for each allele.
Otherwise, at the same locus a population usually contains several alleles, each with a different number of repeats, which means that microsatellite markers could be very useful for discriminating different individuals. According to the information provided about heterozygous, molecular markers are classified in dominant and codominant markers. The advantage of codominant markers over dominant markers is the differentiation between homozygous and heterozygous individuals that makes the analysis and the interpretation of both kinds of markers very different. The employment of SSR markers shows different advantages correlated to their hypervariability, codominant inheritance, multiallelic nature, extensive genome coverage and simple detection by PCR reaction. Microsatellites are locus-specific and sequence locus-specific markers, thus their development is more difficult with respect to the dominat markers. In fact, unfortunately the development of SSRs is expensive and time-consuming and frequently the PCR primers used to amplify these loci are often species specific, so the marker developed in one taxon could not be readily transferred to another one. Anyway, codominat markers are particularly precious since they are orthologus, meaning that they derive from a common ancestral locus that makes them suitable in comparative genomics analysis, population genetics, parentage analysis and estimate of gene flow.
2.2. Genomic distribution
Microsatellites are not regularly distributed within a single genome due to differences in their frequencies within coding and non-coding regions and the possible functional roles of different repeats. Despite microsatellites have ubiquitous occurrence both in eukaryotic and prokaryotic genomes, their density and distribution could vary markedly across the genome (Li et al. 2002; Sharma et al. 2007); and their frequency could vary per taxon in terms of absolute number of microsatellite loci and preferential repeats. Eukaryotic genomes are characterized by the prevalence of mononucleotide repeats over the other classes of microsatellites repeats (Sharma et al. 2007); while in prokaryotic genomes microsatellite frequency is relatively low and tri nucleotide microsatellites are the most common ones. In plants, a positive and linear relationship between microsatellite frequency and percentage of
Chapter 2: Microsatellites or SSRs (Simple Sequence Repeats)
single-copy DNA was observed (Morgante et al. 2002), which suggest that microsatellites frequently occur within and near genes (Bhargava and Fuentes 2010).
Microsatellites are broadly used as molecular markers since they suffer higher rates of mutation than the rest of the genome (Oliveira et al. 2006). High mutability at microsatellite loci has a role in genome evolution by creating genetic variation within a gene pool and may provide an evolutionary advantage of fast adaptation to new environments (Li et al. 2004). Although, all types of SSR repeats appear to be more common in non-coding regions, a large number of microsatellite are located in protein-coding regions. In general they are less frequent with exception of tri- and hexanucleotide microsatellite repeats that are found to be in excessive numbers over the others repeats unit size. Probably, the differences between the non-coding and the coding SSRs frequencies arise from specific negative selection against frameshift mutations in coding regions resulting from length changes in nontriplet repeats (Li et al. 2002), that could generate a mutation pressure or a positive selection for specific amino acid stretches. In fact, since the RNA bases are read as triplets, the selection against mutations, that change the reading frame of a gene, restrict the presence of microsatellite in coding regions. So, while microsatellites with repeats in multiples of three develop evenly in both coding and non-coding regions, the potential expansion of di- or tetra- nucleotide repeats microsatellite at the coding or the untranslated region could lead to disruption of the original protein and the formation of new genes by frameshift (Li et al. 2002). Changes in lengths of triplet or amino acid repeats could affect protein function, as frameshift within coding region caused by microsatellite expansion or contraction may cause gain or loss of function, gene silencing or induce pathogenesis. Anyway, as explained above the repeat elongation/shortening processes also lead to the increase of biological complexity, which is considered to be crucial for biological evolution.
2.3. Functional perspectives
Microsatellites can have either selectively neutral effect on the genome or affect crucial regulatory gene functions, but their actual role in plant genes is still poorly understood (Kalia et al. 2011). Moreover, there are some evidence that genomic distribution of microsatellites is non-random, presumably because of their effects on chromatin organization, regulation of gene activity, recombination, DNA replication, cell cycle, and mismatch repair (MMR) system (Figure 2.3). Interestingly, members of some gene groups have preferential
Chapter 2: Microsatellites or SSRs (Simple Sequence Repeats)
distribution of microsatellites in specific gene regions. For example, members of the “transcriptional factor activity” group have more microsatellites than expected in all regions except introns, otherwise genes involved in transport have more microsatellite than expected in introns and 3’ regions (Sharopova 2008). Although, usually in literature microsatellites are considered evolutionary neutral markers, it is clear that they can have either a neutral effect on the genome or perform important functions (Oliveira et al. 2006), and the microsatellites location in the genome determines their functional role (Kalia et al. 2011).
Figure 2.3: Microsatellites putative function (modified from Li et al. 2002).
2.3.1. Chromatin organization
Chromosomal organization. Several aspects of microsatellite distribution suggest a special role as possible ancient genomic component of taxon-specific chromosome structure. Moreover several evidences indicate that repetitive elements participate in the packaging or the genome, allowing the expression of coordinately regulated genes in a cell type-specific manner (Figure 2.4) (Kumar et al. 2010).
Chapter 2: Microsatellites or SSRs (Simple Sequence Repeats)
Figure 2.4: Repeat-dependent cell type-specific genomic packaging code. A: Genomic DNA. B: Genome marked with different repeat elements indicated as different coloured spheres. Repeat-specific DNA-binding proteins can allow chromatin loop formation by bringing the repeats together. C: Different kinds of repeat can interact with the help of different set of proteins and cluster the linked loci to different nuclear compartments. D: In a different cell type where a particular repeat-specific DNA-binding proteins is absent, the clustering can be altered, leading to a different conformation (Kumar et al. 2010).
DNA structure. Microsatellites are able to form a wide variety of unusual DNA structure with simple and complex loop-folding patterns. The formation of such stable structure offer an advantageous mechanism during transcription, providing unique protein recognition motifs. Moreover, the repeats number seems to be a critical parameter that determines the balance between the advantage gained and the disadvantage during replication posed by these structure.
Centromere and telomere. In many species the centromeric region of chromosomes is characterized by the presence of a large number of microsatellites. The assembly of divergent tandem sequence into chromosome specific higher order repeats appears to be a common organizational feature of many organism centromeres, and also suggest that evolutionary mechanisms that creates higher order repeats are conserved among their genomes. Telomeric repeats are located at the extreme ends of eukaryotic chromosomes and represent a special version of microsatellites (Weising et al. 2005).
Chapter 2: Microsatellites or SSRs (Simple Sequence Repeats)
2.3.2. Regulation of DNA metabolic processes
Recombination. Recombination events are not evenly distributed along the chromosomes rather occur nonrandomly, often clustered in regions called “recombination hot spots” (Ellegren 2004). Several authors have suggested that both the repeat motif and the repetition number of microsatellites play a role as recombination hot spots. In particular dinucleotide repeated microsatellite are proposed as preferentially site for recombination since their affinity with recombination enzymes (Oliveira et al. 2006). Thus, microsatellites can act as evolutionary switches that modulate the mutation rate under condition require rapid evolution and allow the population to respond quickly to changing environmental conditions (Li et al. 2004). Moreover the association between microsatellite and recombination hot spots is stronger for longer repeats, while it is absent or weak for repeats with less then six repeats.
DNA replication and cell cycle. Microsatellites could affect enzymes controlling cell cycles. In fact, during DNA replication as it was observed that some tracts act as arrest site; while in other loci a loss of cell cycle control was observed if mutation occurs.
Mismatch repair system. DNA MMR proteins correct replication errors and actively inhibit recombination between divergent sequences, thus controlling mutation rate and evolutionary adaptation. Anyway the effectiveness of MMR system is strongly influenced by the genomic position and the DNA surrounding the mismatch, moreover the MMR genes are vulnerable to spontaneous indel mutations of a mononucleotide microsatellite within their coding region resulting in MMR deficiency. It was observed that if MMR genes mutate, microsatellite instability increase (Ellegren 2004).
2.3.3. Regulation of gene expression
Microsatellite and transcription. The occurrence of microsatellites within the genes is correlated with changes in the expression of many genes; in particular, the effect of microsatellite on the average transcript level depend on its position within the transcribed region. Microsatellites in introns and 3’ region are often associated with low expression levels, while if the repeats are located in the 5’ region genes have higher than average transcript levels (Shaporova 2008). Moreover, there are several evidences showing that microsatellites located in the promoter regions could affect gene activity, as expansion or deletion of the repeats alters the transcriptional activity of the promoter itself. The number of
Chapter 2: Microsatellites or SSRs (Simple Sequence Repeats)
repeats appears to be a key factor for gene expression and expression level. Moreover, some genes can be expressed within a narrow range of SSR repeats number, and out of this range gene activity would be turned off; while another group of genes show adjusted expression levels by changing their regulatory microsatellite repeat numbers in a more wide range (Li et al. 2002).
Protein binding. Some microsatellites found in upstream activation sequences, serve as binding sites for different regulatory proteins. For instance, the regulation of several genes depends on the binding of the GAGA transcription factor to a small fragment of a CT microsatellite presents in the promoter region of the gene. Moreover, repeat-specific DNA-binding proteins contribute to coordinately regulation of genes as allow chromatin loop formation by bringing the repeats together and clustering the linked loci into different nuclear compartments. Thus microsatellites can create a specific “microlandscape” for a particular group of genes by changing DNA structure locally (Kumar et al. 2010). Different kinds of repeats can interact with a large set of DNA-binding protein leading to different chromatin organization and to different expression pattern (Figure 2.5).
Chapter 2: Microsatellites or SSRs (Simple Sequence Repeats)
Figure 2.5: Long-range interactions mediated by repeats. Repeats can organize chromatin into specific compartments. A: Similar kinds of repeat-associated loci are shown in same colour. B: Associated loci, due to differential expression of corresponding repeat-binding protein (e.g., repeat-interacting protein, green) can allow movement of the associated loci to a common compartment. Such chromatin movement can have regulatory consequences for the associated genes (Kumar et al. 2010).
Translation. Microsatellites are involved in gene translation as expanded repeats may form altered DNA secondary structures that confer genetic instability and most likely contribute to transcriptional silencing (Li et al. 2004). Microsatellites can form a several types
Chapter 2: Microsatellites or SSRs (Simple Sequence Repeats)
of DNA structure and their ability is proportional to the length and the composition of the repeated region (Shaporova 2008).
2.4. Mutation rates and mechanisms
Despite microsatellites have been extensively studied, the mutational dynamics of these regions is not well understood; in fact, their mutation rate is much higher than other part of the genome, ranging from 10-2 and 10-6 nucleotides per locus per generation (Oliveira et al. 2006). There is no uniform microsatellite mutation rate; the rates tend to differ among loci, alleles, and even among species (Ellegren 2004). The mutation rate at a microsatellite depends in part on its intrinsic features and the repeated motif. In general microsatellites with a large number of repeats are more mutable probably due to increased probability of slippage, since larger number of repeats provides more opportunities for misalignment during the reannealing of the nascent strand. Moreover, longer stretches of repeated units pose more problems to polymerase than shorter ones, making longer alleles more prone to slipped strand mispairing. Moreover, mutation rate of microsatellites equal in length have been found to be inversely proportional to their motif size (length of the repeated unit in base pair). A threshold of minimum repeats seems to be required before a microsatellite locus could become hypervariable, but the association between mutation rate and size of repeated region still remained a matter of debate (Bhargava and Fuentes 2010). Even if a threshold size of eight nucleotide irrespective of different motifs was estimated, many workers disagreed and suggested that no critical point exist for microsatellite extension. Mutational rates may not only vary among repeated types, base composition of the repeat and microsatellite type (perfect, imperfect or compound), but also among taxonomic group. Additional factors like repeated motifs, allele size, chromosome position, cell division, sex and the GC content in flanking DNA have been found to affect the rate of mutation at SSR loci. Another important factor is the heterozygosity; in fact, it was observed that microsatellite alleles of any given length are more likely to mutate when their homologue is unusually different in length. Due to the high mutation rate it is to be expected that coding regions have low microsatellite density, otherwise these regions would be significantly altered, possibly leading of loss of functionality SSRs located within genes also show a higher mutation rate with respect of repetitive regions, even if they are less variable with respect to the microsatellites in
non-Chapter 2: Microsatellites or SSRs (Simple Sequence Repeats)
coding regions. Several hypothesis about the evolutionary dynamics of microsatellites have been suggested to explain their high mutation rate:
Point mutation consist in errors during recombination that anyway did not like to be the predominant mechanism in the generation of microsatellite variability.
Unequal Crossing-over that can lead to drastic changes in the number of repeats. This mechanism occurs since the presence of a microsatellite could generate a hairpin during synapsis, meaning that each chromosome homologous received a different number of repeats (Figure 2.6). A possible explanation of high levels of microsatellite variability in recombination hot spots is that recombination is mutagenic to microsatellite, promoting the generating and maintenance of polymorphic repeats in tracts of high recombination.
Figure 2.6: unequal crossing-over between homologous chromosomes, where black and gray regions correspond to repeated sequences (Oliveira et al. 2006).
Replication Slippage could occur during replication or repair and occurs when one DNA strand is temporary dissociated from the other and rapidly rebinds in a different position, leading to base-pair errors and continued lengthening of the new strand.
This may result in an increase in the number of repeats in the allele if the error occurs on the complementary strand or a decreased number of repeats if the error occurs on the parental strand (Figure 2.7). Despite the majority of these slippage events involve the addition/deletion of a single repeat unit, high incidence of multiple repeat units has been observed.
Chapter 2: Microsatellites or SSRs (Simple Sequence Repeats)
Figure 2.7: Slippage during replication, the repeats are represented by box. Slippage leads to the formation of new alleles and the gain or floss of repeats depends on which strain contain the polymerase error (Oliveira et al. 2006).
Some recent studies have suggested that equilibrium distributions of SSR repeat length are a result of balance between slippage events and point mutation (Ellegren 2004). Whereas replication slippage favours growth, point mutation break down a long array into a shorter ones. In fact, mutation within the repeated regions causes an interruption that slip the original repeat into two shorter ones, which would increase locus stability by reducing the substrate for polymer slippage and recombination. The relative rates of point mutation and slippage might be altered by differences in genome structure or organization between species as well as by changes in the efficiency of MMR and proofreading during DNA replication. Although MMR has been found to have a greater effect on SSR stability with respect to proofreading, it should be noted that the effectiveness of MMR proteins is influenced by the presence of a microsatellite in their coding region (see paragraph 2.2.3).
2.5. Origin
As described previously, the genesis of microsatellites in genomes appear to be non-random, with an imbalance between mechanisms that prevent and those that promote the initiation of microsatellites. Current data suggest two alternative, but not mutually exclusive, hypothesis to explain microsatellites genesis:
Chapter 2: Microsatellites or SSRs (Simple Sequence Repeats)
Adopted microsatellites that are brought about in a primal form into a repetitive genomic location by mobile elements
De novo microsatellites hypothesis assumes that a minimum of repeats (proto-microsatellite) is required before DNA polymerase slippage can extend the number of repeats. A proto-microsatellite is a short intermediate stage with as few as 3-4 repeat units, within cryptically simple sequence, which are defined as a scramble of repetitive motifs lacking a clear tandem rearrangement. These proto-microsatellites were initially thought to originate from base substitutions and served as substrate for further expansion. However, subsequent studies showed that proto-microsatellites are often formed without preceding nucleotide substitution, but rather through indel events. A study on insertions in human genes demonstrated that the processes leading to the expansion of microsatellite loci occur even with few repeats. In fact, it was observed that often nucleotide insertions resulted in new repeats, and most of them are not extensions of pre-existing repeats but new microsatellites originating from random sequences (Li et al. 2002).
The alternative model is that microsatellites sequences are adopted from other genomic regions via a number of transposable elements found in abundance in eukaryotic genomes. In mammals association between microsatellites and retrotransposons were observed, in particular it was found that microsatellites rich in A-base were generated by the extension of terminal 3’ of retrotranscripts, similarly to the mRNA polyadenylation mechanism. Anyway, in plants retrotransposition does not seem to be the generalized mechanism of microsatellites genesis, in fact the high density of retrotransposons does not always fit with the density of microsatellites (Morgante et al. 2002).
2.6. Microsatellite transferability
The development of microsatellite markers via traditional methods is expensive and time-consuming, and the PCR primer needed for the amplification of these loci are often species-specific. However many study showed that primer pairs designed for one species can be used for other species from the same genus or even from different genus from the same family (Ellis and Burke 2007). This characteristic is called transferability or cross-species amplification. Transferability can be a very important factor in facilitating the use of microsatellites since it reduces costs when working with species that lack a clear economic importance. Microsatellite transferability amongst related species is allowed by the
Chapter 2: Microsatellites or SSRs (Simple Sequence Repeats)
homologous nature of the DNA sequences in microsatellite flanking regions. Anyway, the successful amplification rate declines as genetic divergence between species increases. Moreover the degree of microsatellite polymorphism is not transferable, thus high levels of polymorphism detected in one species may not be found in another one after primers have been transferred (Oliveira et al. 2006; Barbará et al. 2007).
As described above, mutation rates for length variation in microsatellites have been found to be higher than point mutations rates. In order to explain this difference, two kinds of mutational mechanism have been proposed: replication slippage, and unequal crossing-over. Both processes result in changes in the number of repeat units which is compatible with the observed size polymorphism of microsatellites. One consequence of these mutational mechanisms is that the same genetic state (i.e. number of repeats) may evolve in two different microsatellite lineages through independent mutational events, a phenomenon known as homoplasy. Homoplasic microsatellite alleles are alleles similar in length, but different in descent, thus homoplastic loci are not orthologous. Microsatellite homoplasy can be divided into two types:
microsatellite alleles identical in length, but not in sequence (indistinguishable by fragment length analyses)
alleles identical in both length and sequences, but with different evolutionary history (only detectable through mutations documented in known pedigrees) The likelihood of orthology vs. paralogy of cross-amplified loci will have to be evaluated on a case by case basis (Barbará et al. 2007).
Moreover the generation of non-amplifying alleles (so-called null alleles) could occur when mutation in one or both primer binding site prevents PCR amplification. Homozygous individuals for a null allele do not display any band at all, whereas heterozygotes show only one band therefore appear to be homozygotes on a gel. Undetected null alleles can give the erroneous impression of an apparent homozygote excess in population studies.
2.7. Microsatellite markers in taxonomic studies
There has been much debate about the use of microsatellite markers for phylogenetic studies. Despite multilocus dominant markers (AFLP, ISSR, etc) are broadly used to characterize taxonomic relationship between specimen, microsatellites DNA analyses
Chapter 2: Microsatellites or SSRs (Simple Sequence Repeats)
provides a higher chance that specific alleles rather than unrelated bands are compared with each other. However there are several evidence that could affect the usefulness of microsatellites such as the unpredictable mutation rate, the possible constrained range of alleles size and the frequent occurrence of indel events in the flanking sequences. Anyway, one important determinant of the extend of markers transferability across species is the source and characteristic of the library of origin. Thus primers binding site are expected to be more conserved when the microsatellite flanking sequences are maintained under selective constraints. Consequently microsatellites within the transcribed regions provide good chances to design primer pairs that are broadly transferable among taxa and even within plant families (Ellis and Burke 2007). EST-derived microsatellite markers usually are less polymorphic than genomic microsatellites, but often show an increased level of conservation between taxa.
2.8. Potential applications
Compared with other class of molecular markers microsatellites are highly polymorphic, because of which they have been used not only to answer several questions related to plant population genetics, such as gene flow and paternity analysis but also for the study of natural population. The knowledge of the distribution of genetic variability between and within natural plant populations is essential to adopt competent strategies for ex situ and in situ germplasm conservation and microsatellites are extremely useful for estimating genetic population parameters as population structure, parentage and paternity analysis, and gene flow.
Chapter 3: Population genetics in plants
Chapter 3
Population genetics in Plants
3.1. Population genetics: goals and applications
Population genetics study frequencies of occurrence of alleles and genotypes within and between populations. It is also the study of changes in gene frequencies and, therefore, is closely related to evolutionary genetics, as evolution depends heavily on changes in gene frequencies. The nature, timing and geographic context of historical events and population processes shape the spatial distribution of genetic diversity. This issue is, therefore, critical for addressing questions relating to speciation, selection, and applied conservation management (Garrick et al. 2010). Genetic variation is usually distributed in a hierarchical way: within and between individuals, within or among populations, within regions of origin or all regions inhabited by a species (Weising et al. 2005). Following the analyses of variation and how it is partitioned over these hierarchical levels, important conclusions about the biology of a species can be drawn. The amount of genetic variation in a species and its distribution among populations is determined by a large number of factors including the mating system, environmental barriers, the demographic history, the effective population size, and the extend of gene flow regarding migration or seed dispersal between populations. Sometimes in plant it is possible to observe gene flow between different species, hybridization between crop and wild relatives are well documented, and introgression between sympatric species are often reported for forest trees (Gugerli et al. 2008). Moreover, as species geographical distribution is usually more extended than an individual’s dispersal capacity, populations are often genetically differentiated through isolation by distance (Balloux and Lugon-Moulin 2002). Hence, populations in close proximity are genetically more similar than more distant populations. Long lived, outcrossing and late successional taxa retain most of their variation within population, whereas annual, selfing, and early successional taxa allocate more variation among populations (Belaj et al. 2007). Within-population diversity, in general, is negatively correlated with the level of population differentiation (Weising et al. 2005).