The Uromodulin Gene Locus Shows Evidence of
Pathogen Adaptation through Human Evolution
Silvia Ghirotto,* Francesca Tassi,* Guido Barbujani,* Linda Pattini,
†Caroline Hayward,
‡Peter Vollenweider,
§Murielle Bochud,
§Luca Rampoldi,
|and Olivier Devuyst
¶*Department of Life Sciences and Biotechnology, University of Ferrara, Ferrara, Italy;†Department of Electronics, Information and Bioengineering, Politecnico di Milano, Milan, Italy;‡Institute of Genetics and Molecular Medicine, University of Edinburgh, Edinburgh, United Kingdom;§Department of Internal Medicine, Institute of
Social and Preventive Medicine, Lausanne University Hospital Center, Lausanne, Switzerland;|Division of Genetics and Cell Biology, San Raffaele Scientific Institute, Milan, Italy; and¶Institute of Physiology, University of Zurich,
Zurich, Switzerland
ABSTRACT
Common variants in the
UMOD gene encoding uromodulin, associated with risk
of hypertension and CKD in the general population, increase
UMOD expression
and urinary excretion of uromodulin, causing salt-sensitive hypertension and renal
lesions. To determine the effect of selective pressure on variant frequency, we
in-vestigated the allelic frequency of the lead
UMOD variant rs4293393 in 156 human
populations, in eight ancient human genomes, and in primate genomes. The T allele
of rs4293393, associated with CKD risk, has high frequency in most modern
popu-lations and was the one detected in primate genomes. In contrast, we identified
only the derived, C allele in Denisovan and Neanderthal genomes. The distribution
of the
UMOD ancestral allele did not follow the ancestral susceptibility model
ob-served for variants associated with salt-sensitive hypertension. Instead, the global
frequencies of the
UMOD alleles significantly correlated with pathogen diversity
(bacteria, helminths) and prevalence of antibiotic-resistant urinary tract infections
(UTIs). The inverse correlation found between urinary levels of uromodulin and
markers of UTIs in the general population substantiates the link between
UMOD
variants and protection against UTIs. These data strongly suggest that the
UMOD
ancestral allele, driving higher urinary excretion of uromodulin, has been kept at a
high frequency because of its protective effect against UTIs.
J Am Soc Nephrol 27: 2983–2996, 2016. doi: 10.1681/ASN.2015070830
Uromodulin (Tamm–Horsfall protein)
is the most abundant protein excreted
in the urine.
1,2Uromodulin is exclusively
produced in the kidney by epithelial cells
lining the thick ascending limb (TAL) of
the loop of Henle, where it is sorted to the
apical plasma membrane and released
into the tubular lumen by proteolytic
cleavage. Although the biologic role of
uromodulin remains mysterious, studies
in knockout mice have shown that
uromo-dulin regulates NaCl transport processes
operating in the TAL,
3,4protects against
urinary tract infection (UTI),
5and
regu-lates innate immunity.
6The interest in uromodulin was
boos-ted when genetic studies revealed that
mutations of the UMOD gene, which
encodes uromodulin, can cause rare
forms of autosomal dominant
tubuloin-terstitial kidney diseases.
7,8These disorders
may include impaired urinary
concen-trating ability, hyperuricemia, and/or
gout, and they often lead to CKD and
ESRD between the second and fourth
decade of life. Analyses in renal biopsies
and in mouse models of autosomal
dom-inant tubulointerstitial kidney disease
revealed intracellular aggregates of
mu-tant uromodulin in the TAL cells, coupled
with a systematic decrease of uromodulin
excretion in the urine.
9–11In parallel, multiple genome-wide
association studies (GWAS) and
se-quencing efforts have identified
com-mon single nucleotide polymorphisms
(SNPs) in UMOD that are strongly
asso-ciated with eGFR and the risk for
develop-ing CKD in the general population.
12–16The SNPs in UMOD were also associated
with the risk of developing hypertension
and kidney stones.
17,18The top variants
from these GWAS studies consistently
map in the same linkage disequilibrium
block encompassing the UMOD
pro-moter. Recently, we demonstrated that
Received July 28, 2015. Accepted January 30, 2016.
S.G. and F.T. are equalfirst authors; L.R. and O.D. are equal senior authors.
Published online ahead of print. Publication date available at www.jasn.org.
Correspondence: Dr. Luca Rampoldi, Division of Genetics and Cell Biology, San Raffaele Scientific Institute, I-20132 Milan, Italy, or Dr. Olivier De-vuyst, Institute of Physiology, University of Zurich, Winterthurerstrasse 190, CH-8057 Zurich, Swit-zerland. Email: [email protected] or olivier. [email protected]
Copyright © 2016 by the American Society of Nephrology
these UMOD risk variants directly
in-crease the expression of uromodulin in
vitro and in vivo, while increased
uromo-dulin expression causes salt-sensitive
hy-pertension and kidney lesions in mice
and humans (Table 1).
19Meta-analyses
have shown that the UMOD variant
rs4293393, strongly associated with
eGFR and BP, is also the top variant
as-sociated with uromodulin level in urine,
confirming its biologic effect on
pro-moter activity.
16The unusually high frequency of the
UMOD risk variants (70%–80% in
Afri-cans and Europeans and 92%–95% in
East Asians), combined with strong
bi-ologic activity, suggests the action of
some sort of selective pressure.
20Based
on known properties of uromodulin,
such pressures could be linked to salt
avidity or, alternatively, to antimicrobial
activity. The aims of the present study
were to characterize the ancestry of the
top risk UMOD promoter variant
rs4293393, to explore whether the high
prevalence of this variant is due to
selec-tive pressure, and to investigate the
na-ture of such a potential selection.
UMOD Variant in Nonhuman
Primates and Ancient Hominids
The top rs4293393 UMOD variant
iden-ti
fied in previous GWAS has two alleles:
T, the major allele associated with risk of
hypertension and CKD, and C, the
mi-nor allele. To place the observed modern
human variation in its evolutionary
context, we evaluated the allelic status
of rs4293393 in 25 individuals from
the four chimpanzee subspecies,
21and
in available genomes of other
nonhu-man primates. All the individuals
analyzed were homozygous for the T
al-lele, identifying it as the ancestral one
(Figure 1).
We next evaluated the UMOD allelic
status in the two ancient hominid
genomes at high coverage currently
available, namely the Denisova and the
Neanderthal,
22,23from which
present-day humans diverged some 550,000–
750,000 years ago, respectively,
23,24and
in anatomically modern human samples
spanning a period 3900–45,000 years
ago (Supplemental Table 1). This
inves-tigation showed that only the ancestral,
T allele is present in the genomes of
an-atomically modern humans, whereas the
archaic hominids were homozygous for
the derived, C allele (Figure 1).
Since the genomic region around
rs4293393 is not among those
identi-fied in the modern human genome as of
putative Neanderthal origin,
23an
expla-nation for the observed pattern could be
that the derived, C allele arose in the
hu-man lineage after separation from the
one leading to the chimpanzees (6
mil-lion years ago), but before Neanderthals
and Denisovans separated from modern
human lineage as distinct groups (Figure
1).
23The probability of being homozygous
for the derived allele of two individuals
randomly chosen from a population
with the allele frequencies of current
European populations (about 0.20) is
0.0016. Although a meaningful
statisti-cal comparison cannot be based on two
individuals only, this low probability
suggests that archaic hominids did
have a higher frequency of the derived
rs4293393 allele than modern
Euro-peans. In turn, this supports the
possibil-ity that the recent evolution of modern
humans did not allow the derived allele
to rise to high frequencies, as it
proba-bly did in archaic humans, or that the
evolutionary forces acting on archaic
and modern humans were somehow
different.
Does the Ancestral Susceptibility
Model Apply to
UMOD Variants?
Since the Tallele of rs4293393, associated
with risk for CKD and hypertension, is
the ancestral one and is associated with
salt retention, we hypothesized that the
ancestral susceptibility model could be
applied to the UMOD locus.
25This
model pertains to alleles that underwent
ancient adaptations. With a shift in
environment and lifestyle, the ancestral
alleles no longer confer a selective
advantage but rather increase the risk
of common diseases, while the derived,
protective alleles become neutral or
moderately advantageous and increase
in frequency. This model potentially
ap-plies to variants influencing the risk of
hypertension, since ancient populations
adapted to hot, humid areas by retaining
salt. In turn, these ancestral alleles
favor-ing salt retention increase the risk of
hypertension in modern populations
living in cooler, temperate climates.
The ancestral susceptibility model
predicts a relatively recent change in
the selective pressure, approximately at
the time of modern human dispersal
from Africa (about 50,000
–70,000 years
ago).
26It is supported by a change of
allelic frequencies along the latitude,
re-flecting environmental adaptations, with
African populations showing higher
fre-quencies of the ancestral (risk) allele,
and non-African populations showing
Table 1. The rs4293393 promoter variant of the
UMOD gene
rs4293393 Documented in Archaic Humansa Frequencyb UMOD Expression Urinary Uromodulin Levels GWAS CKD, Hypertension GWAS Kidney Stones Potential Role for UTI Potential Selective Pressure Ancestral T allele
No 0.80 High High Risk (higher.65 yr)c Protective Protective Positive or
Neutral Derived
C allele
Yes 0.20 Low Low Protective (higher.65 yr)c Risk Deleterious Negative or Neutral
References 19 16,19 12–14,17,18,80,81 18
aNeanderthal and Denisova. b1000 Genomes latest release.82
higher frequencies of the derived
(pro-tective) allele.
27To test this hypothesis, we used
world-wide databases of genomic variation and
compared the distribution of rs4293393
with classic variants associated with salt
conservation and ancestral susceptibility.
The ancestral A-6G and T235M variants
of the AGT gene coding for
angiotensi-nogen are increasing the risk of
hyper-tension, whereas the derived allele is
protective and carries the signature of
positive natural selection.
28,29Similarly,
the ancestral allele of CYP3A5, coding
for a member of the cytochrome P450
superfamily of enzymes involved in
steroid synthesis, is associated with
increased BP in blacks whereas the
de-rived, protective variant CYP3A5*3
re-sults in a nonfunctional protein.
30,31The populations for which we have
ge-netic information for rs699 (AGT ),
rs776746 (CYP3A5), and rs4293393
(UMOD), along with allele frequencies
and references, are listed in
Supplemen-tal Table 2. The observed geographic
pattern for the rs4293393 UMOD
vari-ant reveals that the most frequent allele
outside Africa is the ancestral one,
whereas the derived allele reaches its
highest frequencies in populations
from Equatorial Africa and South
America. This distribution does not
fit
the ancestral susceptibility model, being
in fact somewhat opposite to that
ob-served for AGT and CYP3A5 (Figure 2).
We also tested the distribution of
UMOD rs4293393 against that of
two closely linked variants (T555I,
rs75770792; Q568P, rs111253292) in
the CORIN gene, as described by Dries
et al.
32The derived allele (I555/P568) of
CORIN is associated with increased risk
of hypertension and cardiac
hypertro-phy due to decreased conversion of
proatrial natriuretic peptide into active
proatrial natriuretic peptide, a cardiac
hormone that regulates BP and salt–
water balance.
33The distribution of
UMOD was fundamentally different
from that of CORIN which is
character-ized by the exclusive presence of the
ancestral, protective allele in most of
the populations analyzed, with the
ex-ception of few groups from Africa or of
African origin (e.g., Yoruba in Ibadan
Nigeria, African Caribbeans in Barbados)
showing a very minor frequency (
,10%)
of the derived, risk allele (Supplemental
Figure 1, Supplemental Table 3).
Analysis of molecular variance showed
that differences in allele frequencies
be-tween African versus European
popula-tions were much lower for the UMOD
variant (4.8% between groups) than at
AGT and CYP3A5 loci (45.2% and
64.9%, respectively) (Table 2). Although
signi
ficant, the amount of genetic
varia-tion attributable to differences among
groups for rs4293393 is comparable
with that known for whole genome
neu-tral variants.
34Furthermore, the African
versus European
fixation index (F
ST)
es-timated for the UMOD variant does not
depart from the distribution of the F
STvalues observed at random intergenic
(and hence presumably neutral) regions
(Figure 3). These data suggest that the
derived allele of UMOD has not been
un-der strong selective pressure. A possible
explanation for these
findings is that the
UMOD derived allele did not confer the
selective advantage expected under
the ancestral susceptibility model, hence
it did not rapidly increase in frequency.
Other selective regimes, or more
sophis-ticated models incorporating
demogra-phy and environmental factors, are
needed to account for the current
fre-quency and distribution of the UMOD
variant.
Dating and Testing Positive
Selection of the
UMOD Derived
Variant
To evaluate in greater detail the
possibil-ity of positive selection on the UMOD
derived allele, we incorporated past
de-mography in the model. For that
pur-pose, we reconstructed the haplotypes
of the carriers of the derived allele for
surrounding neutral markers. This way,
we could infer recombination rates,
from which we obtained estimates of
the age of the variant in the population
and of its intrinsic rate of growth.
35Assuming a generation time of 25
Figure 1. Genomic sequence variation at UMOD variant rs4293393. Schematicrepre-sentation of the UMOD locus showing the localization of the top variant rs4293393 in the gene promoter. The alignment shows the genetic variation in the genomic region sur-rounding the variant. Phylogenetic relationship among the considered species is also shown. Only the major, T allele is detected in all ancient genomes that are collectively indicated as“Anatomically Modern Humans”. By contrast, only the minor, C allele is de-tected in the archaic genomes of Denisova and Neanderthal. The characteristics of the analyzed genomes are listed in Supplemental Table 1.
years,
36this analysis allowed us to
esti-mate that the UMOD derived allele started
increasing in frequency approximately
15,000 years ago, with limited differences
among African and non-African
popula-tions (Table 3). The population sizes we
chose were based on census data. An
al-ternative, somewhat arbitrary choice of
population size (i.e., 10 million) did not
substantially affect the results. The
esti-mated growth rates associated with the
derived UMOD allele are low (and hence
compatible with neutral allele-frequency
changes), but still comparable with those
found in loci affected by recent positive
selection, e.g., protective variants for
type 2 diabetes, i.e., between 1.021 and
1.027.
37Based on the same haplotype
data, we could then explicitly test for
positive selection by computing the
inte-grated haplotype scores, so as to compare
the decay of homozygosity around the
UMOD rs4293393 variant for the
ances-tral and the derived alleles, in each
pop-ulation. The results obtained were not
significant, providing further evidence
that the derived allele of rs4293393 has
not been under selective pressure
(Sup-plemental Figure 2).
Global Correlations of
UMOD
Alleles with Environmental
Variables and Prevalence of
Uropathogens
The discrepancies between the
distribu-tion of allelic frequencies of UMOD
rs4293393 and that of other variants
in-volved in salt retention and BP control
led us to envisage alternative
mecha-nisms of selection, related to
environ-mental factors. Genome-wide signatures
of natural selection can be driven by
ad-aptation to local environments or
path-ogen diversity.
38,39Furthermore, the
number of different pathogen species
in a certain geographical region can
be a good estimator of the selective
pres-sure for the population.
40–42Based on
multilevel biologic evidence, we
hypothe-sized that the functional UMOD variant
may play a role in protection against
UTIs. Indeed, thanks to its biochemical
properties, i.e., high-mannose glycans
and Sda carbohydrate antigen,
uromo-dulin acts as an incidental receptor that
can effectively bind pathogens of the
uri-nary tract, typically type 1
fimbriated
Escherichia coli, competing with their
binding to urothelial cells.
43Accordingly,
uromodulin knockout mice show
decreased bacterial clearance and
in-creased susceptibility to UTIs by E.
coli,
5,44and patients harboring
heterozy-gous UMOD mutations, associated with
lower levels of uromodulin in the urine,
may present with repeated UTIs.
45,46We thus assessed whether the
rs4293393 UMOD variant displays
sig-nals of genetic adaptation to local
envi-ronmental variables including climate,
diet, and pathogens. We exploited the
Figure 2. The allelic frequency distribution of the rs4293393 UMOD variant does notfitthe ancestral susceptibility model. Distribution of ancestral (blue) and derived (red) allele frequencies in 156 worldwide populations at the following variants: rs4293393 of the UMOD gene (top), rs699 of the AGT gene (central), and rs776746 of the CYP3A5 gene (bottom).
Human Genome Diversity Project
(HGDP-CEPH),
47containing genotypes
of more than 650,000 SNPs for about
1,000 individuals sampled in 52 human
populations worldwide, in order to
cor-relate the frequency of the ancestral,
risk allele in these populations with the
diversity of environmental variables.
This analysis revealed that the
frequen-cies of the rs4293393 ancestral allele
are significantly correlated with
patho-gen diversity, bacteria and helminths
in particular, but not with other
patho-gens (viruses and protozoa) or other
environmental variables, including
cli-mate and diet regimen (Figure 4).
When considering all SNPs in the
HGDP database having a similar minor
allele frequency (
60.01), the UMOD
var-iant is above the 85th percentile (0.15) of
the empirical P value distribution, which is
consistent with previous estimates of the
proportion of the human genome that
underwent pathogen-driven selection.
39Of note, the two SNPs in AGT and
CYP3A5 involved in salt retention were
not correlated with diversity of bacteria
and helminths (data not shown).
We next analyzed data about the
global prevalence of multidrug-resistant
Gram-negative bacteria, including
uro-pathogenic E. coli, which re
flects
geo-graphical variations in the prevalence
of UTIs.
48,49There was a signi
ficant
cor-relation between the UMOD ancestral
allele frequencies and the prevalence of
antibiotic (fluoroquinolone and
cepha-losporin) resistance in Gram-negative
uropathogens (Figure 5, Supplemental
Table 4). The empirical P values for these
correlations were 0.17 and 0.14,
respec-tively, similar to the correlation with
pathogen diversity. These data suggest a
higher frequency of the UMOD ancestral
allele in areas where the prevalence of
UTIs is higher.
Uromodulin and Markers of UTIs in
the General Population
Meta-GWAS have shown that the
UMOD ancestral variant is strongly
associated with higher levels of
uromo-dulin in the urine in large cohorts.
16Fur-thermore, the UMOD genotype is an
independent predictor of urinary
uro-modulin in the general population.
50In
order to substantiate a protective effect
of uromodulin, we analyzed its urinary
levels against markers of UTIs in the
population-based Cohorte Lausannoise
(CoLaus) cohort (n=5447). The
relation-ship between the urinary uromodulin/
creatinine ratio in spot urine and the
amount of urinary leukocytes grouped
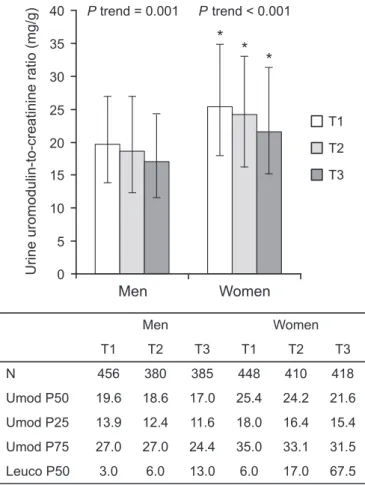
in tertiles is shown in Figure 6. In both
men and women, urinary leukocytes
were higher when uromodulin levels
were lower. In each tertile, men had a
sig-nificantly lower median uromodulin/
creatinine ratio than women (P,0.001).
Men also had lower median leukocyte
counts than women (P,0.001). Overall,
54 participants among the 2497 CoLaus
participants with available information
had positive nitrites in spot urine.
When accounting for urinary creatinine,
age, and sex, urinary uromodulin was
negatively associated with the presence
of urinary nitrites (Table 4). In the entire
CoLaus cohort, the urinary uromodulin/
creatinine ratio in spot urine, which is
significantly dependent of the UMOD
ge-notype, was negatively associated with
Figure 3. Allelic frequencies of the rs4293393 UMOD variant do not show significantvariation between African and European populations. Comparison between the FSTvalues
estimated between African and European populations for 2000 random noncoding re-gions (histogram), rs4293393 of the UMOD gene, rs699 of the AGT gene, and rs776746 of the CYP3A5 gene.
Table 2. Analysis of molecular variance of selected variants in African versus
European populations
Marker Variations between Groups (%)
Variations between Populations within Groups (%) Variations within Populations (%) UMOD (rs4293393) 4.82 3.93 91.25 AGT (rs699) 45.20 3.20 51.60 CYP3A5 (rs776746) 64.93 10.83 24.24
circulating ultrasensitive C-reactive
pro-tein (CRP) in premenopausal women but
not in postmenopausal women nor in
men (Supplemental Table 5).
Further-more, we could detect an association
be-tween rs12917707 (which is in almost
complete linkage disequilibrium [R
2=
0.95, D’ = 1] with rs4293393) and
ultra-sensitive CRP in the overall CoLaus
co-hort (n=4803; Tobit regression, P,0.04).
When strati
fied by sex and menopausal
status, this association was present only
in premenopausal women (n=1081;
Tobit regression, P
,0.004), who are at
much greater risk of UTIs.
Taken together, these data suggest that
the high prevalence of the UMOD
ances-tral allele, which is associated with risk
of salt-sensitive hypertension and CKD,
is not explained by the ancestral
suscep-tibility model. The global distribution
of the UMOD variant is clearly different
from the AGT and CYP3A5 variants,
classically associated with that model.
It is also different from other variants
(e.g., CORIN) in
fluencing salt retention.
Instead, the global correlations between
the ancestral allele of UMOD and
path-ogen diversity and uropathpath-ogenic E. coli
prevalence, as well as its in
fluence on
the level of uromodulin in urine, suggest
that this allele has been kept at high
frequency due to its protective effect
against UTIs and their consequences in
terms of
fitness and reproduction. This
hypothesis is supported by the inverse
correlation between urinary levels of
uromodulin and markers of UTIs in the
general population, and by the fact that
the frequency of the derived allele of
UMOD has not been under selective
pressure and remains low (Table 1). In
the case of UMOD, there is no balancing
selection: the fact that the association of
UMOD variants with CKD is clearly
age-dependent, only being evident after
the age of 65 years,
14,18implies that the
derived allele should have no direct
im-pact on reproductive
fitness.
Among the various environmental
factors, pathogens have posed the main
selective pressure, shaping the human
genome and leading to local genetic
adaptations.
39The gene targets of such
pathogen-driven selection are mostly
re-lated to immune response and include
MHC class I, blood group antigens,
and interleukins and their receptors.
However, genes not directly
participat-ing in immune response may also be
involved: for instance, genes encoding
complex sialoglycoproteins which can
function as incidental pathogen
recep-tors are known to be targeted by
patho-gen-driven selection in humans.
51This
is particularly relevant when
consider-ing that uromodulin contains complex
sialylated and fucosylated
oligosaccha-rides which are key to its binding to type 1
fimbriated E. coli and to its capability
to modulate the susceptibility and
viru-lence of UTIs.
52,53UTIs are among the
most common bacterial infections, with
particularly high incidence and risk of
re-currence in young women and
poten-tial complications affecting pregnancy
outcome and even leading to septic
shock and death.
54,55Increasing
evi-dence shows that host defense
mecha-nisms against uropathogenic E. coli,
which causes
.80% of UTIs, influence
the recurrence and severity of UTIs.
56At
physiologic concentrations, uromodulin
abolishes the binding of E. coli to uroplakin
receptors and, through its interactions
with host factors like IgG heavy and light
chains, facilitates neutrophil migration.
57,58Conversely, uropathogenic E. coli were
more abundant, caused more severe renal
infections and acute mortality, and
persis-ted longer in uromodulin knockout mice.
5Our data, showing for the
first time an
inverse correlation of urinary uromodulin
levels and local and systemic markers of
UTIs, support the view that higher levels
of uromodulin in the urine, determined
by the presence of the UMOD ancestral
allele,
50exert a protective effect against
UTIs in the general population.
Besides direct binding to
uropatho-gens, the protective effect of the UMOD
ancestral allele may also depend on the
ability of uromodulin to regulate innate
immunity by activating dendritic cells
via Toll-like receptor 4 (TLR4).
6Inter-estingly, the geographical distribution of
the rs4293393 alleles is comparable (52%
correlation between worldwide
frequen-cies of the two ancestral alleles) with that
of the nonsynonymous rs4986790 variant
(Asp299Gly) in TLR4, associated with
increased risk of infections mediated
by Gram-negative bacteria, including
E. coli,
59and risk of UTIs in children.
60Like UMOD, this TLR4 variant showed a
signi
ficant correlation with the diversity
of bacteria and helminths (data not
shown). Other studies, mostly on
poly-morphisms in TLR genes, established the
importance of the early response against
invading pathogens that is essentially
provided by innate immunity.
52Of note, the UMOD ancestral allele
may also have an additional, protective
effect against infections by impacting
Table 3. Joint estimate of growth rate (r) and age (g) of the derived allele of
UMOD rs4293393
Population Census Size Growth Rate (r) Age of Mutation (g) CEU 5,000,000 1.02 (1.01 to 1.02) 13,938 (11,905 to 17,133) GIH 5,000,000 1.01 (1.01 to 1.02) 17,755 (15,223 to 21,780) LWK 5,300,000 1.01 (1.01 to 1.02) 18,173 (15,485 to 22,570) MEX 5,000,000 1.02 (1.02 to 1.03) 12,868 (10,920 to 16,265) MKK 850,000 1.01 (1.01 to 1.02) 19,180 (16,205 to 23,358) YRI 36,000,000 1.02 (1.01 to 1.02) 19,340 (16,918 to 23,400) Population Arbitrary Size Growth Rate (r) Age of Mutation (g) CEU 10,000,000 1.02 (1.02 to 1.03) 13,838 (11,943 to 16,878) GIH 10,000,000 1.02 (1.01 to 1.02) 17,655 (15,288 to 21,485) LWK 10,000,000 1.01 (1.01 to 1.02) 18,080 (15,563 to 22,265) MEX 10,000,000 1.02 (1.02 to 1.03) 12,775 (10,973 to 15,960) MKK 10,000,000 1.01 (1.01 to 1.02) 18,773 (16,375 to 22,383) YRI 10,000,000 1.02 (1.02 to 1.03) 19,510 (16,780 to 23,963)
CEU, European ancestry; GIH, Gujarati Indians in Houston; LWK, Luhya in Webuye, Kenya; MEX, Mexican ancestry in Los Angeles; MKK, Maasai in Kinyawa, Kenya; YRI, Yoruba in Ibadan, Nigeria. The 95% confidence interval for growth rate and age estimates is shown in brackets.
on tubular salt handling. Uromodulin is
known to regulate apical transport
systems in the TAL and in downstream
nephron segments.
19,61An increased
ability to retain salt would confer an
advantage in the case of other types of
infections associated with salt-losing,
particularly at a young age.
The global correlations between the
UMOD ancestral allele frequencies and
pathogen diversity or prevalence of UTIs
support the hypothesis that this allele
has been kept at higher frequencies in
areas with stronger selective pressure
for its protective effect. Selection would
hence have acted on an already present
allele, following the model of selection
on standing variation.
62In this case,
cor-relations between genetic variants and
environmental variables may indeed be
the most appropriate to assess evidence
of selection,
63as observed for the
ances-tral -3826A allele in UCP1, that has been
kept at higher frequencies in populations
at high latitude exposed to low solar
ra-diation.
64The UMOD situation is
there-fore different from the paradigm of
selection at the APOL1 locus, where it
is the derived allele that confers selective
advantage against pathogens.
65,66It is interesting to note that among the
populations that drive the correlation
between UMOD variant and
patho-gens, the three African populations
that show the lowest ancestral allele
fre-quency (Biaka Pigmies, Mbuti Pigmies,
San) (Supplemental Table 2),
associ-ated with low levels of pathogen
diver-sity, are characterized by the highest
values of gathering activity.
39This is
consistent with gathering activity being
associated to mobile populations that
are less prone to infectious disease
transmission compared with sedentary
cultures with increasing population
Figure 4. The frequencies of the UMOD ancestral allele correlate with bacteria and helminth diversity. Correlation between the frequency of the UMOD ancestral T allele for rs4293393 in different populations (data from the Human Genome Diversity Panel, HGDP-CEPH) and diversity of (A) bacteria, (B) helminths, (C) viruses, and (D) protozoa. The trend was estimated using the Theil–Sen method. Populations from different continents are represented by different symbols: Africa (○), Asia (x
), America (□), Oceania (◊
), Europe (△).density.
67,68This concept may also be
extended to the intriguing
observa-tion that both anatomically archaic
humans were homozygous for the
UMOD derived allele, whereas all
an-atomically modern humans showed
homozygosity for the ancestral allele.
While little is known about Denisova
demography, archaeological data
sug-gest that Neanderthal population sizes
were around one tenth of those of their
contemporary anatomically modern
counterparts.
69Therefore, we
specu-late that differences in population
densities between Neanderthals and
pre-Neolithic Homo sapiens could justify
different selective regimes driven by
path-ogens, hence different frequencies of the
UMOD derived allele.
70There is no published GWAS for
susceptibility to UTIs, and thus no direct
evidence for an UMOD locus in
fluencing
the trait. This absence is explained at least
in part by the difficulty to obtain reliable
and standardized urinary samples, and to
ascertain UTIs in a population setting.
Additional genetic analyses directly
evaluating the influence of the UMOD
genotype on the UTI phenotype will thus
be important.
We acknowledge that our study
pro-vides circumstantial evidence rather
than direct proof or a clear signature of
adaptation. Formal tests for the effect of
positive selection assume that the
selec-tive process affects the derived allele.
When, as is the case for UMOD, the
can-didate allele is ancestral, there is no way
to generate formal expectations of its
frequency and distribution. This is
be-cause we do not know the set of neutral
evolutionary changes leading to the
dis-tribution of allele frequencies at the
mo-ment when selection begins to operate.
Therefore, a neutral model accounting for
the high frequency of the UMOD ancestral
(CKD risk) variants cannot be rejected.
However, several lines of evidence
concur to strongly suggest an
evolution-ary advantage for carriers of the ancestral
UMOD allele (summarized in Table 1),
including: (1) robust biochemical
evi-dence showing that uromodulin binds
type 1
fimbriated E. coli, (2) increased
susceptibility to UTIs in uromodulin
knockout mice, (3) inverse correlation
between uromodulin urinary levels and
markers of UTIs in the general
popula-tion, (4) global spatial correlations of
UMOD allelic frequencies with
patho-gen diversity and prevalence of resistant
uropathogenic E. coli strains, and (5)
correlation between the distribution
pat-terns of allelic frequencies of UMOD and
of a well established TLR4 variant
associ-ated with UTI susceptibility. Further work
should provide opportunities to
substan-tiate the link between the UMOD gene,
uromodulin, and a protective effect
against damaging consequences of UTIs
in the general population.
CONCISE METHODS
Phylogenetic Analysis of
UMOD
Variant rs4293393
To study the phylogenetic context of the
UMOD rs4293393 we investigated the region
surrounding the variant in four nonhuman
primates (Gorilla, Orangutan, Gibbon, and
Rhesus) from the University of California at
Santa Cruz genome browser (http://genome.
Figure 5. The frequencies of the UMOD ancestral allele correlate with the prevalence of antibiotic resistance in Gram-negative pathogens. Correlation between the frequency of the ancestral T allele for UMOD variant rs4293393 in different populations and preva-lence (%) of antibiotic-resistant Gram-negative pathogens of the urinary tract, as available in Zowawi et al.48The trend was estimated using the Theil–Sen method. The complete
ucsc.edu/), in 25 chimpanzee genome
se-quences from Prado-Martinez et al.,
21in two
ancient hominid genomes (i.e., Neanderthal
and Denisova), and in anatomically modern
human samples spanning a period 3900–
45,000 years ago. Information on the
character-istics of the ancient samples and references are
provided in Supplemental Table 1. We extracted
the sequence information from complete
ge-nomes using VCFtools.
71Sequences spanning
rs4293393 were aligned to the modern human
genome sequence (assembly GRCh37/hg19).
Analysis of Allelic Frequency
Distribution of
UMOD, AGT,
CYP3A5, and CORIN Variants
To compare the allele frequency distribution
of the UMOD (rs4293393), AGT (rs699), and
CYP3A5 (rs776746) variants, we collected
genomic data from worldwide datasets of
ge-nomic variation (see Supplemental Table 2
for details and references). From these
data-sets we selected the populations reporting the
allele frequencies information for at least one
of the three variants, while having a sample
size of at least ten individuals; the
final dataset
resulted in 156 populations from all over the
world. Since most of the datasets used above
do not include information about the CORIN
variant (rs75770792), we checked its presence
in all other available datasets. We identified 44
worldwide populations with a sufficient
num-ber (.8) of individuals typed for both
CORIN-and UMOD-relevant SNPs (rs75770792 CORIN-and
rs4293393, respectively) (see Supplemental
Table 3 for details and references), thus
al-lowing a direct comparison between the
distributions of allele frequencies.
We combined the data and estimated the
allele frequencies using PLINK
72; we then
plotted the allele frequencies on a geographic
map with the mapplots R package. The
analysis of molecular variance for UMOD
(rs4293393), AGT (rs699), and CYP3A5
(rs776746) was conducted with the pegas R
package.
73From 8473 variants that are
shared among the 156 populations, we
se-lected 2351 intergenic (i.e., neutral) loci using
the Variant Effect Predictor tool.
74We
extracted the allele frequencies information
at these loci in the 156 populations with
PLINK, and then we calculated the F
STvalues
with 4P software.
75Dating of the
UMOD rs4293393
Variant
To date the UMOD derived variant we used
the Austerlitz likelihood-based method.
35This maximum likelihood algorithm
requires a preliminary reconstruction of the
haplotypes of the carriers of the derived allele
for surrounding neutral markers. Then the
number of generations elapsed since the
var-iant entered the population and the varvar-iant’s
intrinsic growth rate are estimated from the
percentage of recombinant haplotypes and
from the carrier frequency of the derived
allele in the population. As this method
re-quires reconstructing the haplotypes
carry-ing the derived variant, we exploited the
International HapMap Project populations,
dating the derived variant in each population
separately. To reconstruct the haplotypes we
chose nine SNPs on each side of the target
variant, at about 20, 35, 50, 75, 100, 125,
150, 200, and 250 kb distance from the
target variant, respectively. We used the
International HapMap Project data from
populations for which phase information
were available (i.e., CEU, GIH, LWK,
MKK, and YRI) to compute the integrated
haplotype scores with the rehh R package.
The integrated haplotype score estimates
were standardized per allelic frequency
bins using genome-wide data.
76The same
populations were then used to estimate the
time elapsed since the appearance of the
de-rived allele and its intrinsic growth rate
with the Austerlitz et al. method as
imple-mented in their Mathematica notebook.
35The MEX population was only used for dating
the derived allele, as no ancestry information
was available.
Figure 6. Inverse relationship between urinary levels of uromodulin and urinary leuko-cyte counts in CoLaus. N represents sample sizes in each tertile (total n=2497). Bars rep-resent median uromodulin/creatinine ratio in spot urine in each sex-specific tertile of urinary leukocytes. Data are uromodulin-to-creatinine medians (Umod P50) and whiskers interquartile range (Umod P25 and Umod P75). P values for trend are from a nonparametric test for trend across sex-specific leukocyte tertiles. *P,0.001 for median test comparing men and women. Leuco P50: median leukocyte counts in each tertile.
Correlation of Allelic Frequencies of
rs4293393 with Environmental
Parameters
Genotypes of rs4293393 in individuals
from the 52 populations of the
HGDP-CEPH panel were retrieved from the
cor-respondent website (Human Genome
Diversity Panel Database Version 3.0,
http://www.cephb.fr/hgdp/index.php).
We considered the data of pathogen
rich-ness provided in Fumagalli et al.,
39which
represent the quantification of the number
of different pathogen species, detailed for
bacteria, protozoa, helminths, and viruses,
for the 21 countries where HGDP-CEPH
populations are distributed, as retrievable
from the Global Infectious Disease and
Epidemiology Network database (2002)
(http://gideononline.com).
We derived data concerning prevalence of
resistance to
fluoroquinolones and
third-generation cephalosporins in Gram-negative
urinary pathogens from Zowawi et al.
48Where more than one study for a given
coun-try was available, we calculated and used
the average prevalence. We could associate
prevalence indexes to 96 (fluoroquinolone
resistance) or 92 (cephalosporin resistance)
populations of the 156 for which we extracted
allelic frequencies of the rs4293393 UMOD
variant (Supplemental Table 2). The complete
list of population and antibiotic-resistant
UTI prevalence is reported in Supplemental
Table 4.
Correlations between allelic frequencies
of the candidate SNP and pathogen richness
or UTI prevalence were computed by the
Kendall rank correlation coefficient, a
non-parametric statistic, implemented in Matlab
R2014a. Since both pathogen diversity and
UTI prevalence data were available as
coun-try (political unit)-based values, we did not
apply a correction for spatial autocorrelation
and we relied on the simplest index of
association available, as previously done in
similar studies.
41,77Urinary Uromodulin Levels and
Markers of UTIs in the General
Population
Recruitment
The CoLaus study aims to identify new
molecular determinants of cardiovascular
risk in the white population from the city
of Lausanne (Switzerland). The study was
approved by the Institutional Ethics
Com-mittee of the University of Lausanne and all
participants provided written informed
consent. The sampling procedure has been
previously described.
78Briefly, a simple,
nonstratified random sample of the overall
population of Lausanne, aged 35–75 years,
was drawn. Recruitment for baseline
exami-nation began in June 2003 and ended in
May 2006. The participation rate was 41%.
All participants (N=5447) were seen in the
morning after a minimum fasting time of
8 hours.
Data Collection
A standardized questionnaire was used to
assess lifestyle, including alcohol and
smok-ing habits. Participants were classified as
either current smokers or nonsmokers. For
the purpose of the present analysis, regular
alcohol consumption was considered as
pre-sent whenever participants reported to drink
at least one unit of alcohol per day. Body mass
was estimated as weight divided by height in
meters squared, as previously described.
78Venous blood samples (50 ml) were drawn
in the fasting state. Ultrasensitive CRP was
assessed by immunoassay and latex HS
(IMMULITE 1000–High, Diagnostic
Prod-ucts Corporation, Los Angeles, CA) with
maximum intra- and interbatch coefficients
of variation of 1.3% and 4.6%, respectively.
Uromodulin was measured in morning spot
urine using a validated ELISA,
79with a
sen-sitivity of 2.8 ng ml
21, a linearity of 1.0, an
interassay variability of 3.3% and an
intra-assay variability of 5.5%. Urinary creatinine
levels (normalization) were measured using
the Synchron System Creatinine Assay
(Uni-cell DxC Synchron, Beckman Coulter, Inc.,
Brea, CA,), following the manufacturer’s
in-structions. In a subset of 2497 consecutive
participants, a urinary test strip was used to
determine the presence (versus absence) of
nitrite in spot urine using a Clinitek Atlas
analyzer (SIEMENS, Tarrytown, NY) and
the determination of leukocyte counts by
automatic counting.
Statistical Analyses
We conducted multiple logistic regression to
explore the association between presence of
urinary nitrites and square-root-transformed
urinary uromodulin concentration, while
in-cluding age, sex, and square-root-transformed
urinary creatinine concentration as covariates
in the model. We used a median test to compare
urinary leukocytes, or uromodulin-to-creatinine
levels, between men and women and a
non-parametric test for trend to compare
uromo-dulin-to-creatinine levels across sex-specific
tertiles of urine leukocytes. We explored the
association of log-transformed ultrasensitive
CRP with quintiles of urinary
uromodulin-to-creatinine ratio or with the rs12917707
using multiple Tobit regression to account
for the left-censored dependent variable. We
generated quintiles of urinary
uromodulin-to-creatinine ratio separately in men and
pre-menopausal and postpre-menopausal women.
Fully adjusted models included age, body
mass index, smoking, alcohol consumption,
eGFR Chronic Kidney Disease Epidemiology
Collaboration (CKD-EPI), HDL-cholesterol,
log-triglyceride, lipid-lowering drug, type 2
di-abetes, and hypertension as covariates. We
used a likelihood ratio test, including four
dummy variables, to test the effect of all
quin-tiles. Using separate models, we included a
cat-egorical variable coded from 1 to 5 to generate a
single P value for linear trend across quintiles.
ACKNOWLEDGMENTS
The authors acknowledge Denise Darman
(University of Ferrara, Italy), Nadine Nägele,
and Sonia Youhanna (University of Zurich,
Switzerland) for technical help, and Lorena
Madrigal (University of South Florida), Ozren
Polasek (University of Split, Croatia), Catharina
Svanborg (University of Lund, Sweden),
and Gérard Waeber (Centre Hospitalier
Table 4. Multiple logistic regression for factors associated with the presence of
urinary nitrites in the CoLaus study
Parameter (N=2497) Odds Ratio 95% Confidence Interval P Value
Age (yr) 1.04 1.02 to 1.08 0.001
Sex (1= women, 0= men) 4.01 2.02 to 7.98 ,0.001
Square-root urinary creatinine (mg/dl) 1.19 1.08 to 1.30 ,0.001 Square-root urinary uromodulin (mg/ml) 0.74 0.60 to 0.90 0.002
Universitaire Vaudois, Lausanne, Switzerland)
for helpful discussions. They also wish to
acknowledge the constructive remarks of
the reviewers that contributed to extend and
strengthen the original
findings.
This work was supported by the Fonds
National de la Recherche Scientifique and the
Fonds de la Recherche Scientifique Médicale
(Brussels, Belgium), the European
Commun-ity’s Seventh Framework Programme (FP7/
2007-2013) under grant agreement no. 305608
(EURenOmics), the Gebert-Rüef Foundation,
the Swiss National Science Foundation project
grant 310030_146490 and NCCR Kidney.CH
Program (to O.D.), Telethon-Italy (TCR08006,
GGP14263) and the Italian Ministry of
Health (grant RF-2010-2319394) (to L.R.),
the European Research Council
(ERC-2011-AdvG_295733 grant, LanGeLin) (to G.B. and
S.G.), the Italian Ministry for Research and
Universities (grant no. PRIN 2010-2011) (to
G.B.), and The European Union Project
ShockOmics (grant agreement no. 602706,
to L.P.). The CoLaus study was supported
by research grants from GlaxoSmithKline, the
Faculty of Biology and Medicine, University
Hospital Center of Lausanne, Switzerland
and the Swiss National Science Foundation
(grants 33CSCO-122661, 33CS30-139468, and
33CS30-148401).
Part of the results detailed in this
manu-script were presented as an oral
communi-cation at the 2014 Annual Meeting of the
American Society of Nephrology, November
11–16, 2014, in Philadelphia, PA.
The funders had no role in study design,
data collection and analysis, decision to publish,
or preparation of the manuscript.
DISCLOSURES
None.REFERENCES
1. Rampoldi L, Scolari F, Amoroso A, Ghiggeri G, Devuyst O: The rediscovery of uromodulin (Tamm-Horsfall protein): from tubulointer-stitial nephropathy to chronic kidney disease. Kidney Int 80: 338–347, 2011
2. Tamm I, Horsfall FL Jr: Characterization and separation of an inhibitor of viral hemagglu-tination present in urine. Proc Soc Exp Biol Med 74: 106–108, 1950
3. Mutig K, Kahl T, Saritas T, Godes M, Persson P, Bates J, Raffi H, Rampoldi L, Uchida S, Hille
C, Dosche C, Kumar S, Castañeda-Bueno M, Gamba G, Bachmann S: Activation of the bumetanide-sensitive Na+,K+,2Cl- cotransporter (NKCC2) is facilitated by Tamm-Horsfall protein in a chloride-sensitive manner. J Biol Chem 286: 30200–30210, 2011
4. Renigunta A, Renigunta V, Saritas T, Decher N, Mutig K, Waldegger S: Tamm-Horsfall glycoprotein interacts with renal outer medul-lary potassium channel ROMK2 and regulates its function. J Biol Chem 286: 2224–2235, 2011 5. Bates JM, Raffi HM, Prasadan K, Mascarenhas R, Laszik Z, Maeda N, Hultgren SJ, Kumar S: Tamm-Horsfall protein knockout mice are more prone to urinary tract infection: rapid communication. Kidney Int 65: 791–797, 2004
6. Anders H-J, Schaefer L: Beyond tissue injury-damage-associated molecular patterns, toll-like receptors, and inflammasomes also drive regeneration andfibrosis. J Am Soc Nephrol 25: 1387–1400, 2014
7. Hart TC, Gorry MC, Hart PS, Woodard AS, Shihabi Z, Sandhu J, Shirts B, Xu L, Zhu H, Barmada MM, Bleyer AJ: Mutations of the UMOD gene are responsible for medullary cystic kidney disease 2 and familial juvenile hyperuricaemic nephropathy. J Med Genet 39: 882–892, 2002
8. Eckardt K-U, Alper SL, Antignac C, Bleyer AJ, Chauveau D, Dahan K, Deltas C, Hosking A, Kmoch S, Rampoldi L, Wiesener M, Wolf MT, Devuyst O: Autosomal dominant tubulointer-stitial kidney disease: diagnosis, classification, and management–A KDIGO consensus report. Kidney Int 88: 676–683, 2015
9. Dahan K, Devuyst O, Smaers M, Vertommen D, Loute G, Poux J-M, Viron B, Jacquot C, Gagnadoux M-F, Chauveau D, Büchler M, Cochat P, Cosyns J-P, Mougenot B, Rider MH, Antignac C, Verellen-Dumoulin C, Pirson Y: A cluster of mutations in the UMOD gene causes familial juvenile hyperuricemic nephropathy with abnormal expression of ur-omodulin. J Am Soc Nephrol 14: 2883–2893, 2003
10. Rampoldi L, Caridi G, Santon D, Boaretto F, Bernascone I, Lamorte G, Tardanico R, Dagnino M, Colussi G, Scolari F, Ghiggeri GM, Amoroso A, Casari G: Allelism of MCKD, FJHN and GCKD caused by impairment of uromodulin export dynamics. Hum Mol Genet 12: 3369–3384, 2003
11. Bernascone I, Janas S, Ikehata M, Trudu M, Corbelli A, Schaeffer C, Rastaldi MP, Devuyst O, Rampoldi L: A transgenic mouse model for uromodulin-associated kidney diseases shows specific tubulo-interstitial damage, urinary concentrating defect and renal failure. Hum Mol Genet 19: 2998–3010, 2010
12. Köttgen A, Glazer NL, Dehghan A, Hwang S-J, Katz R, Li M, Yang Q, Gudnason V, Launer LJ, Harris TB, Smith AV, Arking DE, Astor BC, Boerwinkle E, Ehret GB, Ruczinski I, Scharpf RB, Chen Y-DI, de Boer IH, Haritunians T,
Lumley T, Sarnak M, Siscovick D, Benjamin EJ, Levy D, Upadhyay A, Aulchenko YS, Hofman A, Rivadeneira F, Uitterlinden AG, van Duijn CM, Chasman DI, Paré G, Ridker PM, Kao WHL, Witteman JC, Coresh J, Shlipak MG, Fox CS: Multiple loci associated with indices of renal function and chronic kidney disease. Nat Genet 41: 712–717, 2009
13. Köttgen A, Pattaro C, Böger CA, Fuchsberger C, Olden M, Glazer NL, Parsa A, Gao X, Yang Q, Smith AV, O’Connell JR, Li M, Schmidt H, Tanaka T, Isaacs A, Ketkar S, Hwang S-J, Johnson AD, Dehghan A, Teumer A, Paré G, Atkinson EJ, Zeller T, Lohman K, Cornelis MC, Probst-Hensch NM, Kronenberg F, Tönjes A, Hayward C, Aspelund T, Eiriksdottir G, Launer LJ, Harris TB, Rampersaud E, Mitchell BD, Arking DE, Boerwinkle E, Struchalin M, Cavalieri M, Singleton A, Giallauria F, Metter J, de Boer IH, Haritunians T, Lumley T, Siscovick D, Psaty BM, Zillikens MC, Oostra BA, Feitosa M, Province M, de Andrade M, Turner ST, Schillert A, Ziegler A, Wild PS, Schnabel RB, Wilde S, Munzel TF, Leak TS, Illig T, Klopp N, Meisinger C, Wichmann H-E, Koenig W, Zgaga L, Zemunik T, Kolcic I, Minelli C, Hu FB, Johansson A, Igl W, Zaboli G, Wild SH, Wright AF, Campbell H, Ellinghaus D, Schreiber S, Aulchenko YS, Felix JF, Rivadeneira F, Uitterlinden AG, Hofman A, Imboden M, Nitsch D, Brandstätter A, Kollerits B, Kedenko L, Mägi R, Stumvoll M, Kovacs P, Boban M, Campbell S, Endlich K, Völzke H, Kroemer HK, Nauck M, Völker U, Polasek O, Vitart V, Badola S, Parker AN, Ridker PM, Kardia SLR, Blankenberg S, Liu Y, Curhan GC, Franke A, Rochat T, Paulweber B, Prokopenko I, Wang W, Gudnason V, Shuldiner AR, Coresh J, Schmidt R, Ferrucci L, Shlipak MG, van Duijn CM, Borecki I, Krämer BK, Rudan I, Gyllensten U, Wilson JF, Witteman JC, Pramstaller PP, Rettig R, Hastie N, Chasman DI, Kao WH, Heid IM, Fox CS: New loci associated with kidney function and chronic kidney disease. Nat Genet 42: 376–384, 2010
14. Pattaro C, Köttgen A, Teumer A, Garnaas M, Böger CA, Fuchsberger C, Olden M, Chen M-H, Tin A, Taliun D, Li M, Gao X, Gorski M, Yang Q, Hundertmark C, Foster MC, O’Seaghdha CM, Glazer N, Isaacs A, Liu C-T, Smith AV, O’Connell JR, Struchalin M, Tanaka T, Li G, Johnson AD, Gierman HJ, Feitosa M, Hwang S-J, Atkinson EJ, Lohman K, Cornelis MC, Johansson Å, Tönjes A, Dehghan A, Chouraki V, Holliday EG, Sorice R, Kutalik Z, Lehtimäki T, Esko T, Deshmukh H, Ulivi S, Chu AY, Murgia F, Trompet S, Imboden M, Kollerits B, Pistis G, Harris TB, Launer LJ, Aspelund T, Eiriksdottir G, Mitchell BD, Boerwinkle E, Schmidt H, Cavalieri M, Rao M, Hu FB, Demirkan A, Oostra BA, de Andrade M, Turner ST, Ding J, Andrews JS, Freedman BI, Koenig W, Illig T,
Döring A, Wichmann HE, Kolcic I, Zemunik T, Boban M, Minelli C, Wheeler HE, Igl W, Zaboli G, Wild SH, Wright AF, Campbell H, Ellinghaus D, Nöthlings U, Jacobs G, Biffar R, Endlich K, Ernst F, Homuth G, Kroemer HK, Nauck M, Stracke S, Völker U, Völzke H, Kovacs P, Stumvoll M, Mägi R, Hofman A, Uitterlinden AG, Rivadeneira F, Aulchenko YS, Polasek O, Hastie N, Vitart V, Helmer C, Wang JJ, Ruggiero D, Bergmann S, Kähönen M, Viikari J, Nikopensius T, Province M, Ketkar S, Colhoun H, Doney A, Robino A, Giulianini F, Krämer BK, Portas L, Ford I, Buckley BM, Adam M, Thun GA, Paulweber B, Haun M, Sala C, Metzger M, Mitchell P, Ciullo M, Kim SK, Vollenweider P, Raitakari O, Metspalu A, Palmer C, Gasparini P, Pirastu M, Jukema JW, Probst-Hensch NM, Kronenberg F, Toniolo D, Gudnason V, Shuldiner AR, Coresh J, Schmidt R, Ferrucci L, Siscovick DS, van Duijn CM, Borecki I, Kardia SL, Liu Y, Curhan GC, Rudan I, Gyllensten U, Wilson JF, Franke A, Pramstaller PP, Rettig R, Prokopenko I, Witteman JC, Hayward C, Ridker P, Parsa A, Bochud M, Heid IM, Goessling W, Chasman DI, Kao WH, Fox CS; CARDIoGRAM Consortium; ICBP Con-sortium; CARe ConCon-sortium; Wellcome Trust Case Control Consortium 2 (WTCCC2): Genome-wide association and functional follow-up reveals new loci for kidney function. PLoS Genet 8: e1002584, 2012
15. Köttgen A, Yang Q, Shimmin LC, Tin A, Schaeffer C, Coresh J, Liu X, Rampoldi L, Hwang S-J, Boerwinkle E, Hixson JE, Kao WHL, Fox CS: Association of estimated glo-merularfiltration rate and urinary uromodulin concentrations with rare variants identified by UMOD gene region sequencing. PLoS One 7: e38311, 2012
16. Olden M, Corre T, Hayward C, Toniolo D, Ulivi S, Gasparini P, Pistis G, Hwang S-J, Bergmann S, Campbell H, Cocca M, Gandin I, Girotto G, Glaudemans B, Hastie ND, Loffing J, Polasek O, Rampoldi L, Rudan I, Sala C, Traglia M, Vollenweider P, Vuckovic D, Youhanna S, Weber J, Wright AF, Kutalik Z, Bochud M, Fox CS, Devuyst O: Common variants in UMOD associate with urinary uromodulin levels: a meta-analysis. J Am Soc Nephrol 25: 1869–1882, 2014
17. Padmanabhan S, Melander O, Johnson T, Di Blasio AM, Lee WK, Gentilini D, Hastie CE, Menni C, Monti MC, Delles C, Laing S, Corso B, Navis G, Kwakernaak AJ, van der Harst P, Bochud M, Maillard M, Burnier M, Hedner T, Kjeldsen S, Wahlstrand B, Sjögren M, Fava C, Montagnana M, Danese E, Torffvit O, Hedblad B, Snieder H, Connell JMC, Brown M, Samani NJ, Farrall M, Cesana G, Mancia G, Signorini S, Grassi G, Eyheramendy S, Wichmann HE, Laan M, Strachan DP, Sever P, Shields DC, Stanton A, Vollenweider P, Teumer A, Völzke H, Rettig R, Newton-Cheh C, Arora P, Zhang F, Soranzo N, Spector TD, Lucas G, Kathiresan S, Siscovick DS, Luan J,
Loos RJF, Wareham NJ, Penninx BW, Nolte IM, McBride M, Miller WH, Nicklin SA, Baker AH, Graham D, McDonald RA, Pell JP, Sattar N, Welsh P, Munroe P, Caulfield MJ, Zanchetti A, Dominiczak AF; Global BPgen Consortium: Genome-wide association study of blood pressure extremes identifies variant near UMOD associated with hypertension. PLoS Genet 6: e1001177, 2010
18. Gudbjartsson DF, Holm H, Indridason OS, Thorleifsson G, Edvardsson V, Sulem P, de Vegt F, d’Ancona FCH, den Heijer M, Wetzels JFM, Franzson L, Rafnar T, Kristjansson K, Bjornsdottir US, Eyjolfsson GI, Kiemeney LA, Kong A, Palsson R, Thorsteinsdottir U, Stefansson K: Associa-tion of variants at UMOD with chronic kid-ney disease and kidkid-ney stones-role of age and comorbid diseases. PLoS Genet 6: e1001039, 2010
19. Trudu M, Janas S, Lanzani C, Debaix H, Schaeffer C, Ikehata M, Citterio L, Demaretz S, Trevisani F, Ristagno G, Glaudemans B, Laghmani K, Dell’Antonio G, Loffing J, Rastaldi MP, Manunta P, Devuyst O, Rampoldi L; Swiss Kidney Project on Genes in Hypertension (SKIPOGH) team: Common noncoding UMOD gene variants induce salt-sensitive hypertension and kidney damage by increasing uromodulin expression. Nat Med 19: 1655–1660, 2013
20. Manolio TA, Collins FS, Cox NJ, Goldstein DB, Hindorff LA, Hunter DJ, McCarthy MI, Ramos EM, Cardon LR, Chakravarti A, Cho JH, Guttmacher AE, Kong A, Kruglyak L, Mardis E, Rotimi CN, Slatkin M, Valle D, Whittemore AS, Boehnke M, Clark AG, Eichler EE, Gibson G, Haines JL, Mackay TFC, McCarroll SA, Visscher PM: Finding the missing heritability of complex diseases. Nature 461: 747–753, 2009
21. Prado-Martinez J, Sudmant PH, Kidd JM, Li H, Kelley JL, Lorente-Galdos B, Veeramah KR, Woerner AE, O’Connor TD, Santpere G, Cagan A, Theunert C, Casals F, Laayouni H, Munch K, Hobolth A, Halager AE, Malig M, Hernandez-Rodriguez J, Hernando-Herraez I, Prüfer K, Pybus M, Johnstone L, Lachmann M, Alkan C, Twigg D, Petit N, Baker C, Hormozdiari F, Fernandez-Callejo M, Dabad M, Wilson ML, Stevison L, Camprubí C, Carvalho T, Ruiz-Herrera A, Vives L, Mele M, Abello T, Kondova I, Bontrop RE, Pusey A, Lankester F, Kiyang JA, Bergl RA, Lonsdorf E, Myers S, Ventura M, Gagneux P, Comas D, Siegismund H, Blanc J, Agueda-Calpena L, Gut M, Fulton L, Tishkoff SA, Mullikin JC, Wilson RK, Gut IG, Gonder MK, Ryder OA, Hahn BH, Navarro A, Akey JM, Bertranpetit J, Reich D, Mailund T, Schierup MH, Hvilsom C, Andrés AM, Wall JD, Bustamante CD, Hammer MF, Eichler EE, Marques-Bonet T: Great ape genetic diversity and population history. Nature 499: 471–475, 2013 22. Meyer M, Kircher M, Gansauge M-T, Li H,
Racimo F, Mallick S, Schraiber JG, Jay F,
Prüfer K, de Filippo C, Sudmant PH, Alkan C, Fu Q, Do R, Rohland N, Tandon A, Siebauer M, Green RE, Bryc K, Briggs AW, Stenzel U, Dabney J, Shendure J, Kitzman J, Hammer MF, Shunkov MV, Derevianko AP, Patterson N, Andrés AM, Eichler EE, Slatkin M, Reich D, Kelso J, Pääbo S: A high-coverage genome sequence from an archaic Denisovan indi-vidual. Science 338: 222–226, 2012 23. Prüfer K, Racimo F, Patterson N, Jay F,
Sankararaman S, Sawyer S, Heinze A, Renaud G, Sudmant PH, de Filippo C, Li H, Mallick S, Dannemann M, Fu Q, Kircher M, Kuhlwilm M, Lachmann M, Meyer M, Ongyerth M, Siebauer M, Theunert C, Tandon A, Moorjani P, Pickrell J, Mullikin JC, Vohr SH, Green RE, Hellmann I, Johnson PLF, Blanche H, Cann H, Kitzman JO, Shendure J, Eichler EE, Lein ES, Bakken TE, Golovanova LV, Doronichev VB, Shunkov MV, Derevianko AP, Viola B, Slatkin M, Reich D, Kelso J, Pääbo S: The complete genome sequence of a Neanderthal from the Altai Mountains. Nature 505: 43–49, 2014 24. Reich D, Green RE, Kircher M, Krause J,
Patterson N, Durand EY, Viola B, Briggs AW, Stenzel U, Johnson PLF, Maricic T, Good JM, Marques-Bonet T, Alkan C, Fu Q, Mallick S, Li H, Meyer M, Eichler EE, Stoneking M, Richards M, Talamo S, Shunkov MV, Derevianko AP, Hublin J-J, Kelso J, Slatkin M, Pääbo S: Genetic history of an archaic homi-nin group from Denisova Cave in Siberia. Nature 468: 1053–1060, 2010
25. Di Rienzo A, Hudson RR: An evolutionary framework for common diseases: the ances-tral-susceptibility model. Trends Genet 21: 596–601, 2005
26. Tassi F, Ghirotto S, Mezzavilla M, Vilaça ST, De Santi L, Barbujani G: Early modern human dispersal from Africa: genomic evidence for multiple waves of migration. Investig Genet 6: 13, 2015
27. Thompson EE, Kuttab-Boulos H, Witonsky D, Yang L, Roe BA, Di Rienzo A: CYP3A variation and the evolution of salt-sensitivity variants. Am J Hum Genet 75: 1059–1069, 2004 28. Wu S-J, Chiang F-T, Chen WJ, Liu P-H,
HsuK-L, Hwang J-J, Lai L-P, Lin J-L, Tseng C-D, Tseng Y-Z: Three single-nucleotide polymorphisms of the angiotensinogen gene and susceptibility to hypertension: single lo-cus genotype vs. haplotype analysis. Physiol Genomics 17: 79–86, 2004
29. Nakajima T, Wooding S, Sakagami T, Emi M, Tokunaga K, Tamiya G, Ishigami T, Umemura S, Munkhbat B, Jin F, Guan-Jun J, Hayasaka I, Ishida T, Saitou N, Pavelka K, Lalouel J-M, Jorde LB, Inoue I: Natural selection and population history in the human angiotensi-nogen gene (AGT): 736 complete AGT se-quences in chromosomes from around the world. Am J Hum Genet 74: 898–916, 2004 30. Givens RC, Lin YS, Dowling ALS, Thummel
KE, Lamba JK, Schuetz EG, Stewart PW, Watkins PB: CYP3A5 genotype predicts renal CYP3A activity and blood pressure in healthy