Dipartimento di Matematica e Informatica
Dottorato di ricerca in Informatica
KNOWLEDGE BASES AND STOCHASTIC
ALGORITHMS FOR MINING BIOLOGICAL DATA:
APPLICATIONS ON A-TO-I RNA EDITING AND RNAi
GIOVANNI NIGITA
A dissertation submitted to the Department of Mathematics and Computer Science and the committee on graduate studies of University of Catania, in fulfillment of the
requirements for the degree of Doctorate in Computer Science.
ADVISOR Prof. Alfredo Pulvirenti
dissertation for the degree of Doctor of Philosophy.
(Prof. Alfredo Pulvirenti) Advisor
I certify that I have read this dissertation and that, in my opinion, it is fully adequate in scope and quality as a dissertation for the degree of Doctor of Philosophy.
(Prof. Vincenzo Cutello) Director of Graduate Studies
Approved for the University Committee on Graduate Studies.
“The Lord has done great things for us, and we are filled with joy.”
Psalm 126:3. New International Version (NIV).
Contents v
List of Figures xi
List of Tables xv
List of Algorithms xvi
Abstract xviii
Preface xx
I
Introduction
1
1 Bioinformatics and the new era of DNA Sequencing 2
1.1 History of the Bioinformatics . . . 3
1.2 Public Biological Databases . . . 7
1.2.1 Genes . . . 9
1.2.2 Sequences and protein structures . . . 10 v
1.2.3 Vocabulary of the genes . . . 11 1.2.4 Genomes . . . 12 1.2.5 Gene expression . . . 12 1.3 Comparison of Sequences . . . 13 1.3.1 Statistical significance . . . 15 1.3.2 Functional Motifs . . . 16 1.4 Data Mining . . . 17
1.4.1 The data mining process . . . 18
1.4.2 Supervisioned Vs. Non-Supervisioned learning . . . 19
1.4.3 Cluster Analysis. . . 20
1.4.4 Hidden Markov models . . . 22
1.4.5 Networks . . . 23
1.4.6 The regulatory sequences of the genes. . . 24
1.4.7 Prediction of functional binding sites . . . 25
1.4.8 The model of networks . . . 27
1.4.9 Where you can find the algorithms? . . . 29
1.5 New era of DNA sequencing . . . 30
1.5.1 Basic Methods . . . 31
1.5.2 Second generation HT-NGS . . . 33
1.5.3 Third generation HT-NGS . . . 36
1.5.4 Application of sequencing technologies on human genome research . . . 38
1.5.5 Alignment tools . . . 39
2.1 What is Biostatistics? . . . 41
2.2 Steps to get to reliable results . . . 42
2.3 Application fields . . . 43
2.4 Deterministic and Stochastic models . . . 44
2.5 Markov models . . . 45
2.6 Markov chains . . . 46
2.7 Hidden Markov models . . . 49
2.7.1 Formalization of Hidden Markov models . . . 50
2.7.2 The forward algorithm . . . 51
2.7.3 The backward algorithm . . . 58
2.7.4 The Viterbi algorithm . . . 62
2.7.5 The Baum-Welch algorithm . . . 67
2.8 The Dirichlet distribution . . . 77
2.8.1 Mixtures of Dirichlets. . . 78
2.9 Estimators for estimation problems in discrete high-dimensional spaces . . . 79
2.10 Centroid Estimation . . . 80
2.11 Gamma Centroid Estimator . . . 83
2.11.1 Evaluation measures defined using TP, TN, FP and FN 84 2.11.2 Formalization of γ-centroid estimators . . . 85
3 MicroRNA Biogenesis and RNA Editing Phenomenon 88 3.1 microRNA Biogenesis . . . 88
3.1.1 Organization of microRNA in Human Genome . . . 90
3.1.3 Post-Transcriptional Regulation Mediated by
microR-NAs . . . 94
3.1.4 Regulation of microRNA Expression . . . 95
3.1.5 Bioinformatics Prediction of microRNAs’ Molecular Tar-gets . . . 97
3.1.6 Circulating microRNAs. . . 99
3.2 RNA Editing Phenomenon . . . 100
3.2.1 The birth of RNA Editing . . . 100
3.2.2 RNA Editing in Different Organismis . . . 102
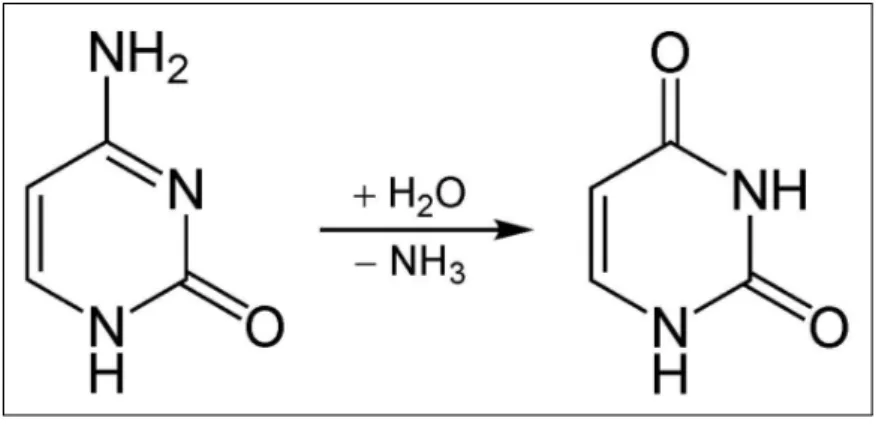
3.2.3 Editing by Deamination . . . 103
3.2.4 A-to-I RNA editing analysis . . . 111
II
Biological Databases
117
4 Biological databases and their analysis: miRandola, miR-EdiTar and VIRGO 118 4.1 miRandola: Extracellular Circulating MicroRNAs Database . 120 4.1.1 Mirandola BackEnd. . . 1214.1.2 Sections of Mirandola . . . 123
4.1.3 miRandola - miRò . . . 129
4.2 miR-EdiTar: A database of predicted A-to-I edited miRNA target sites. . . 134
4.2.1 The construction of miR-EdiTar . . . 134
4.2.2 miR-EdiTar contents . . . 136
4.2.4 Utility and discussion. . . 138
4.3 VIRGO: Visualization of A-to-I RNA editing sites in genomic sequences . . . 142
4.3.1 Datases of RNA Editing sites . . . 142
4.3.2 The creation of VIRGO . . . 144
4.3.3 Construction and content . . . 145
4.3.4 Utility and discussion. . . 153
III
HMMs and their Application to miRNA
Target-ing
157
5 Profile HMM for microRNA Target and Design 158 5.1 Introduction to profile HMM for microRNA target . . . 1585.2 Forward and Backward Algorithms . . . 161
5.2.1 Forward Algorthm . . . 161 5.2.2 Backward Algorithm . . . 164 5.2.3 LogSum Trick . . . 165 5.3 Baum-Welch . . . 165 5.4 Gamma-Centroid Decoding . . . 169 5.4.1 microRNA Design. . . 170
5.5 Stochastic backtrace procedure . . . 170
IV
Motif Discovery in RNA Editing Phenomenon
177
6 Searching for motifs in RNA Editing 178
6.1 Description of the methodology . . . 179
6.1.1 Preparation of the dataset . . . 179
6.1.2 Searching for motifs in edited sequences . . . 180
6.2 Preliminary results . . . 181
V
Conclusions
188
7 Conclusions 189
1.1 Molecular structure of the nucleotides . . . 4
1.2 Some databases associated with Entrez . . . 6
1.3 Scheme of the databases within GenomeNet . . . 8
1.4 Allen Brain Atlas 3-D Brain Explorer Application . . . 14
1.5 Electropherogram of a small portion of the DNA sequence . . 31
1.6 An example of the results of automated chain-termination DNA sequencing . . . 32
1.7 Advanced technological features of three leading second gen-eration HT-NGS platforms . . . 35
1.8 Advanced technological features of three leading third gener-ation HT-NGS platforms . . . 37
1.9 Alignment of the reads in the genomic reference . . . 39
2.1 A simple two-state Markov chain . . . 47
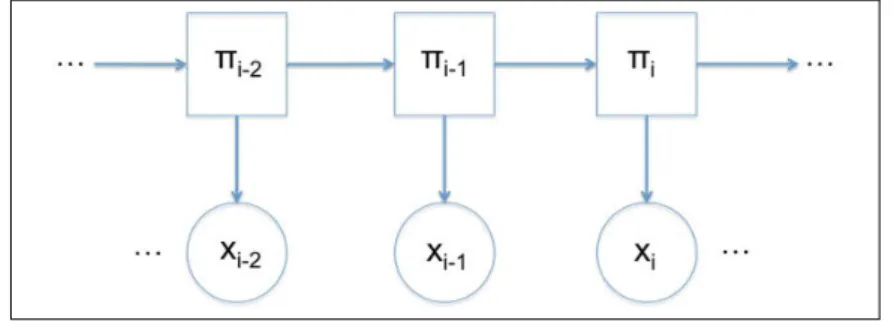
2.2 (HMM) Scheme of transition from the state πi−1 to the state πi 54 2.3 (HMM) Scheme of transition from the state πi to the state πi+2 58
2.4 (HMM) Scheme of transition from the state πi−2 to the state πi 63 2.5 A binary matrix representation of a secondary structure of an
RNA sequence . . . 80
2.6 Multidimensional scaled distribution derived from 1, 000 rep-resentative samples from Sfold . . . 83
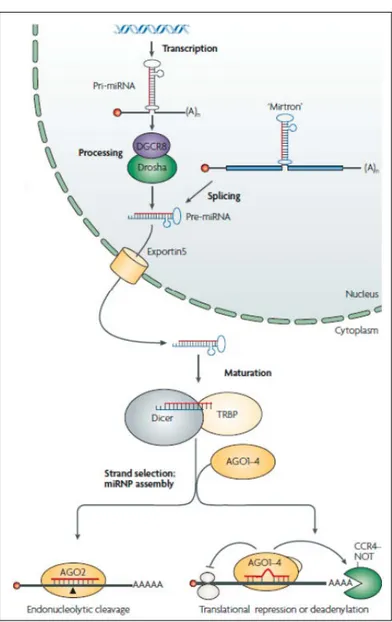
3.1 Model for biogenesis and activity of transcriptional repression of microRNAs . . . 92
3.2 Representation of some of the possible mechanisms of action of the RISC complex induced by miRNA . . . 95
3.3 Spontaneous oxidative deamination of cytosine . . . 104
3.4 Possible effects caused by RNA editing . . . 107
3.5 Example of C-to-U RNA editing in the Apo B gene of Human 107 3.6 Example of action of the ADAR in a double-strand region . . 108
3.7 Molecular structures of adenine and inosine . . . 109
3.8 Inosine behavior, similar to the Guanosine one . . . 109
3.9 Main effect of the A-to-I RNA editing. . . 110
3.10 Transition from adenosine to inosine . . . 112
3.11 Comparison of ADAR proteins. . . 113
3.12 Tertiary structure of the ADAR1 protein . . . 114
4.1 Tables of miRNAs in miRandola . . . 122
4.2 Tables of mirna_converter and submission . . . 123
4.3 Homepage of miRandola . . . 124
4.4 Search page in miRandola . . . 125
4.6 Advanced search page in miRandola . . . 127
4.7 Tools page in miRandola . . . 128
4.8 Link between miRandola and miRò . . . 130
4.9 Page of miRò relative to diseases of has-miR-21 . . . 130
4.10 Page of miRò relative to functions of has-miR-21 . . . 131
4.11 Page of miRò relative to processes of has-miR-21 . . . 132
4.12 Page of miRò relative to tissues of has-miR-21 . . . 133
4.13 Examples of predicted miRNA binding sites potentially af-fected by A-to-I editing (I) . . . 139
4.14 Examples of predicted miRNA binding sites potentially af-fected by A-to-I editing (II) . . . 139
4.15 Examples of predicted miRNA binding sites potentially af-fected by A-to-I editing (III) . . . 140
4.16 Examples of predicted miRNA binding sites potentially af-fected by A-to-I editing (IV) . . . 141
4.17 Examples of predicted miRNA binding sites potentially af-fected by A-to-I editing (V) . . . 143
4.18 Sequence of steps to identify putative A-to-I editing sites . . . 147
4.19 Clustering filter . . . 149
4.20 Fourth Step of VIRGO . . . 150
4.21 Example for the p-value computation . . . 152
4.22 VIRGO usage example . . . 154
4.23 Venn diagram concerning the number of editing sites in com-mon between VIRGO and DARNED . . . 155
5.1 Transition structure of the profile HMM for the microRNA targeting . . . 159
5.2 Comparison PicTar and Profile HMM for miRNA targeting (10 Baum-Welch iterations) . . . 175
5.3 Convergence of Baum-Welch algorithm . . . 176
6.1 Upstream and downstream regions of editing site . . . 180
6.2 Mapping of palindromic motifs on sample edited sequences . . 182
6.3 Mapping of non-palindromic motifs on sample edited sequences183
6.4 Example of mapping of non-palindromic motifs on positive strand of the chromosome 1 . . . 185
6.5 Example of mapping of non-palindromic motifs on the nega-tive strand of the chromosome 1 . . . 185
6.6 Example of mapping of palindromic motifs on the positive strand of the chromosome 1 . . . 186
1.1 Comparison of next-generation sequencing methods . . . 35
3.1 List of some of the most important predictors of miRNA targets 98
4.1 Overall Descriptive Statistics. . . 137
5.1 States of the profile HMM for MicroRNA targeting . . . 160
6.1 Examples of experimental validated editing sites in 5HT2C gene181 6.2 Number of region of 4, 000 nucleotides in each human
chromo-some . . . 184
1 Forward Algorithm . . . 57
2 Backward Algorithm . . . 61
3 Viterbi Algorithm: first part. . . 66
4 Viterbi Algorithm: final part. . . 67
5 Baum-Welch algorithm . . . 77
Until the second half of twenty century, the connection between Biology and Computer Science was not so strict and the data were usually collected on perishable materials such as paper and then stored up in filing cabinets.
This situation changed thanks to the Bioinformatics, a relatively novel field that aims to deal with biological problems by making use of computa-tional approaches. This interdisciplinary science has two particular fields of action: on the one hand, the construction of biological databases in order to store in a rational way the huge amount of data, and, on the other hand, the development and application of algorithms also approximate for extracting predicting patterns from such kind of data.
This thesis will present novel results on both of the above aspects. It will introduce three new database called miRandola, miReditar and VIRGO, respectively. All of them have been developed as open sources and equipped with user-friendly web interfaces.
Then some results concerning the application of stochastic approaches on microRNA targeting and RNA A-to-I interference will be introduced.
In this thesis, I will present the results of the research carried out during the three-years of the PhD program in Computer Science at University of Catania. My research has been focused mainly on algorithms and systems on Bioinformatics.
The thesis consists of four parts: Introduction, Biological Databases, HMMs and their Application to miRNA Targeting, and Motif Discovery in the A-to-I RNA Editing.
Part I: Introduction
The first section introduces the basic knowledge needed to deal with the research topics treated through the thesis.
The first chapter presents the basic concepts related to bioinformatics and gives an in depth survey on all the research field. We start by describing the wealth of biological data then we move to the construction of biological databases and last we highlight all the data mining approaches that have been developed and are needed to extract predictive patterns from this very rich source of knowledge.
In the second chapter we will sketch key concepts on Biostatistics giv-ing special emphasis on Hidden Markov Models. We describe the outcome of predicting algorithms as probability distribution looking always at the reliability of results measured in terms of biological soundness.Then I will introduce a new class of estimators called Centroid Estimators which are ca-pable to overcome the limits of Maximum Likelihood for high dimensional space problems.The so called γ-centroid estimators will be then introduces stressing their capability to tune the ratio between positive predicted values against sensitivity.
The last chapter, that concludes the first part dedicated to the theoretical introduction to various arguments, consists of two sub-session. In the first one, we will analyze the biogenesis of microRNA(miRNAs), a large class of small non-coding RNAs of about 21-25 nucleotides, that negatively regulate the gene expression. Next we will introduce the RNA editing phenomenon, the process in which the nucleotide sequence of RNA is altered from the genomic code. The editing is related to the insertion/deletion of nucleotides, or the base modification. Its peculiarity is that the result of RNA editing is a change in the diversity and/or abundance of proteins expressed in the proteomes of organisms.
Part II: Biological Databases
The second part of my thesis is focused on the presentation and analysis of biological databases that I have been developed in collaboration with few colleagues. As a results of my effort, I will show miRandola, miR-EdiTar,
and VIRGO.
I will introduce miRandola, a database of extracellular/circulating miRNA. The database provides the users with a variety of information including the associated diseases, the samples, the methods used to isolate the miRNAs, and the description of the experiment. The information about the targets of miRNAs and their records are provided through links to miRò, “the miRNA knowledge base”. miRò integrates data from different sources to allow the identification of associations among genes, processes, functions, and diseases through validated and predicted targets of miRNAs. MiRandola is the first database about circulating miRNAs, where all the data are collected and maintained up-to-date in a MySQL database.
The article, submitted on August 2012, was accepted on October of the same year and published on Plos one.
Then, I will present miR-EdiTar, a database of predicted A-to-I edited miRNA binding sites. The database contains predicted miRNA binding sites that could be affected by A-to-I editing and that could become miRNA bind-ing sites as a result of A-to-I editbind-ing. The importance of miR-EdiTar is that it contains a collection of predicted human miRNA binding sites in A-to-I edited 3’ UTR sequences. The ones contained in the database can be either “current” sites, when they are predicted to be miRNA binding sites but that might be affected by A-to-I editing, or “novel” sites, when they are not pre-dicted to be miRNA binding sites but they could become miRNA binding sites as a result of A-to-I editing. Furthermore, as in miRandola, miR-EdiTar is connected to miRò, a web environment that provides users with miRNA
functional annotations inferred through their validated and predicted targets. The article, submitted on July 2012, was accepted on September of the same year and published on Bioinformatics.
Finally, I will focus on VIRGO, a web-based tool that maps A-to-G mis-matches between genomic and EST sequences as candidate A-to-I editing sites. It is built on top of a knowledge-base integrating information of genes from UCSC, EST of NCBI, SNPs, DARNED, and Next Generations Sequenc-ing data. The tool is equipped with a user-friendly interface allowSequenc-ing users to analyze genomic sequences in order to identify candidate A-to-I editing sites. VIRGO is a powerful tool allowing a systematic identification of putative A-to-I editing sites in genomic sequences. The integration of NGS data allows the computation of p-values and adjusted p-values to measure the mapped editing sites confidence. The whole knowledge base is available for download and its central purpose is to provide users with a periodically updated sys-tem storing high quality candidate editing sites. This will allow people to quickly and easily identify whether their genomic sequences are subject to A-to-I RNA Editing or not.
The article related to VIRGO was published on April 2012, on the journal BMC Bioinformatics.
Part III: HMMs and their Application to miRNA
Targeting
In the fifth chapter, it is presented the application of profile HMMs to croRNA targeting. While the first applications of profile HMMs to the mi-croRNA targeting problem. We will introduce a conditioned profile HMM properly designed to deal with this problem.
I will describe the different components that characterize our profile HMM, starting from the formalization of both Forward and Backward al-gorithms, subsequently integrated in the Baum-Welch algorithm for the pa-rameter estimation. In this phase to guarantee the reliability of the results, the MiRecoord database has been used as training set. It contains experi-mental validated alignments between miRNAs and mRNAs. Finally, I will show the implementation of the decoding algorithm in order to find the most likely hidden states that determine the pairwise alignment between the two molecules. Few decoding approaches such as Viterbi, Stochastic Backtrace and γ-centroid will be introduced.
Part IV: Motif Discovery in RNA Editing
Phe-nomenon
Despite the enormous efforts made in the last two decades, the real biological function of the RNA editing as well as the features of the substrates of the ADAR still remain unknown. I will present a preliminary methodological
workflow for the identification of predicting RNA-Editing structural motifs. The aim is to discover potential sequence signals appearing only in genomic regions subject to editing. It is well-known that A-to-I editing in human often occurs in repetitive regions, which makes motif discovery very challenging. In order to eliminate contamination of the motif by the Alu consensus we focus in non-repetitive flanking regions of the editing sites that could distinguish the A-to-I RNA editing.
In order to ensure the trustworthiness of the results, experimental val-idated (EV ) editing sites have been collected by using the literature, and then divided into two categories: true-positive (TP) editing sites, and false-positive editing sites. For each edited gene containing EV editing sites, a sample of true-positive editing site has been selected. Among this sample set of editing sites, non-repetitive flanking regions, which consist of 2, 000 nucleotides downstream and upstream of sample editing site, were extracted. To discovery some motifs in the selected edited regions we used the well known MEME (Multiple EM for Motif Elicitation) suite to find both 50 palindromic and 50 non-palindromic motifs.
Introduction
Chapter
1
Bioinformatics and the new era of
DNA Sequencing
It is like a voyage of discovery into unknown lands, seeking not for new territory but for new knowledge. It should appeal to those with a good sense of adventure.
Frederick Sanger Nobel Price in Chemistry (1958,1980)
T
he word Bioinformatics comes from the juxtaposition of two words: “bios”, the Greek word for life, and “informatics”, the area of computer sci-ence. Thus, the main object of Bioinformatics is the management and the analysis of biomedical information through computers. Its main activitiesrelate to the construction and maintenance of a variety of databases; the development of algorithms for the alignment of sequences of DNA (deoxyri-bonucleic acid), RNA (ribonucleic acid) and proteins; the identification of genes and the assembling of genomes; the prediction of both, the structure and the interactions of nucleic acids and proteins; and, finally, the reconstruc-tion and analysis of biological networks. The part of Bioinformatics that has a particular focus on statistical/mathematical assessing and model building, rather than on information management, is also called Computational Biol-ogy.
Information management is perhaps the primary activity of Bioinformat-ics, and it is certainly the most widely used and appreciated by the scientific community. The aim is first of all to collect the biological information in databases, then write it down, connecting it to a variety of additional infor-mation, and eventually to develop the services needed to access and use the data. Usually, the data and the analysis softwares may be used freely, except for the commercial databases (its consultation has a cost), and some of those industrial ones (its access is restricted). The best way to become familiar with the bioinformatic world and easily explore the huge amount of biologi-cal data is to enter the bioinformatics’ portals, which host the databases and offer a variety of analytical tools and links to other sites.
1.1
History of the Bioinformatics
Bioinformatics was born in the late seventies, together with both the de-velopment of recombinant DNA technology and the publication of the first
sequences of nucleic acids. The DNA in a organism consists of very long se-quences from an alphabet of four letters that corrispond to the four possible nucleotides (see Figure 1.1): A for Adenine, G for Guanine, C for Cytosine, and T for Thymine.
Figure 1.1: Molecular structure of the nucleotides.
These sequences are copied from generation to generation, and undergo changes within any population over the course of many generations, so this is the reason why random mutations arise and become fixed in the popula-tion. Therefore, it was immediately clear that it was impossible to decode encrypted messages in the sequences of DNA, RNA or proteins, through the implementation of descriptive algorithms of biological rules without the help of the computer technology.
Considering that it is difficult to provide an exact date that marks the beginning of the era of Bioinformatics, it might be more useful to outline the important events, distinguishing them, in particular, into two main areas, biological databases and bio-computational methodologies. Regarding the first point, although currently the core is formed from the databanks of DNA and
RNA, the first biological database hailed from the times of Margaret Dayhoff, an American physical chemist. In 1966, on the basis of Pauling’s theories of molecular evolution, she made studies based on the analysis of protein sequences: the results were collected in an atlas on the basis of groups of homologous proteins [1]. In the seventies, it was modified into the electronic version of the database NBRF (National Biomedical Research Foundation). In the early eighties, the EMBL (European Molecular Biology Laboratory) in Heidelberg supported the construction of the EMBL datalibrary, a database of sequences of DNA and RNA [2]. The first release was in December 1981 and contained 519 entries relating to likewise nucleotide sequences, published and stored in an electronic document. In 1982, Walter Goad worked on the creation of a new database, from which it originated the GenBank, a storage similar to the European one, but produced in America [3]. In 1986 it was created the DDBJ , the Japanese database [4]. Later there was an international cooperation among EMBL datalibrary, GenBank and DDBJ.
It is clearly useful to have good systems for the selection and the mining of specific information collected in the biological databases. Among those systems, called retrieval systems, the most important are:
• The Entrez system, developed at the National Center for Biotechnol-ogy Information of the NIH (National Institutes of Health). In the Figure 1.21 there are the principal databases associated with Entrez:
• The SRS system, developed by Thure Etzold [5].
The cornerstones of bio-computational methodologies should be
associ-1Source:
Figure 1.2: Some databases associated with Entrez.
ated with procedures for the comperison of biosequences to search for regions of similarity. In 1970 Needleman and Wunsch published the algorithm to search for the best global alignment between two sequences [6], and in the meantime Gibbs and McIntyre published a method based on dot-plot matrix, that allowed to display regions of similarity more or less strict and that was also used in many comparative analysis algorithms [7]. In 1981 Waterman and Smith published the algorithm for finding the best local allignment be-tween the two sequences [8], while in 1983 Wilbur and Lipmann published an algorithm to search for the similarity inside the databases [9]. FASTA was published in 1985 [10] and BLAST in 1990 [11]. Simultaneously, numerous methods for the research of motifs and for the characterization of genomic sequences in protein coding regions were developed, such as, for example, the algorithms of Fickett and Gribskow [12, 13]. In the field of molecular
evo-lution, the publication in 1965 of Zuckerkandl and Pauling concerning the molecular clock hypothesis was a landmark [14]. This was followed by several studies by Dayhoff, the publication in 1966 [15] of the method of Maximum Parsimony analysis (then extended in 1977 by Walter Fitch [16] in the anal-ysis of nucleotide sequences), the publication of the methods of Jukes and Cantor in 1969 [17], and in 1980 the calculation of phylogenetic distances along with the methods for the construction of phylogenetic trees by Kimura [18]. As regards the methods for structural predictions, noteworthy are the method of Zuker for the prediction of DNA structures[19,20] and the method of Chou and Fasman for protein secondary structures [21, 22,23].
1.2
Public Biological Databases
The NCBI (National Center for Biotechnology Information) was created in 1988 in the United States by the National Library of Medicine (NLM of the NIH, and mantains the largest bioinformatics portal in the world2. Currently,
it hosts more than thirty databases (bibliographies, genomes, sequences of nucleotides and amino acids, protein structures, and so on), that can be easily consult with the text search engine Entrez.
Founded in 1992, the EBI (European Bioinformatics Institute) is the main European center for research and bioinformatics services and mantains nucleic acids databases, proteins, macromolecular structures and biological pathways3.
GenomeNet, created in 1991, is a Japanese network for data and
bio-2For more information visit the website: http://www.ncbi.nlm.nih.gov/.
computational services. It contains the portal KEGG (Kyoto Encyclopedia of Genes and Genomes which includes genes and proteins databases (KEGG genes), databases of chemical components (KEGG ligand), databases of molecular and biochemical reaction networks (KEGG pathway) [24]. In the Figure 1.3 is shown the scheme of the databases linked each other4:
Figure 1.3: Scheme of the databases within GenomeNet.
ExPASy (Expert Protein Analysis System) proteomics, created in 1993 in Switzerland, offers a variety of tools for the analysis of data on proteins [25]. There are sequence databases, domains and protein families, proteomic data, models of protein structures and metabolic pathways.
The main public biological databases in the field of genomes are: En-sembl, in Great Britain, created in 1999 by the EBI and WTSI (Wellcome Trust Sanger Institute) [26, 27], and UCSC Genome Browser, in the
United States, created in 2000 by the University of California, Santa Cruz [28].
The most important laboratories and scientific journals have developed their own portals, providing information on particular biological aspects and tools to explore them. For example, Genes to Cognition Online (G2C ), created in 2009 by Cold Spring Harbor Laboratory, is a neuroscience portal, focusing not only on cognitive processes, but also on their related diseases and research approaches. The Nature publishing group contains “Omics gateway” for biology on a genomic level, while The signaling gateway is focused on signal transduction. The journal Science has developed “Science signaling”, focused on regulation and cell signaling.
1.2.1
Genes
As seen before, GenBank was one of the first nucleotide sequence database. It contains the nucleotide sequences obtained from people who deposit them there. It is part of the consortium INSDC (International Nucleotide Se-quence Database Collaboration) along with the other two large databases: EMBL and DDBJ, where each archive contains over 100 million sequences.
In these databases the annotations are very limited, and there may be multiple entries for the same genes. If the genomic sequence encodes a pro-tein, at first, the conceptual translation, called coding sequence (CDS), is shown, then, it receives a place in the protein database of NCBI.
The database UniProt (Universal Protein resource), managed together by the EBI , the SIB (Swiss Institute of Bioinformatics [29] and the PIR
(Protein Information Resource) [30], contains these sequences in the TrEMBL section (Translated EMBL nucleotide sequence data library). The NCBI’s RefSeq database (Reference Sequence) is, instead, a collection of more re-stricted but also more accurate sequences. It chooses the best information available and sometimes its sequences are automatically imported from other databases. Moreover, RefSeq has about 10,000 organisms, while GenBank has sequences obtained by approximately 250,000 different organisms. When the authors publish new evidences, the TPA database (Third Party Anno-tation) gives them the possibility to annotate the sequences in the INSDC databeses (International Nucleotide Sequence Database Collaboration) [31].
The miRBase database (microRNA database) is the central storage for the genomic of microRNAs, small non- coding RNA sequences of about 21 nu-cleotides that has a central role in the genes regulation [32, 33]. MicroRNAs control the translation of numerous mRNAs (messenger RNAs) into proteins and have a prominent part in the differentiating and cell proliferation, in the plasticity of both the synapses of nervous system and various diseases, including cancer. miRBase hosts more than 30, 000 miRNAs sequences from 206 different species5, takes care their nomenclature and annotation, and
provides programs for the prediction of the target mRNAs.
1.2.2
Sequences and protein structures
UniProtKB (UniProt KnowledgeBase) [34], consisting of two sections called Swiss-Prot and TrEMBL, is the most complete information source on
se-5At the time of the writing of the Ph.D. thesis, the Release of miRBase is 20:
quences and protein functions. Swiss-Prot is manually curated and has a very specific annotated; TrEMBL is automatically curated and contains the conceptual translation of the nucleic acid sequences that are in the databases, with little modifications.
The sequences stay provisionally in TrEMBL, waiting for a manual anno-tation to be transferred to SwissProt. UniRef (UniProt Reference Clusters) gathers together those sequences which are strictly connected in a single doc-ument, to speed the researches up [35]. UniParc (UniProt archive) contains, instead, both the protein sequences and all the available data).
PDB (Protein Data Bank), run by RCSB (Research Collaboratory for Structural Bioinformatics), hosts the structures of proteins and other biolog-ical macromolecules, and provides also a variety of resources for the study of their sequences, functions, and their possible pathological effect [36].
1.2.3
Vocabulary of the genes
Biologists use a great variety of terms to refer to genes and proteins and this variability is a restriction for an effective searching. The project GO (Gene Ontology) is the answer to the need of an unvarying terminology [37, 38]. Gene Ontology has developed an ontology, available through a database, that assigns three attributes to the product of each gene:
a) the biological process in which it participates, such as signal trans-mission, pyrimidine metabolism, etc.;
b) the molecular function, as, for example, catalytic activity, binding capacity, binding to a receptor;
c) the cellular component, indicating its location inside the cell, such as endoplasmatic reticulum, nucleus, and ribosome.
A single gene product might have more than one molecular or biological function, and more than one location. The GO terminology facilitates the researches done by the various databases.
1.2.4
Genomes
The genomic data of individual organisms are annotated in various special-ized databases, reached through the Ensembl and UCSC Genome Browser portals. Since the research focuses on the analysis of genomes, the graphical presentation of the sequences is very important. The genomic portals devel-oped navigation tools, providing a quick view of any portion of genomes at any scale, with elaborate formatting options.
The aim of the ENCODE project (Encyclopedia of DNA Elements), launched in 2003, is to identify all the functional elements in the human genome sequence. It had an initial pilot phase, focused on a portion of the genome, and the results were published in June 20076; after this, the goal
was to compose the encyclopedia of the entire genome [39].
1.2.5
Gene expression
The huge amount of data obtained with the high-throughput technologies caused the need of databases that are able to retain them and make them accessible. In particular, the DNA microarray technology7(commonly known
6The ENCODE project consortium 2007:
https://genome.ucsc.edu/encode/.
as DNA chip or biochip)), or DNA GeneChips®8, was used to generate
thou-sands of global gene expression profiles, obtained by measuring the amount of mRNA of a large number of genes in various conditions.
GEO (Gene Expression Omnibus) at NCBI [40,41] and ArrayExpress at EBI [42] are the largest public deposits of such experiments. Both of them store the data in the standard format MIAME (Minimum Infor-mation About a Microarray Experiment) [43] and have exploration tools on line. They host not only many transcriptomics experiments, but also data about the microRNA expression, the genomic hybridization, SNP (Sin-gle Nucleotide Polymorphism), ChIP (chromatin immunoprecipitation) [44], and profiles of peptides.
The Allen Brain Atlas contains the three-dimensional map (see an exam-ple in Figure 1.4), on genomic scale, of the expression of thousands of genes in all the areas of the brain both of an adult human [45] and of an adult mouse and during its development, until the cellular level [46].
1.3
Comparison of Sequences
To get an idea of the possible meaning of new sequences, both nucleic acid or proteins, it might be very useful to compare them to other sequences with that have been already studied.
Aligning is the most effective method for comparing two sequences. This is done through algorithms that, first automatically analyze the correspon-dence between nucleotides or amino acids of different sequences, and then,
Figure 1.4: Allen Brain Atlas 3-D Brain Explorer Application.
tribute a score that reflects the degree of similarity. The softwares use graph-ical tools to view the alignments. These alignments can be global, if they include all the characters of each sequence (Needleman–Wunsch algorithm [6]), or local, if they include only the most similar regions (Smith–Waterman algorithm [8]).
The BLAST programs (Basic Local Alignment Search Tool), developed in 1990 at the NIH, are the most efficient tools for sequence comparison [11]. They offer a big variety of choices, depending on the type of sequence to examine, as also the purpose of the research and the database that queries. The BLAST programs, which highlight those regions of local alignment, di-vide both the sequence which queries the database (called “query sequence”) and the sequences contained in it in fragments called words; then, BLAST
starts searching for their matches. The initial search is made for a word of length W that has a score at least T9 compared to the query. The words that
are identified, called hits, are stretched in both directions, in an attempt to create an array with a score greater than a threshold value S.
1.3.1
Statistical significance
Considering that the databases contain a large quantity of sequences, there may be completely random cases of good similarity. By assigning to each alignment a statistical value, as the P-value or the E-value (Expectation value), it is possible to valuate how significative an alignment is. The pa-rameter P is a number between 0 and 1 that indicates the probability that the alignment between the query sequence and a particular sequence of the database is the result of the case. A P-value of 0, 05 indicates that there is a 5% chance that the alignment is meaningless. The E-value indicates the number of alignments having equal or better scores than the one observed, that might occur by chance.
Therefore, much smaller is P or E, the more significant is the alignment. P and E are related by E = P × S, where S here is the size of the database. Moreover, the P-value and E-value are not always enough to give a bi-ological meaning to an alignment, and it is often an appropriate critical evaluation criteria with common sense. The low complexity regions, such as those with repeated sequences are a frequent problem, because the similarity
9The parameter T determines the computational speed and the sensitivity of the search,
in particular more the parameter is high, then higher the similarity request, more research is fast, but increase the risk that you leave out similarity that are not strong, which may have biological significance.
based on that type of sequences is unreliable.
1.3.2
Functional Motifs
The main function of a database is to identify, among a huge number of sequences of genes and proteins, some characteristics that indicate a specific function. It was confirmed that genes or proteins that play a similar function have a similarity in some regions of their sequence. Thus, genes and proteins belonging to the same functional family should contain in their sequence a recurring motif that characterizes the family and distinguishes them from the others. One of the most useful things that can be obtained from the comparison of sequences is the identification of short areas that indicate a particular structure or function.
Thanks to their biological significance, these regions show high conserva-tion in their sequences. The presence of these “signatures” is extremely useful to assign a new sequence to a specific family of genes or proteins, to be able to make assumptions about its function. In the computer language such sig-natures are called motifs, and can be described as short text strings, called patterns, or as numeric arrays. The patterns are located in a small region of high homology, while the profiles also consider long sequences. Patterns and profiles can be found in databases as PROSITE [47] or JASPAR [48].
PROSITE is a database of proteins’ domains, families and functional sites, integrated with computer tools to identify sequence motifs . It con-tains specific signatures for more than 1, 500 families or protein domains and extensive documentation on their structure and function. It is possible
to quickly identify to which known protein family a given protein sequence belongs to, thanks to those sequence motifs, which represent transcription factors of DNA binding preferential sites, taken from the scientific literature. The database JASPAR deals with the promoters, the DNA sequences regulating the expression of genes . They are located immediately before the gene transcription’s starting point and tie a variety of regulatory proteins, called transcription factors. The particular combination of factors related to the promoter determines whether the gene will be turned on, or off. JASPAR 174 contains sequence motifs, which represent transcription factors of DNA binding preferential sites, taken from the scientific literature. They can be used for scanning genomic sequences.
1.4
Data Mining
The data represents a resource of great intrinsic wealth, todata only partially exploited. Technological progress has made the digitalization and storage of huge amounts of heterogeneous data possible. This exponential growth has given rise systems able to analyze in a semi-automatic way these data in order to classify, synthesize, extrapolate trends, identify anomalies, and so on. Data mining, also known as KDD (the analysis step of the Knowledge Discovery in the Databases process), is one of the most interesting areas of research in the community of databases. It consists of an automatic extrac-tion of patterns representing knowledge implicity present in large databank systems (databases, data warehouses, web, etcetera). This area collects sci-entific contributions by researchers from different fields, such as statistics,
artificial intelligence, machine learning and visualization.
The data mining finds wide application in Bioinformatics, for exam-ple in the classification and analysis of biological data as, for examexam-ple, se-quences, networks and expression profiles. In particular, the frontier of re-search in Bioinformatics disponing of technologies such as deep sequencing (eg RNASeq) in the coming years will be the core of a strong innovation that will focus on development of new algorithms and methods of learning.
1.4.1
The data mining process
The main purpose of data mining is not to give an explanation of a phe-nomenon but to discover the knowledge and to predict. This means to iden-tify hidden structures in the data that make it possible to extract useful infor-mation and to make accurate predictions on the evolution of a phenomenon. This process typically follows several steps, and according to CRISP-DM (Cross Industry Standard Process for Data Mining) it can be define in six phases:
1. Problem definition: the first phase consists in the understanding of the area problem, where the goal of the project is translated into a data mining problem definition. In this step data mining tools are not required.
2. Data exploration: once finished the first phase, the data are collected, described and explored. Quality problems of the data are identified, and data analysis toos are used in order to explore the data.
3. Data preparation: the data model are built for the modelling process. In particular, the data are cleansed and formatted so as to be able to apply some mining functions.
4. Modelling: various mining functions are selected and applied based on the type of data mining problem. The mining experts can repeated this phase several times, changing parameters from time to time until optimal values are achieved.
5. Evaluation: the model is evaluated. If mining experts valuate that the model does not satisfy their expectations, the modelling step is applied again and they rebuild a new model, by changing its parameters, in order to reach optimum values. It’s clear that the modelling step and evaluation step are closely related.
6. Deployment: when the data mining results are obtained, they will be exported in a specif format or into database tables so as to be easily consulted.
1.4.2
Supervisioned Vs. Non-Supervisioned learning
It is important to distinguish between learning with or without supervision: in the second case, in fact, no a priori assumption on how to split the data is done, and the learning process occurs without specific knowledge of the content analyzed. In Bioinformatics, methods of unsupervised learning are used especially in the data exploration phase, to find in the data some not easily visible data structure.
Unsupervised learning allows to perform operations of data segmentation, that is, to identify instances exhibiting an inner regularity which is able to characterize them. Then, it can be used to partition the data in clusters (subsets) so that istances in each subset share some common features.
The supervised learning is usually fast and accurate and it can be applied to cases with a particular classification already known in a training set. The aim is to create a model that predicts this classification in new data.
1.4.3
Cluster Analysis
The expression “cluster analysis” indicates a number of unsupervised learn-ing algorithms that distribute objects into groups accordlearn-ing to similarity criteria. The number of groups may be determined automatically or cho-sen by the user. The similarity between objects is mathematically evaluated through a distance measure: less the objects are far from each other, the more similar and more easily part of the same group they will be. There are several measures of distance, such as the Euclidean distance, which is simply the geometric distance in the multidimensional space of the data, or Pearson’s correlation coefficient (technically called the Pearson Product Mo-ment Correlation or PPMC ) that shows the linear relationship between two variables.
Cluster analysis is applicable to a large variety of problems. In Bioinfor-matics, for example, it is very common for the examination of gene expression data on a large scale, obtained through microarrays. The most natural way to organize this data is to put in the same group those genes that have a
similar expression, because likely they will have good chance to participate in the same biological process. This does not imply that there is a direct in-teraction between the genes, since they can be co-expressed genes, separated by one or more intermediaries. It is better to use the correlation coefficient as the measure of distance between a pair of genes, which is more in line with the intuitive idea of co-expressed genes.
Hierarchical clustering for gene expression data
The most common approach for gene expression data is the hierarchical grouping, or tree grouping, which represents the relations between the genes by a sort of tree, where the proximity of the branches reflects the degree of similarity. First, the algorithms of hierarchical grouping consider each object as unconnected, and then, step by step, the objects are closer grouped to-gether. Thus, gradually, larger and larger groups of objects more dissimilar are connected. Finally, all objects are linked together in a large tree (den-drogram). The number of groups, or clusters, is determined automatically by the algorithm.
K-means clustering in Bioinformatics
Sometimes it is more convenient to choose the number of groups to split up the objects in our choice and then, using the K- means technique, divide N objects in a k a number of groups, with k < N, on the basis of their attributes, and so that they are as distinct as possible.
The attributes of the objects are represented as vectors and each cluster is identified by a midpoint called centroid. The algorithm follows an iterative
procedure. Initially, the algorithm creates k groups, whose elements are randomly selected or in an empirical manner, and calculates the centroid of each group. Then it moves the objects between the groups with the aim to minimize the variability within them and to maximize it between one group and another. Thus, it creates a new subdivision, associating each point to the group whose centroid is closest to, then the algorithm recalculates the centroids for the new groups and so on, until it finds a stable solution.
The gene expression profiles of people with a particular disease may have their own signature which can be a powerful tool for accurate diagnosis and prognosis, as well as the choice of the best cure. However, it is necessary to improve the bioinformatics methods to recognize the signatures in a secure manner.
1.4.4
Hidden Markov models
A common way to recognize patterns is to use probabilistic models such as HMM (Hidden Markov Models) [49]. In Bioinformatics, such models are widely used to identify homologies or to predict both the coding regions in the genome sequence and the mode of folding proteins. They take their name from the Markov chain, a sequence of states in which the transition from a present state to a future one occurs with a probability that depends only, or nearly so, from the present state, and not from the process or its past. This means that the present state of the system allows to predict the future behavior, while the previous history has little influence.
or tails with equal probability, independently of previous flips. The theory of Markov processes are often used to predict the succession of weather, to estimate macroeconomic dynamic, or to give an Internet rank. For example, Google uses PageRank, an algorithm that assigns a numerical score to the web pages, in order to measure their relative importance. The algorithm is based especially on the concept of popularity, that is the frequency a page is visited. HMMs are more complicated, because in this case the states of the system we want to analyze are not directly visible, but it is possible to observe only the events related with a certain probability.
The main aim of HMM is not only to determine hidden states from the observable events but also to identify the parameters of the model, that is the transition probabilities from one state to the next. Once the model is drawn, this may be used for further analysis and predictions on new events.
1.4.5
Networks
Progressively it becomes more and more necessary to integrate the biomolec-ular information to the higher level of the biological function of cells, tissues and whole organisms. Complex networks of biological elements interacting with each other (such as genes, metabolites, proteins) regulate the operation of living cells. These huge networks are organized into subnetwoks and each of them takes care of a particular aspect of the function of cell, such as cell cycle, the signal transmission and so on. These subnets, consisting of many elements interacting together to implement an activity of the cell, are called functional modules.
The reconstruction of the architecture of networks and modules, which in the past required a long collection of many experimental data, is now faster. This is possible thanks to the technologies that allow to quickly detect the expression of the genes and proteins and their changes in various conditions on a genomic range: microarrays, the deep sequencing, proteomic technologies, SNP (Single Nucleotide Polymorphism) analysis, comparative analysis of genomes, the ChIP on chip, the epigenomics. Bioinformatics and Systems Biology focus their research on the inference of the structure and the control mechanisms for various types of networks.
Commonly, the networks are inferred in a supervised way starting from very safe interactions, derived from data on proteins or gene expression. The networks are represented as graphs, in which the nodes are the genes or proteins and the arcs are the interactions. Cytoscape [50], CellDesigner [51] and MIM (Molecular Interaction Maps) [52] are only a few example of the tools available for drawing and view the diagrams.
Computational models are fundamental to understand the way a network regulates a biological function. A good network model allows to simulate cell behavior under a variety of stimuli and to facilitate the design of new drugs.
1.4.6
The regulatory sequences of the genes
It is possible to combine the information inside the genes in various ways to implement different activities. After studying the genomes, it has been clear that their length and the number of gene they contain are much less impor-tant than the way the genes are regulated and combined. For example, the
grain has a genome larger than the one of a man and contains approximately the same number of genes, but it is impossible to say that it is more evolved. Deciphering the control mechanisms of the gene expression is essential to analyze the behavior of networks. This, together with the large amount of gene expression data on large scale, has motivated the research for methods for the analysis of DNA sequences that regulate the expression of genes. The algorithms for the identification of regulatory regions of genes have been unreliable due to a too high number of false positives that tends to make the vast majority of predictions futile. That’s the reason why the researchers are developing new methods to make the predictions faster and less uncertain, although it remains necessary to verify in the laboratory.
The DNA sequence controlling the gene expression, the promoter, is lo-cated near the gene, usually at the extremity 50. The promoter binds together
a series of regulative proteins that allows, or not, the access to the gene of the machineries that produces the mRNA.
1.4.7
Prediction of functional binding sites
After the identification of a promoter, it is important to understand which transcription factors (TF ) bind to it, to regulate it. Usually, the transcrip-tion factors prefer specific sequences, which can be captured in the form of sequence motifs. The sequence motifs, then, may help to predict the possible binding sites for a given transcription factor in the genomic sequences.
The motifs of binding to transcription factors are collected in the TRANS-FAC [53] and JASPAR [48] databases, which also give the chance to
iden-tify the sites capable of binding transcription factors in any DNA sequence. The only problem is that the identified sites are able to bind transcription factors in vitro, but it is not guaranteed that it happens within the cell. The reason is that the structure of chromatin nearby the promoter strongly influ-ences the ability of a transcription factor to bind its target sequence. More-over, in models based on motifs of sequence, it is usually assumed that the binding of a transcription factor to a promoter is not influenced by adjacent sequences and the proximity of other proteins. But this is wrong, because the combinatorial interactions between various factors linked to multiple sites are essential for the gene expression. The result is that only a small part of the binding sites in vitro are also in vivo, so it is impossible for JASPAR and TRANSFAC to distinguish those sites with a functional role from those without. The relationship between false and true positives can be so high that it can frustrate any assumption.
To improve the predictions of the binding sites, the sequence motifs can be combined with phylogenetic footprints, as in the algorithm Consite [54]. Some algorithms capture also the cooperative interactions among transcrip-tion factors, binding to groups of sites within a promoter. These methods allow to reduce the number of false positives of an order of magnitude, that, however, is still not enough to improve the performance of the prediction. The creation of bioinformatics algorithms is important to better represent the mechanisms that regulate the transcription of genes. For example, it is possible to identify regions containing significative combinations of tran-scription factors, biologically related. There are various methods, such as MSCAN [55], MCAST (Motif Cluster Alignment and Search Tool) [56]
and ModuleScanner [57], which use a variety of statistics and data mining techniques, as the Bayesian networks. The task of identifying precisely the functional binding sites is facilitated by the use of technologies as ChIP on chip and ChIPSeq, which reveal the genomic sites actually linked to a factor of transcription within a cell.
The problem of the abundant presence of false positives also affects the numerous programs, trying to predict microRNA target genes, such as Tar-getScan [58], Diana-microT [59], PicTar [60] and others. These pro-grams seek regions at the untranslated 3’ of mRNA with a complementarity sequence with miRNAs. There are various sequences potentially capable of binding a single microRNA, considering, not only that generally the sequence complementarity between microRNA and mRNA target is not absolute, but also the brevity of the sequence of microRNAs. The programs use empirical rules to give a score to the various alignments, and use of phylogenetic prints and also the presence or absence of more binding sites within the mRNA. However, even if they can provide useful guidance, their results are not sat-isfactory.
1.4.8
The model of networks
The goal of genetics is to explain the relationship between genes and the behavior of a cell or an organism. This connection is based on complex reg-ulatory networks, having a modular structure. This means that the network is formed by a set of sub-networks of various forms, and each of them has a function which is distinct but also simpler than the one of the network as a
whole. The modular structure facilitates the modeling because it allows to consider separately the individual modules, which, although quite complex, are less complex than the global network. The events that take place in these networks can be thought of as logical elementary functions, bringing the cell from one state to another.
The networks modeling reproduces on a computer the implementation of these logic functions. The abundance of gene expression data, now avail-able, makes it possible to decode complex gene networks through the reverse engineering. It is used to identify the interactions between the genes, and thus discover the way a biological network works, through the analysis of experimental data connected to its components (usually they are the data of expression of the mRNA).
Network and model databases
The analysis of the structure and the behavior of the genetic networks re-quires not only new theories and algorithms, but also databases capable of storing and displaying information interactions. COXPRESdb (CO-eXPRESsed gene database) provides reports of coexpressed genes in mam-mals, obtained from expression profiles measured by microarrays [61]. It allows to create not only networks of coexpressed genes in the same tissue, but also genes with the same GO annotation and genes expressed in a similar way in humans and mice. The networks are displayed using the coefficients of correlation as criterion of proximity and are shown through Google Maps API.
MINT (The molecular InterAction database) [62]. GeneNetwork10 col-lects gene interactions known in humans, obtained from both other databases, such as HPRD11 (Human Protein Reference Database) [63], BIND (the
Biomolecular Interaction Network Database) [64], Reactome [65], KEGG [24], and GO) [37, 38] and new experimental data. In addition, it generates pre-dictions about possible new interactions.
JWS Online (Java Web Simulation) [66], BioModels [67] and DO-QCS (Database Of Quantitative Cellular Signaling) [68] are examples of databases of the models published on scientific journals.
The cellular signaling pathways not only have a great scientific interest, but are also considered a possible therapeutic target for many diseases.
1.4.9
Where you can find the algorithms?
The statistical and mathematical techniques useful for the exploration of bi-ological data can be found using various commercial packages. Among them, MATLAB®12 (MATrix LABoratory) has a section dedicated to
Bioinfor-matics, and allows the users to analyze and view genomic and proteomic data, and to build models of biological systems.
Another possibility for a good analysis of biological data is to use open sources, such as R. It is an open software environment for free access, where it is possible to implement a variety of statistical and graphical techniques, such as linear and nonlinear modeling, statistical tests, time series analy-sis, classification and clustering algorithms, and so on. The basic version
10Website: http://www.genenetwork.org/ 11Website: http://www.hprd.org
can be easily expanded through specialized software that can be obtained through CRAN13 (Comprehensive R Archive Network). Bioconductor14
is a project associated with R and focused on Bioinformatics applications, which provides tools for the analysis of genomic data.
1.5
New era of DNA sequencing
DNA sequencing is a method that used to line up the nucleotides that make up the DNA molecule, so it can be properly red and analyzed. The DNA sequence contains all the inherited genetic information that is the basis for the development of all living organisms. Within this sequence genes of every living organism are encoded, as well as instructions on how to express them in time and in space (regulation of gene expression). Determining the sequence is therefore useful in the research of why and how organisms live. There are portions of DNA whose functions we already know. Once sequenced, the DNA fragment analysis can compare the sequences already stored in the database cataloged online, even if a substantial part of the human genome remains unknown.
The knowledge of the genome is therefore useful in any field of biology and the advent of methods for DNA sequencing has significantly accelerated the research. In medicine, for example, the sequencing is used to identify and diagnose genetic diseases and to develop new treatments. In a similar manner, the genome of the pathogenic agents may lead to the development of medicines against contagious diseases. The speed of the process of
se-13For more information visit the website: http://cran.r-project.org/ 14Website: http://www.bioconductor.org/
quencing today is a great help to the large-scale sequencing of the human genome. Similarly, the sequencing of the genome of various plant and animal organisms, as well as of many microorganisms has been completed .
In these last years the DNA sequencing methods are constantly evolving. On the one hand the researchers want to improve the speed of execution, try-ing to lower the cost, on the other hand they attempt to get more accuracy. The determination of DNA sequences is also useful in different application fields and DNA sequencing may be used to determine the sequence of indi-vidual genes, larger genetic regions, full chromosome or entire genomes.
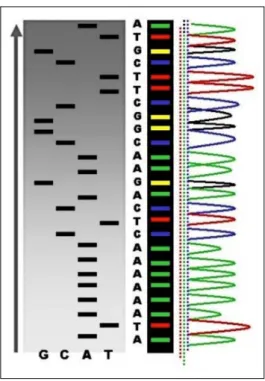
Figure 1.5: Electropherogram of a small portion of the DNA sequence.
1.5.1
Basic Methods
Several strategies have been devised to obtain the nucleotide sequence of the DNA. The first methods, including one developed by Allan Maxam and Wal-ter Gilbert in 1973 [69], were quite complicated. A turning point came in 1975 with the first publication of a enzymatic strategy still widespread, developed by Frederick Sanger and coworkers (the so-called chain terminator methods, or the Sanger method, as seen in Figure 1.6) [70,71]. This strategy soon be-came the method of choice, thanks to its relative ease and consistency. The Sanger method used fewer toxic chemicals and lower amounts of radioactivity
and for this reason it was the most widely method used in the first generation of DNA sequencers.
Figure 1.6: An example of the results of automated chain- termination DNA sequencing.
Another strategy, initially very popular, was developed by Maxam and Gilbert in 1977 and is known under the name of “the method of Maxam and Gilbert” [72]. This method allowed purified samples of double-stranded DNA to be used without cloning, even if the use of radioactive labeling and its technical complexity did not allow a real launch, unlike the Sanger method. Later in 1980, Walter Gilbert and Frederick Sanger shared half of the chemistry prize “for their contributions concerning the determination of base sequences in nucleic acids15”.
15The Noble Prize in Chemistry 1980:
1.5.2
Second generation HT-NGS
More recently, due to the increasing demand for low cost sequencing, new methods have been developed. They are characterized by the ability to se-quence many DNA fragments simultaneously (although with lower efficiency in terms of number of bases sequenced per fragment) opening a new era of sequencing. These methods, that parallelize the sequencing process, are able to produce hundreds of millions of bases of raw sequence (Roche2) and they can generate up to billions of bases in a single run (Illumina, SOLiD). Among the most important method belonging to the second generation of HT-NGS there are [73, 74]:
• Massively parallel signature sequencing (MPSS): this method was de-veloped in the 1990s and it was the first of the next-generation sequenc-ing technologies, but it was so complex to use.
• Polony sequencing: developed in the laboratory of George M. Church at Harvard, it was among the first next- generation sequencing system. This method was used to sequence a full genome in 2005 [75].
• 454 pyrosequencing: a parallelized version of pyrosequencing was de-veloped by 454 Life Sciences [76].
• Illumina (Solexa) sequencing: in this method DNA molecules and primers are first attached on a slide and amplified with polymerase so that local clonal DNA colonies, later coined "DNA clusters", are formed. To determine the sequence, four types of reversible termina-tor bases (RT-bases) are added and non-incorporated nucleotides are
washed away. A camera takes images of the fluorescently labeled nu-cleotides, then the dye along with the terminal 3’ blocker is chemically removed from the DNA, allowing the next cycle. Unlike pyrosequenc-ing, the DNA chains are extended one nucleotide at a time and image acquisition can be performed at a delayed moment, allowing for very large arrays of DNA colonies to be captured by sequential images taken from a single camera [77].
• SOLiD sequencing: in this method before sequencing, the DNA is am-plified by emulsion PCR. The resulting beads, each containing single copies of DNA molecule, are deposited on a glass slide [78].
In the Figure 1.7 it can seen the technological features of the principal methods of the second generation sequencing [79]:
In the following figure is shown a comparison of the principal DNA se-quencers of the first and second generation [80,81]. If we want more accuracy the cost of sequencing will increase (as shown in Table 1.1); furthermore if we need a greater amount of sequenced DNA, we will lose in accuracy despite the price of sequencing is lowered.
Figure 1.7: Advanced technological features of three leading second genera-tion HT-NGS platforms.
Single molecule Ion Pyrosequencing Sequencing Sequincing Chain Method real time semiconductor (454) by synthesis by ligation termination
sequencing (Illumina) (SOLiD (Sanger sequencing) sequencing)
Read length 2, 900 bp 200 bp 700 bp 50 to 250 bp 50 + 35 or 400 to
average 50 + 50 900 bp
Accuracy 87% to 90% 98% 99.9% 98% 99.9% 99.9%
Read per run 35 − 75 up to 5 1 million up to 3 1.2 to 1.4 N/A thousand million billion billion
Time per run 30 minutes to 2 24 1 to 1 to 20 minutes 2 hours hours hours 10 days 2 weeks to 3 hours
Cost per 1 $2 $1 $10 $0.05 to $0.15 $0.13 2, 400$ million bases
Advantages Longest read Less expensive Long read size. Potential for high Low cost Long individual length. Fast. equipment. Fast. sequence yield, per base reads. Useful
Fast depending upon for many sequencer model application
and desired application
Disadvantages Low yield Homopolymer Runs are Equipment can Slower than More expensive at high errors expensive. be very other and impractical
Homopolymer expensive methods. for larger
errors. sequencing
projects.
1.5.3
Third generation HT-NGS
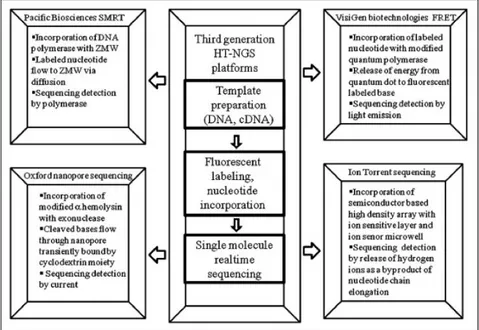
“Although the PCR amplification has revolutionized DNA analysis, but in some instances it may introduce base sequence errors or favor of certain sequences over others, thus changing the relative frequency and abundance of various DNA fragments that existed before amplification. To overcome this, the ultimate miniaturization into the nanoscale and the minimal use of biochemicals, would be achievable if the sequence could be determined directly from a single DNA molecule, without the need for PCR amplification and its potential for distortion of abundance levels. This sequencing from a single DNA molecule is now called as the third generation of HT-NGS technology” [79]. Here is a list of the principle methods belonging to the third generation of HT-NGS we have, even if we do not go into the details of each individual method:
• HeliscopeTM single molecule sequencer;
• Single molecule real time (SMRTtm) sequencer; • Single molecule real time (RNAP) sequencer; • Nanopore DNA sequencer;
• Real time single molecule DNA sequencer platform developed by Visi-Gen Biotechnologies;
• Multiplex polony technology;
In the Figure 1.8 we can see the technological features of the principal methods of the third generation sequencing [79]:
Figure 1.8: Advanced technological features of three leading third generation HT-NGS platforms.
1.5.4
Application of sequencing technologies on human
genome research
As said above, there are many applications of the sequencing technologies especially in the field of research and medical care. Recently, a large quanti-tative of studies done by the use of the HT-NGS have emerged, particularly:
• Epigenetics; • ChiP-Seq;
• Genome wide structural variation in human population; • Detection of inherited disorders;
• Complex human disease; • Cancer research;
• RNA sequencing; • Personal genomics;
• Sequencing of mitochondrial genome.
For this reason, it comes the need to improve more and more speed, accuracy and price of the sequencing technologies. This is the challenge many laboratories are trying to overcome.