Università degli Studi Roma Tre
Facoltà di Economia “Federico Caffè”
Scuola Dottorale in Economia e Metodi Quantitativi
Dottorato “Istituzioni, ambiente e politiche per lo sviluppo economico”
The distributive effects of carbon taxation in Italy
PhD candidate:
Supervisor:
Dott.ssa Chiara Martini Prof. Antonio Di Majo
Tutors:
Prof. Luca Salvatici Prof.ssa Silvia Tiezzi
Abstract
This work is aimed to assess the distributive incidence of carbon taxation: the issue has not been widely investigated whereas more attention has been focused on the efficiency of ecological tax reforms. Despite of their central role for the achievement of the Kyoto targets and the elaboration of post Kyoto strategies, the analysis of the introduction of energy policies in Italy are not very spread. In particular, ex post analysis or ex ante simulation of policies can represent very useful tools in order to make light on distributional effects. Even if in this area evidence remains very limited, concern with the distributional impacts of environmental policy arises from a widespread fear that such measures could be regressive: poorer households pay disproportionately more of the financial costs associated with the introduction of environmental policies (OECD, 2004). This research is organized in four chapters. The first offers a review of European experiences in energy taxation, with a focus on Nordic countries, and it also describes the Italian market of energy products. The second chapter highlights two main literature fields, represented by optimal taxation and double dividend; other studies concerning energy taxation distributional impacts are also reviewed. In the third chapter the work hypothesis and the demand system approach are described, whereas in the fourth chapter the estimation and its results are described and discussed.
According to Kyoto Protocol domestic policies to reduce carbon emissions can include carbon/energy taxes, emissions trading, command-and-control regulations and other policies. Market methods are usually preferred in terms of efficiency, and carbon taxes are thought to be the easiest to implement and monitor; furthermore, carbon taxes can act as a continuous incentive to search for cleaner technologies. Until now, only a few European countries have implemented energy or carbon taxes: Nordic countries have been the first-comers and this seems to suggest a tight link between institutional environment and the potential for policy adoption.
The consequences of environmental policies in terms of distributive impacts and competitiveness represent fundamental factors in determining their political acceptability. Carbon taxation may well be regressive but this depends on the hypothesis on price translation, the concept of income adopted, how tax revenue is used and how different households respond to price changes.
In my analysis I assume that the carbon tax is fully shifted forward to consumers; for energy goods, which are traded on international competitive markets, and for which the distribution market can be defined oligopolistic, this is a reasonable assumption. The distribution of the effects of CO2 abatement policies can be measured along a number of
dimensions including household income groups, geographic regions, industries and different generations. The object of my simulation is represented by personal income distribution, then by households; in particular, I examine households own and cross-price elasticities and welfare effects in terms of different incidence measures, namely equivalent and compensating variation. The incidence of an energy tax is connected to consumer behaviour in two ways: direct consumption, represented by the purchase of fossil fuels, and indirect consumption, constituted by the purchase of assets whose production has demanded fossil fuels use. My attention is devoted only to the direct consumption component, focusing on the heterogeneity of behavioral responses among different household types and macro-regions, linked to different consumption habits and substitution possibilities.
Assuming that the problem of deciding how much to consume at any given time has been solved, a demand system for the allocation of family income to an exhaustive set of good and services is estimated. Data from the Italian National Statistical Institute (ISTAT) are
used, in particular a sample extracted from the Indagine sui Consumi delle Famiglie. Durable goods are excluded from the sample and six goods enter into the demand system: food, public transport, transport fuels, heating fuels, electricity and a residual good, which contains all the other goods.
The carbon tax is modelled making reference to the Financial Law for 1999 and the DPCM 15/1/1999; one year after its adoption, the carbon tax with its gradual excise rate augmentation – aimed to reach an objective level in 2005 – has been eliminated for fear of its inflation consequences and adversely distributed impacts.
After having analyzed the different functional forms, the Almost Ideal Demand System (AIDS) and the Quadratic Almost Demand System (QAIDS) have been identified as the preferred empirical models, thanks to their theoretical characteristics that is being based on a representative consumer but allowing flexibility in the consideration of demographic characteristics.
The estimation of the AIDS (Deaton and Muellbauer, 1980) and QAIDS (Banks et al., 1997) has provided the parameters of the cost function that represent the inputs for computing price and income elasticities and enable to compute True Cost of Living indices and welfare measures. For the first time True Cost of Living indices are derived for the quadratic model: on this basis, both the compensating and equivalent variations are computed and compared. I show how the output of demand system estimation can be used to simulate different taxation scenarios, modelled by referring to the Financial Law for 1999, and to estimate the revenue raised by carbon taxation.
The welfare effects linked to the carbon tax proposed by the Financial Law for 1999 and also to different taxation scenarios (namely taxation only on heating fuels, fuels, electricity) have been computed. The results show that the carbon tax proposed by Financial Law for 1999 is not regressive, but the simulation of different taxation scenarios allows a regressive component to emerge, related to fuels taxation. The relevance of geographical variables is confirmed by the differentiation in welfare impacts between the North and the South of Italy, which emerges in the taxation scenario where only heating fuels are taxed.
The empirical work has demonstrated the environmental effectiveness of introducing carbon taxation in Italy, given the high price elasticity of energy products; it has also confirmed the key role of public transport, characterized by a high degree of substitutability with private transport. Furthermore, the analysis of elasticities and welfare measures has shown the importance of distinguishing household characteristics and macro-regions when analysing behavioural responses. Finally, the revenue estimation at aggregated level can constitute the starting point for hypothesizing compensation mechanisms directed to particularly affected household profiles or geographical areas. The originality of my research is linked to the comparison between two functional forms, and the identification of the over-estimation in welfare effects using AIDS. An approach in terms of demand system estimation has many potentialities linked to the utilization of the elasticities for the computation of revenue variation produced by different taxation scenarios. Furthermore, the revenue raised from the households has been compared with the welfare impacts, obtaining the excess burden of taxation.
This research work could be widened by investigating the distributive effects on a more specific sample (i.e. only car owners) or computing the emission reduction associated with the policy simulated; on a larger basis, the demand system could be estimated on individual data, linked with bottom-up or top-down models and employed to provide the informative basis for collective decision making models.
CHAPTER 1... 9
1.1 Introduction ... 9
1.2 Different policy tools implications... 12
1.3 The recent energy policy ... 15
1.3.1 The Kyoto Protocol... 18
1.3.2 The emission trading market... 21
1.4 Environmental taxation in Europe ... 24
1.5 A European carbon tax ... 27
1.6 European experiences in energy taxation... 31
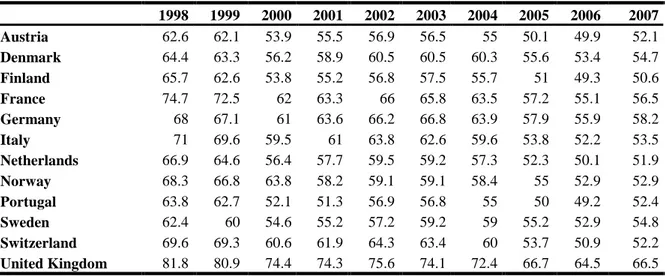
Finland ... 32 Sweden ... 33 Norway ... 35 Denmark ... 37 Switzerland ... 38 Germany ... 40 United Kingdom ... 42 Portugal... 43
1.7 The market of energy products in Italy ... 44
Electricity ... 46
Natural gas... 52
Fuels ... 54
1.8 Emission reduction policies in Italy ... 56
1.8.1 The Italian carbon tax ... 62
CHAPTER 2... 70
2.1 Taxation and public goods ... 70
2.1.1 The optimal taxation literature... 70
2.1.2 Marginal cost of funds measures ... 76
2.2 The double dividend hypothesis ... 79
2.3 The incidence analysis ... 83
2.3.1 Welfare measurement ... 83
2.3.2 The incidence concept ... 85
2.3.3 Incidence measurement ... 88
2.3.4 Aggregation and social welfare measurement ... 95
2.3.5 Equivalence scales ... 96
2.4 Other studies review... 99
2.4.1 Gasoline taxes... 99
2.4.2 Energy taxes ... 106
2.4.3 Carbon taxes ... 107
2.4.4 Other taxes ... 112
CHAPTER 3... 114
3.1 The empirical assumptions ... 114
3.2 Some technical issues on demand systems... 116
3.2.1 Aggregation over goods and consumers ... 117
3.2.2 Rank... 120
3.2.3 Flexibility... 123
3.3 Demand system estimation ... 124
3.3.1 Linear Expenditure System... 129
3.3.2 Translog ... 130
3.3.3 Rotterdam ... 131
3.3.4 AIDS... 132
3.3.5 QAIDS ... 136
3.4 Demographic variables in demand system estimation ... 138
3.4.1 Demographic translating and scaling... 139
3.4.2 EASI ... 142
3.5 Exact price indices ... 145
CHAPTER 4 ... 156
4.1 Data description ... 156
4.1.1 Descriptive analysis... 156
4.1.2 Prices ... 162
4.2 The empirical models and their results ... 163
4.3 Elasticities ... 168
4.4 True Cost of Living Indices and welfare measures ... 177
4.4.1 The methodological approach ... 177
4.4.2 The different taxation scenarios ... 180
4.4.3 The results ... 182
4.5 Aggregation and raised revenue ... 196
4.6 Conclusions and future research developments ... 206
APPENDIX I... 211
Table I - AIDS national ... 211
Table II - AIDS regional ... 212
Table III - QAIDS regional ... 215
Table IV - QAIDS modified ... 218
APPENDIX II ... 219
Table I - Average elasticities in QAIDS regional... 219
Table II - Average elasticities in AIDS regional ... 220
Table III - Average elasticities in QAIDS modified ... 221
APPENDIX III... 223
Table I – Absolute values of macro-regional annual CV and EV (Euro 1998)... 223
Table II – Aggregate compensating variations (welfare losses) for macro-region (million/Euro 1998) .... 226
Table III –Excess burden for macro-region (Euro 1998) ... 227
Chapter 1
1.1 Introduction
The distributive incidence of environmental policies has not been widely investigated, whereas more attention has been focused on the efficiency of environmental reforms (Fullerton and Metcalf, 2001; Fischer, 2004; Goulder et al., 1999; Ricther and Schneider, 2003). Even if in this area evidence remains very limited, concern with the distributional impacts of environmental policy arises from a widespread fear that such measures could be regressive: richer households receive disproportionately more of the benefits associated with improved environmental quality whereas, at the same time, poorer households pay disproportionately more of the financial costs associated with the introduction of environmental policies (OECD, 2004). Perhaps the most cogent reason for being concerned with environmental policy and distribution is that understanding distributional impacts can help to shape policy packages that are more likely to be accepted by the public. A transparent framework for analysis can be useful in communicating environmental policy’s costs and benefits at any chosen level of detail, and it can ease general understanding of related welfare effects.
The detection of the adverse effects of carbon dioxide emissions at the beginning of the 1990s, resulting mainly from the combustion of fossil fuels, has led to proposals for non-market mechanisms such as regulation, and non-market mechanisms such as tradable emissions permits and carbon taxes, both aimed at reducing emissions (Hahn, 2000). Market methods are usually preferred in terms of efficiency and the carbon tax is thought to be the easiest to implement and monitor. A carbon tax would affect the price of fossil fuels and thus industrial and consumer prices: in this way the level of final demands is altered, reducing fossil fuel use and aggregate carbon dioxide emissions (Baranzini et al., 2000).
To levy an environmental tax modifies the expenditure choices of economic agents; environmental taxation turns out to be regressive if it concerns goods and services that represent a relatively more large expenditure share of low income households. Households that react more significantly and rapidly to the pressures to reduce the consumption of energy intensive goods will have to bear a smaller impact in terms of costs. In detail, the incidence of an energy tax is connected to consumer behaviour in two ways: it is necessary to consider direct consumption, represented by the purchase of fossil fuels, and indirect consumption, constituted by the purchase of assets whose production has demanded fossil
fuels use. Household responsiveness to price changes can be related to disposable income and this can determine tax regressivity. The basis upon which it is often assumed that carbon/energy taxes are regressive is intuitively obvious: lower-income households tend to spend a larger proportion of total household expenditures on fuel for domestic energy services (i.e. heating, hot water, cooking and lighting).
The effects of environmental reforms on different socio-economic groups are not limited to the increases in prices of the goods and services they buy, but come from other sources, among which the reductions in environmental damages they experience. Thus, any analysis of policy costs should be put together with a survey of benefits distribution, because cost regressivity could be compensated by benefit progressivity. Even if it is certainly important to take this point into consideration, one should be cautious about considering environmental risks exposure to make inferences about the distribution of welfare gains, for at least four reasons. First, due to a lack of data, the measures of environmental risk do not adequately account for the degree of exposure and other relevant factors: rather little is known on this topic. One could think, for instance, that long-term benefits related to measures to fight against global warming are more evenly distributed, while the benefits related to human health policies have a more local character and then they are more unevenly distributed. Second, when policies create non-uniform environmental improvements, the existing risk distribution can complicate the detection of distributional benefits linked tothe reform. Third, when environmental quality changes, we also need to describe the possible effects on market prices or wages, as these price changes also affect household welfare. Finally, in order to translate physical benefits into welfare gains we need to measure how different households value environmental quality: a factor that could weaken or enhance inequality in environmental benefits distribution is represented by differences in preferences between different income groups. I will not handle the issue of environmental benefits, due both to the mentioned problems and to the lacking of data. My scope will be limited to show if introducing carbon taxation in Italy has a regressive impact just in terms of costs incidence. Because the essential purpose of environmental policy is to change consumption and production patterns, green reforms inevitably entail winners and losers among households and firms (Kriström, 2003): for this reason it is fundamental to scrutinize their effects in a distributional perspective. My decision to examine carbon taxation is due to its peculiarity as an environmental policy instrument, namely potentially embedding adverse distributional effects and, at the same time, raising a double dividend, with the possibility of correcting the regressive impacts produced. Even if my thesis
focuses on impacts on household consumption, it is worth mentioning that relaxing the hypothesis of complete translation on end-users prices can contribute to show the overall set of social dilemmas posed by carbon taxation. In fact, since green taxation reforms are likely to affect many industrial sectors, this approach to environmental protection embeds both competitiveness effects and potential adverse distributional effects. Policy makers, in order to identify the better intervention strategy, should evaluate the trade off between the different kind of impacts, taking into account and balancing the interests of all the actors involved.
The distribution of the effects of CO2 abatement policies can be measured along a number
of dimensions including household income groups, geographic regions, generations and industries. An important dimension of environmental taxation is the variation in impacts across industries: carbon taxes can reduce net output prices in the carbon-supplying industries and raise costs in industries that intensively employ fossil fuels as inputs. These price and cost impacts have, in the short term, the potential to seriously harm profits and employment: their distribution crucially influences political feasibility, since the lobbies of fossil fuels’ producers have significant weight in the political process.
I will not examine carbon tax implications for firms; on the contrary, the object of simulation will be represented by personal income distribution, then by households. Environmental policy can produce two types of disparities in welfare: the first is due to a change in environmental quality and refers to the externalities whereas the second is linked to the distribution of financial effects (OECD, 2004). My attention will focus on this second type of impact and on an analysis of households elasticities and welfare effects in terms of different incidence measures in particular. Distributional impacts consist of different kinds of financial effects on household groups. They generally include direct compliance costs which can be in the form of energy payments or adaptive expenditures, and indirect compliance costs represented by higher costs for other goods and services due to increased production costs brought about by regulation. The overall distributive incidence of environmental policies also includes even more indirect effects arising through effects on public finance, labour markets, real estate markets: these can either exacerbate or counteract the distributional impacts associated with more direct financial effects. Carbon tax, like any other public policy, will result in costs which vary across socio-economic groups depending on their expenditure patterns, behavioural responses and employment opportunities. While environmental policy could entail unemployment and impose other adjustment costs, these costs are seldom quantified in distributional studies.
The real world consists of heterogeneous households, each with different possibilities to adjust to new policies; the importance of this fact has not been sufficiently appreciated by economists in the shaping of environmental policy. I will look at the welfare losses, in terms of real expenditure, suffered by different households, grouped according to number of members, age and geographical area. Price elasticities will also be calculated as a first approximation of the economic and environmental impact of the tax. I will then calculate tax distributional impacts on households with different income levels using compensating and equivalent variations.
The analysis of environmental taxation distributional impacts could be completed with the examination of tax revenue recycling options, which represent a way to alleviate the potential regressive impacts. One possibility is by means of lump-sum redistribution: the lowest income groups will proportionally receive a higher amount, relative to their income, than highest income households will do. Another possibility to compensate poorer households – and at the same time to reduce other existing distortionary taxes – is represented by using tax revenue to reduce labour taxes, decrease income taxation, or change the social security system. Such measures should be accompanied by a complementary redistribution policy targeted at those social groups that do not benefit directly from tax cuts, such as the pensioners and unemployed.
1.2 Different policy tools implications
This paragraph will offer an overview about the distributional implications associated to different policy tools: in fact, even if my attention is devoted to a specific energy policy, represented by carbon taxation, the differences in distributional impacts with respect to alternative intervention strategies seem worth to be analysed.
The European system of emissions trading fixes a maximum limit to the total emissions, assigning to every plant an emission quota, a part of which should be periodically given back to the competent national authority. There are different ways to satisfy such obligation: giving back the assigned quotas, buying quotas from other plants, obtaining credits from emission reduction projects linked to the Kyoto Protocol. A similar mechanism allows, through a negotiation procedure, to buy or sell own pollution rights, and it changes market signals, in order to modify agents behaviour.
Differently, a command and control approach, like environmental standards, can be preferred both by the public administrators, for reasons linked to reduced informative requirement and to greater certainty of the result, and the industrial sector, because of the
possibility of negotiation and subsidies. Such approach generally does not produce a dynamic incentive to innovation or improvement beyond established goals, and risks to determine an inefficient resource use; then, if possible, command and control tools should go with marked based tools.
Since the introduction of carbon taxes alters prices, once fixed the tax rate pollution reduction takes place thank to market action. Consumptions of taxed assets diminish, energetic saving and investments in efficiency and fuel substitution are stimulated. An important feature of this policy tool is diminishing the cost related to target attainment, allowing every firm to choose the more efficient strategy: firms with high marginal reduction costs will pay the tax whereas firms with low marginal reduction costs will reduce polluting emissions.
Different kinds of taxes can be levied on the content in carbon of the energetic products (Baranzini et al., 2000): both energy taxes and carbon taxes are excise taxes, but they have some differences. An energy tax is defined as a fixed absolute amount and is imposed on both fossil fuels and carbon-free energy sources, according to their energy (or heat) contents, with renewable energy usually exempted. By contrast, a carbon tax is levied according to the carbon content of fossil fuels and is thus restricted to carbon-based fuels only. Given that oil and gas have greater heat contents for a given amount of CO2
emissions as compared with coal, an energy tax lies more heavily on oil and gas than a carbon tax. Moreover, an energy tax burdens nuclear energy, which could provide large-scale generation of electricity without a directly parallel production of CO2 emissions. If
the goal is reducing CO2 emissions, a carbon tax is clearly more cost effective than an
energy tax. Indeed, a carbon tax equals the marginal cost of CO2 abatement across fuels
and therefore it satisfies the condition for minimizing the global cost of reducing CO2
emissions. Therefore, the implementation of an energy tax will lead to poor CO2 target
achievement or else to unnecessarily high costs as compared with a carbon tax. This can be explained by two factors: price-induced energy conservation and fuel switching. Carbon taxes reduce CO2 emissions both through their price mechanism effects on energy
consumption and fuel choice. By contrast, since energy taxes are imposed on fossil fuels and nuclear energy, the incentive for fuel switching is lower and the reductions in CO2
emissions will be mainly achieved by price-induced energy conservation. Thus, a higher energy tax is required for achieving the same reduction target as compared with a carbon tax.
Different environmental policies will have various distributional implications, as discussed in the following passages. Although taxation is certainly an efficient tool, its consequences in terms of distributive impacts and of competitiveness represent fundamental factors in determining its political acceptability. All efficient forms of regulation lead to a distribution of costs that is determined by general equilibrium cost incidence, factor endowments and consumption patterns. The distributional effects of tradable permits can be similar to those of taxes since, as noted by Kriström (2003), in a partial equilibrium perspective the use of a tax is comparable to a tradable permits system where permits are auctioned. With environmentally related taxes, distributional effects depend on how revenue is recycled but the rent is generally returned to tax-payers; differently, with permits the distributional implications differ according to the allocation choice, that is to say auctioning versus grandfathering. Auction/tax revenue can be used in a multitude of ways, benefiting many different groups: labour, consumption, payroll or capital gains taxes could be cut, deficit could be reduced. In addition, the revenue-recycling benefits reduce total costs. Grandfathering is usually used to compensate some current owners of specific capital, since it produces a pure wealth effect: only those who directly receive permits gain. The same effect can be achieved with targeted tax breaks: these not only provide direct compensation, but also increase the efficiency of the industry by reducing tax distortions. Furthermore, with grandfathering poorer people are likely to bear a greater burden in terms of costs, because they are workers and consumers more often than shareholders. Conversely, in the case of taxes and auctioned permits cost bearing is widely spread and they are more likely to lead to equitable outcomes than grandfathered permits. With regard to subsidies, the distributional impacts will be linked to the degree of regressivity or progressivity of the tax system used to raise the finance required to finance such programs. Indirect taxation, and in particular a system of excise duties, has distributive effects which favour lower income classes if some conditions are in force. First, the Engel law must be verified: the necessary goods expenditure share should decrease when income grows and luxury goods expenditure share should increase. Clearly, to identify these goods is often troublesome, especially when households’ demographic characteristics change. Second, excises duties should be addressed to those goods which have an income elasticity greater than one. The group of goods should be large enough to include potential substitutes: in this manner, the substitution effect produced by the tax cannot change consumption patterns in a way that affects tax revenue. Then the own-price elasticity should be moderately low; at the same time, even if this one is often a tacit assumption, the supply
elasticity should be high in order to translate the tax on consumers. Finally, the expenditure shares on taxed goods should be higher for richer households. With respect to the condition on income elasticities, the hypothesis of a changing expenditure pattern when income changes is added: once identified the goods to be taxed through the study of the elasticities, the consumption pattern must change with income in order to have positive distributive effects.
On the other hand, when these conditions are not verified environmental and energy taxation could have negative distributive impacts that are worth to be examined. I want to specify that the distributive effects are not an objective of the excise duties as fiscal instrument, in the sense that the distributive impact does not represent a criterion adopted to design the excise burden and its structure. Then, the distributive impact should be considered separately from taxation efficiency, such as an effect which the government may take into account in order to compensate some damaged groups.
To summarize, all policy tools have potential but different distributional impacts; in the case of taxes and auctioned permits direct effects on households groups are generally more straightforward; however, even for taxes the analysis is complicated by the inclusion of indirect impacts and behavioural adjustments. The fact that the distributional implications of taxes have been particularly highlighted in literature is probably due to their greater visibility and should not be considered as a proof of their greater regressivity. A review of empirical evidence suggests that environmental policy may well be regressive (Smith, 2000; Symons et al., 1998; Cornwell and Creedy, 1996), but this conclusion depends on the concept of income, how revenue is used and other pertinent dimensions of the analysis, in particular how different households respond to price changes. Paragraph 2.3 focuses on the description of the different choices available to take into consideration these elements.
1.3 The recent energy policy
The international political response to climate change began with the adoption of the United Nations Framework Convention on Climate Change (UNFCCC) in 1992. The UNFCCC sets out a framework for action aimed at stabilizing atmospheric concentrations of greenhouse gases to avoid “dangerous anthropogenic interference” with the climate system. It entered into force on 21 March 1994, and now has 192 parties. In December 1997, delegates at The Third Conference of Parties (COP 3) agreed upon the Kyoto Protocol that commits developed countries and countries in transition to a market economy to achieve quantified emission reduction targets. Following COP 3, parties began
negotiating many of the rules and operational details concerning how countries will implement and measure their emission reductions.
In November 1998, the COP 4 elaborated the rules and operational details for the Protocol implementation adopting the Buenos Aires Plan of Action; this document set COP 6 as the deadline for finalizing these details and strengthening implementation of the UNFCCC. This Conference started in November 2000 but, since negotiations were not successful, it was suspended until July 2001. Parties reconvened in Bonn and adopted the Bonn Agreements, a decision that provided high-level political direction on the implementation of the Kyoto Protocol.
In November 2001 at COP 7 delegates reached agreement on Marrakesh Accords: they consisted of a package of draft decisions on many of the details of the Kyoto Protocol, including flexible mechanisms, reporting and methodologies, compliance. In COP 8 and COP 9 various technical rules and procedures were elaborated. Always in the context of Marrakesh Accords, COP 10 agreed on two new agenda items focused on adaptation and mitigation, and began informal negotiations on the complex and sensitive issue of how parties might engage on commitments to combat climate change in the post-2012 period. The meetings in Montreal, held from 28 November to 10 December 2005, formally adopted the Marrakesh Accords and also engaged in negotiations on longer-term international cooperation on climate change. COP 11 agreed to consider long term cooperation also under the UNFCCC and post-2012 arrangements have then been discussed in a series of meetings. The Ad Hoc Working Group on Further Commitments for Annex I Parties (AWG) and the workshop “Dialogue on long-term cooperative action to address climate change by enhancing implementation of the Convention” (Convention Dialogue) have convened four times, in Bonn (May 2006 and 2007), in Nairobi for the COP 12 (November 2006), and in Vienna (August 2007). In November 2006, the AWG elaborated a work programme focusing on the following three areas: mitigation potentials and ranges of emission reductions, possible means to achieve mitigation objectives, and consideration of further commitments by Annex I parties.
As he presented the EU executive’s work program for 2007, the European commission’s president José Manuel Barroso said that energy efficiency and climate change were among the top priorities. In particular, the Commission prioritizes a review of the EU carbon emission trading system and a paper setting out a proposed EU position for a global post-2012 framework. At the end of 2006, there was significant support between EU governments to commit unilaterally to reducing greenhouse gas emissions 30% by 2020.
Referring to the conclusions of the COP12 held in Nairobi, EU leaders had backed a vague goal for all industrialized countries to reduce emissions by 15-30% by 2020. The UK, Germany, Italy and Sweden were among the countries endorsing a 30% target and they also support a follow-up reduction target of 60% by 2050. In a similar context – and from Italy’s point of view – to levy a domestic carbon tax is an option worth to be considered. However, Hungary, Slovakia and Poland warned against the EU making a “hasty declaration of commitment” before other developed and developing countries signal their willingness to do likewise. They also said that any future EU target should be differentiated to consider the varying growth potential and emissions of its member states. European ministers underlined their commitment to linking the EU emissions trading system with other national and regional schemes.
At its third session in May 2007, the AWG agreed to develop a timetable to complete its work so as to avoid a gap between the first and second commitment periods. In August 2007 delegates focused on mitigation potentials and possible ranges of emission reductions for Annex I parties: their conclusions recognize that to achieve the lowest stabilization level, Annex I parties as a group would be required to reduce emissions by a range of 25-40% below 1990 levels by 2020. In the United Nations Climate Change Conference in Bali (COP 13), held between 3 and 14 December 2007, delegates deliberated on a wide range of topics and agenda items, with a major focus on finalizing a post-2012 regime by December 2009, after the expiration of Kyoto Protocol’s first commitment period (International Institute for Sustainable Development, 2007).
Negotiations were conducted in a number of groups under the aegis of both the Convention and the Protocol. Under the Convention, the discussions focused on how following up the Convention Dialogue, while under the Protocol the AWG discussed its work programme and timetable. Delegates also held consultations on the Russian proposal on voluntary commitments. During the negotiations, several issues proved difficult to resolve, especially during the talks on long-term cooperative action under the Convention: the mitigation strategies for developed and developing countries were particularly contentious. The turning point in the negotiating process has been represented by parties agreement to a proposal by India and other developing countries on mitigation actions by developing country parties in the context of sustainable development, supported by technology and enabled by finance and capacity building. After the EU and all other parties had accepted this proposal, the USA agreed to join the consensus,and the decision on long-term action under the Convention was adopted. This decision established a process and set out
guidance and direction for a series of meetings over the next two years under both the Convention and Protocol, with the aim of producing a comprehensive outcome on
post-2012 issues at COP 15 set up in Copenhagen (30 November-11 December 2009). As final
output of Bali negotiations, the Bali Action Plan was adopted: world governments agreed upon a negotiating framework to decide a new global climate policy by 2009. If successful, the Action Plan would culminate in a new global climate policy in Copenhagen in late 2009. The Bali Action Plan commits all developed countries to measurable and verifiable actions, in order to achieve quantified greenhouse gas emission reduction targets; developing countries have to develop to appropriate mitigation actions. Even if the Action Plan suggests no concrete emission reduction targets because of the insistence of the USA, a footnote makes reference to documents from the intergovernmental panel on climate change (IPCC), according to which reductions of up to 40 per cent by 2020 are needed to head off dangerous climate change. In a separate agreement, parties to the Kyoto protocol agreed to be fully guided by the IPCC recommendations in setting a second round of commitments by 2009. A review of the Protocol, which will focus also on how to enhance carbon markets, was also launched.
The paragraph will at this point be divided in two sub-paragraphs: Paragraph 1.3.1 will offer an overview of the Kyoto Protocol related issues, while Paragraph 1.3.2 will describe the European emission trading scheme (ETS). More than informing on recent developments in the world and European energy policy, the scope of both sub-paragraphs is represented by providing with full information on the high potential of an instrument such as carbon taxation in the current context.
1.3.1 The Kyoto Protocol
A global common good, like greenhouse effect reduction, definitely needs intervention in the transport and energy sectors and therefore involves the entire population. In this context, the Kyoto Protocol, which was opened for signature in March 1998 and came into force in February 2005, plays a central role.The Protocol has been ratified by the European Community on 31st May 2002. Notable exceptions among countries that have made the agreement official include the United States and Australia; other countries, like India and China, which have ratified the Protocol, are not required to reduce carbon emissions under the present agreement. Despite some steps towards cooperation, and the interest of all nations in dealing with the common problem of climate change, there are significant conflicts within the international community over the measures that should be taken. Developing countries fear the imposition of restrictions on their growth in the form of
emissions limitations that would curtail their use of own energy and other national resources. Since most net greenhouse gas emissions currently originate – and historically originated – in the industrialized countries, whose patterns of development are at the root of the environmental problems we face today, the developing countries have consistently pressedthem to take the lead in reducing emissions.
To a certain extent the Kyoto Protocol has met this requirement. According to the Kyoto Protocol, the overall emissions of greenhouse gases from developed countries should be on average 5% below 1990 levels in the period 2008–2012; in particular, the European Union has agreed to reduce its greenhouse gas emissions by a collective average of 5% below 1990 levels. Quantified emission limitations and reduction commitments for Annex I Parties1 are established without prescribing the domestic policy tools to use to achieve them. Article 2 of the Kyoto Protocol gives Annex I countries considerable flexibility in the choice of domestic policies to meet their emission commitments. It provides four market-oriented flexibility mechanisms to help to achieve Kyoto targets: pooling of commitments among industrial country Parties to achieve compliance jointly (Article 4.1); transfer among industrial country Parties of joint implementation project-based emissions reduction units (Article 6); the Clean Development Mechanism (Article 12); and emissions trading among industrial country Parties (Article 17). Among them, only the Clean Development Mechanism involves both industrial and developing countries. It enables industrial countries to obtain credits for their Protocol emissions limitation obligations by investments, including investments by private firms, in projects to be realized in developing countries to reduce their greenhouse gas emissions.
Domestic policies can include carbon/energy taxes, domestic emissions trading, command-and-control regulations and other policies. Carbon taxes have long been advocated by economists and international organisations, because they allow to achieve the same emission reduction target at lower costs than conventional command-and-control regulations. Moreover, carbon taxes can act as a constant incentive to search for cleaner technologies whereas with command-and-control regulations there is no incentive for the polluters to go beyond predetermined standards. Until now, only a few European countries have already implemented energy-related taxes or taxes based on the carbon content of
1
Annex I parties are industrialized countries and countries with economies in transition. Developing countries are referred to as Non-Annex I countries. To date, the Kyoto Protocol has 176 parties, including Annex I parties representing 61.6% of Annex I greenhouse gas emissions in 1990.
energy products: Finland in 1990, Sweden and Norway in 1991, Denmark in 1992, Italy and Germany in 1999 and the United Kingdom in 2001.
Table 1.1 – The commitments of the member countries in accordance with article 4 of the Kyoto Protocol
Member Country Commitment (% change in emissions for 2008-2012 compared to the base year)
Austria -13 Belgium -7.5 Denmark -21 Finland 0 France 0 Germany -21 Greece 25 Ireland 13 Italy -6.5 Luxembourg -28 Netherlands -6 Portugal 27 Spain 15 Sweden 4 United Kingdom -12.5
Source: EU burden sharing agreement (Annex II Council Decision 2002/358/EC).
Table 1.2 – The achievement of the Kyoto targets in European countries (emissions in millions tons) 1990 1998 2000 2010 IEA 1998 IEA 2002 Objective 2008-2012 Austria 57,0 61,0 62,8 66,0 64,8 56,9 Belgium 106,2 122,5 120,3 121,2 114,4 98,2 Denmark 49,7 57,7 50,1 44,8 59,2 39,3 Finland 53,4 59,7 54,8 70,3 49,7 53,4 France 364,0 371,7 373,3 406,6 461,9 364,0 Germany 966,5 857,7 833,0 894,6 838,5 763,5 Greece 69,0 80,9 87,8 135,0 118,2 86,3 Ireland 32,2 38,4 41,2 45,2 44,2 36,4 Italy 396,6 420,1 425,7 484,8 428,9 370,8 Luxembourg 10,5 7,2 8,0 7,8 8,2 7,6 Netherlands 156,5 170,9 177,1 196,1 176,3 147,1 Portugal 39,9 54,6 59,6 66,4 60,1 50,7 Spain 211,5 254,0 284,7 289,3 323,9 243,2 Sweden 48,5 49,6 52,0 61,6 51,1 50,4 United Kingdom 572,3 540,4 531,5 619,5 581,8 500,8 Total UE 3133,8 3146,4 3161,9 3509,2 3381,2 2868,6 Source: AEEG, 2003.
Table 1.1 and Table 1.2 show how, with respect to the Italian trend in the achievement of Kyoto objectives, a measure such as introducing carbon taxation could have helped to reduce the increasing emission trend (for a more detailed analysis of international emission reduction policies see Paragraph 1.6 and Table 1.10 and 1.11). In particular, carbon
taxation could have been effective for its inter-sectoral character, given that its effect would have interested a number of different sectors, helping to achieve sector reduction targets fixed by the Second CIPE Deliberation. Its introduction could have been particularly useful considering the assigned maximum emission levels to each sector for the period 2008-2012, calculated as average year emissions and established in conformity with the reference scenario described in the Second CIPE Deliberation (Table 1.3). in fact, carbon taxation would have contributed to the respect of the maximum emissions levels fixed for most of energy uses, namely energy industries (electricity generation), industry, transportation, residential and tertiary sector.
Table 1.3 – Maximum emissions levels (Mt CO2 eq.)
1990 emissions Maximum GHG emission levels 2008-2012
ENERGY USES 424.9 444.5
- Energy industries: 147.4 144.4
. thermoelectric 124.9 124.1
. refinery (direct consumptions) 18 19.2
. others 4.5 1.1
- Industry 85.5 80.2
- Transportation 103.5 134.7
- Residential and tertiary 70.2 68
- Agriculture 9 9.6
- Others (fugitives, military, distribution) 9.3 7.6
NON ENERGY USES 96.1 95.6
- Industrial processes
(mineral and chemical industry) 35.9 30.4
- Agriculture 43.4 41
- Waste 13.7 7.5
- Others (solvents, fluorinated) 3.1 16.7
TOTAL 521 540.1
Source: Second CIPE Deliberation.
1.3.2 The emission trading market
EU overall greenhouse gas emissions fell in 2006 (EEA, 2008), but this drop was mainly attributable to lower CO2 emissions from households and offices due to warmer weather
and rising fuel prices, and lower nitrous oxide emissions from some chemical plants. In April 2007, the European Commission reported that carbon dioxide emissions from industrial plants in the EU emission trading scheme had risen in 2006: data from installations responsible for over 90% of emissions showed a slight increase of 1 to 1.5 percent relatively to 2005 emissions. Then, industrial emissions were still below the EU cap set for 2006 in the national allocation plans approved for the first phase of the scheme (2005-2007); also transport emissions were of particular concern since they grew
significantly in 2006. The resulting surplus in allowances adds to the growing consensus that governments were overgenerous in distributing carbon permits. In 2007, the final year of the three-year trial phase of EU carbon trading scheme, industries in the EU emission trading scheme emitted 0.8% more carbon dioxide compared with 2006 (European Commission Press Release, 23/05/2008)2. Point Carbon indicated an EU over-allocation of around 215 millions tons in the 2005-2007 first phase of the scheme. This brief overview clearly shows the relevance of a more detailed analysis of emission trading market recent trends.
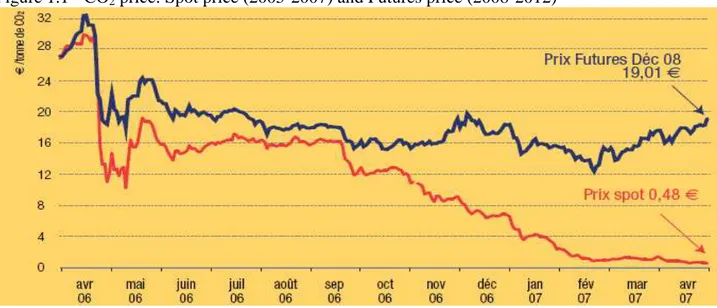
The price of carbon permits for the first phase of the European emission trading scheme fell to a new low of EUR 6.88 at the end of December 2006, probably due to the estimated surplus of 100m phase-one allowances (ENDS, 2006). Prices stayed unexpectedly high over the summer as power generators continued to buy allowances to cover future needs but after, in face of an unusually mild winter, demand in the power sector had fallen away. Meanwhile, the price for two allowances remains significantly higher than phase-one price, reflecting market expectations that supply will be restricted; more precisely it has continued to rise up to EUR 18.73 per ton. This is primarily because of the tough position being taken by the European Commission in its judgment of national allocation plans.
Figure 1.1 - CO2 price: Spot price (2005-2007) and Futures price (2008-2012)
Source: Powernext (http://www.powernext.fr)
The price of carbon permits slumped further in the first week of 2007, ending at a new record low of EUR 4.88 per ton. It has now fallen by 85% since its positive peak of April 2006. The price of carbon allowances in the first and second phases of the European
2
emission trading scheme (ETS) has fallen to new lows at the end of February 2007: first-phase allowances have collapsed to EUR 0.80 per ton, halving in less than two weeks, while allowances for the 2008-12 second phase are at EUR 12.70 per ton. In May 2007 prices amounted only to 1% of their peak level reached in April 2006.
While an explanation of the first phase price peak could be over-allocation, the reasons behind the fall in the phase two price are less obvious. Point Carbon3 cited possible reasons running from lower gas prices, reduced demand from utilities and general nervousness in the market. The allowance price nevertheless remains much higher for the second phase because allocation plans for 2008-12 foresee significantly deeper cuts in emissions. Regarding future market developments, an oversupply of carbon credits generated by carbon offset projects in developing countries could lead to a new collapse in carbon prices and hinder efforts to achieve domestic cuts in Europe. In fact, in the second phase of the emission trading market, installations will be able to buy carbon allowances on the international market through the Kyoto Protocol flexible mechanisms. The World Bank (2007) forecasts a shortage of carbon allowances of between 0.9 to 1.5 billion tons during phase two of the ETS. Despite falling prices, activity on the European carbon market is continuing to increase rapidly: the value of the global carbon market tripled in size during 2006 to reach 22 billions of Euro and volumes traded rose from 710 million tons in 2005 to 1.6 billion tons in 2006. At the same time, the International Emission Trading Association (2007) in its first “Greenhouse gas market sentiment survey” shows improving business confidence in carbon trading as an effective long-term tool to reduce emissions. As in previous years, the market was dominated by the European emission trading scheme, which accounted for over 80% of the total value. It transacted 1.1 billion tons of carbon in 2006. The market in the Kyoto Protocol’s flexible mechanisms also doubled in size, trading 450 million tons. In 2006, nearly 90 % of the Kyoto flexible mechanisms market was made up of Clean Development (CDM) projects, among which clean energy projects made up a quarter of total CDM investments in 2006. In 2007, the global carbon market more than doubled in value to 47 billion of Euro, according to the World Bank (2008). Total traded volume increased sharply to 2.9 billion tons and the EU emission trading scheme continues to dominate the market. Trades were worth 32 billion of Euro, nearly double with respect to their 2006 value.
3
With regard to the over-allocation problem (if any), different interpretations exist. Over-allocation in phase-one has been widely blamed for volatility and falls in carbon prices, which have dented the scheme’s reputation. Buchner and Ellerman (2006) assert that over-allocation may not be as pervasive as many have thought: even a generous approach concludes that 11 member states that distributed nearly three-quarters of all allowances cannot be viewed as having over-allocated. The authors also suggest that emission cuts by companies could have played a part. In particular, according to the authors, more than half of the surplus of allowances recorded in the EU carbon market in 2005 looks to have been caused by companies reducing their emissions rather than by governments having handed out too many allowances. Clearly, the evaluation of phase-one results could not be done without disentangling these factors.
According to a survey of 151 British firms (PricewaterhouseCoopers, 2007), traditional command and control measures and taxes could be more effective at delivering green improvements than instruments such as emissions trading. Even if UK pioneered the emission trading approach in Europe and it is considered one of the best implementers of the ETS, this energy policy tool turns out to be one of the least favoured among the alternative interventions strategies, with less than half of the firms interviewed agreeing on its effectiveness.
1.4 Environmental taxation in Europe
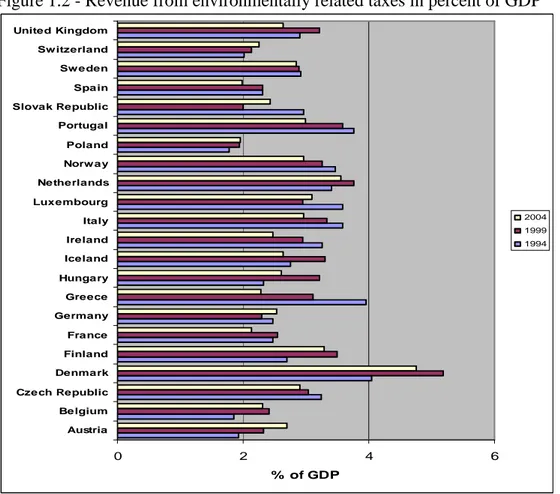
OECD (2006) confirmed that there is a high potential for governments to introduce more environmental taxes. The report recommends reducing exemptions in order to ensure taxes are environmentally effective and economically efficient. Environmental taxes and charges have been widely used in OECD countries during the last decade, but in the last few years have lost some of their allure. In the EU, for example, latest data show that in some countries they are declining as a share of GDP (Figure 1.2) and of overall taxation. The amount of revenue raised could, however, not represent a precise indicator of environmental taxes relevance: this kind of environmental policy can trigger major behavioural changes that discourage polluting activities, then it can raise decreasing amounts of revenue because the tax base diminishes.
The OECD report discusses how key obstacles to environmental taxation use could be overcome. One is the widespread fear that green taxes will hit industrial competitiveness. For this reason many environmental taxes include exemptions or refunds designed to protect certain sectors. Many of these are total or partial exemptions from energy taxes for
energy-intensive industries. As a result, the overall burden of environmental taxes falls for the most part on the transport and residential sector, reducing taxes environmental effectiveness and embedding potential regressive effects. In fact, a second key obstacle to environmental taxes is related to their potential to hit poorer households harder,issue that represents the object of my analysis.
Figure 1.2 - Revenue from environmentally related taxes in percent of GDP
0 2 4 6 Austria Belgium Czech Republic Denmark Finland France Germany Greece Hungary Iceland Ireland Italy Luxembourg Netherlands Norw ay Poland Portugal Slovak Republic Spain Sw eden Sw itzerland United Kingdom % of GDP 2004 1999 1994
Source: European Environment Agency and Oecd (http://www2.oecd.org/ecoinst/queries/index.htm).
Taxation is certainly a powerful and effective instrument that can help to achieve the EU ambitious objectives on energy and climate change at minimum costs. Collective decision-making on tax matters is difficult because it requires unanimous agreement among EU governments and for this reason it can also result in tax rates too low to be effective. Adopting green tax reforms in Europe –introducing a tax shift from labour to the environment – can succeed in realigning some economies that are still characterized by insufficient use of labour resources and excessive environmental pressure. At the end of March 2007 the European Commission has published a green paper which promotes greater use of market-based instruments, such as green taxation, to achieve EU environmental and energy goals. The paper is a joint initiative between the EU environment and tax commissioners Stavros Dimas and László Kovács. Policy areas
targeted by the green paper include energy taxation, water pricing, waste management and local air pollution. A key proposal in the green paper is the introduction of an explicit environmental element in the energy tax directive. Reactions to the paper could provide input for fresh EU legislation, in particular for Directive 2003/96/EC revision. Problems implementing the trading scheme (ETS) have bolstered the case for a parallel EU carbon tax. Already the Energy Taxation Directive (2003/96/EC) had foreseen some options according to which energy taxation could be fully or partially replaced by the emission trading market, in order to achieve environmental protection objectives or improvements in energy efficiency. In this context, some overlapping between the European ETS and energy taxation can arise. The solution to avoid this kind of problem has been to establish clearly circumscribed taxation elements, in order to ensure that there is no overlap between the two instruments with regard to purpose and scope. The EU ETS applies to emissions from certain combustion and industrial installations, represented by energy production, production and processing of ferrous materials (iron and steel production), mineralogical industry (from certain capacity threshold upwards) and other activities, such as industrial plants for the production of pulp from timber or other fibrous materials and industrial plants for paper production. Energy taxation, instead, applies to fuel uses of energy4, leaving the most energy intensive sectors (currently covered by EU ETS) outside its scope. Moreover, energy taxation does not apply to energy products used in energy production or as inputs for electricity generation. Once solved this primary issue, I want to emphasize how carbon taxation can represent a powerful instrument in order to ensure emission trading efficiency. The EU could need a carbon tax alongside its emission trading scheme to deliver the strong price signal required to achieve the 20% greenhouse gas reduction target agreed for 20205. When the scheme was introduced there was a feeling that it was going to be the only EU instrument for reducing carbon dioxide emissions; on the contrary, it now seems that other instruments can be put on its side. In particular, an EU-wide carbon tax could improve the ETS by placing a floor on the price of carbon and it could be applied to sectors, such as transport, which turn out to be difficult to include in the ETS. The European commission floated the idea of an EU-wide carbon tax as long ago as 1991: it was abandoned due to weak political support and has never been seriously revised.
4
In particular energy taxation does not apply to energy products (and electricity) used as raw materials in industrial processes.
5
This objective in European energy policy has been adopted by the European Council on 9 March 2007, on the basis of the Commission's Energy Package, e.g. the Communications: “An Energy Policy for Europe” COM(2007)1, “Limiting global climate change to 2degrees Celsius” COM(2007)2 and “Towards a European Strategic Energy Technology Plan” COM (2006)847.
1.5 A European carbon tax
An important consideration that affects national energy taxation policies is the need to maintain the country’s international competitiveness: it is problematic for a single country to change its taxation on environmental grounds if the others do not do the same (Nilsson, 1999; Zhang and Baranzini, 2004). Without international coordination, the result is represented by taxation systems where national authorities have no room for manoeuvre. On an integrated market such as the European one, some degree of harmonization constitutes a precondition for any important change in energy and environmental taxes. Introducing green taxes on a European scale is fraught with problems, not least because the Amsterdam Treaty6 requires unanimous support for the implementation of European wide tax legislation. In the past this has proved to be a huge stumbling-block, with the consequence that for a long time none of the European Commission suggestions have past the proposal stage.
In 1991 the Commission first attempted to propose a common climate protection strategy, followed in 1992 by a directive proposal aimed at introducing community-wide carbon and energy taxation (COM/92/226). This intervention was a response to the United Nations Framework Convention on Climate Change; it was supposed to take effect at the beginning of 1993, but neither it nor its amended proposal7 achieved success. The tax would have been applied ad quantum (specific tax) to the final consumption of energy; more specifically, it was structured as follows: half of the tax on crude oil, used as the reference product, was to be collected on the basis of carbon content (in order to reduce air pollution) and half on energy content (in order to improve energy efficiency). The taxes on other energy sources were to be based on unit tax components specified in this way. The rates would have increased over ten years and it would have been calculated in real terms to adjust for inflation. When the tax would have reached its maximum, the tax revenue, recycled through cuts in employers social security contributions, would have represented between 0.8 and 1.3% of GDP, depending on the country.
The potential for using energy/CO2 taxes to reduce greenhouse gas emissions was again
addressed in 1997 (COM/97/30), in reply to the lack of progress in the field of energy taxation. The draft directive rejected the carbon dioxide/energy tax model and called for a
6
The Treaty of Amsterdam was approved by the European Council on 16-17th June 1997 and signed on 2nd October 1997 by the foreign ministers of the fifteen member countries. It had as main objective to modify certain regulations of the Treaty of the European Union, the constituent treaties of the European Communities (Paris and Rome) and of some acts related to them.
7
The 1992 proposal was revised in 1995 and structured more flexibly with regard to national implementation, but made the introduction of the tax compulsory by the year 2000 at the latest.
staggered introduction of minimum tax rates on all energy products, the first coming into effect in 1998, the second in 2000 and the third in 2002. The proposed measure aimed at establishing minimum tax rates for coal, natural gas and electricity, as well as increasing minimum rates for petrol, diesel and other fuels. The twin aims of the plan were harmonizing EU energy taxation and encouraging a reduction in fossil fuels burning. Policy guidelines also specified sector and usage specific exemptions, reductions and tax refunds, and the recommendation to use the generated tax revenue to reduce distorting charges on labour. Still, the proposal had to face very hard opposition: after several revisions and amendments, it came into force in 2003. In fact, no consensus could be reached by Ministers during the previous years: the Commission proposal was firmly stuck in the Council and an alternative proposal was needed to reduce emissions whilst avoiding competitiveness issues between EU countries. Also this proposal failed due to fears of upsetting euro-skepticism in several EU countries: a similar approach to emissions reduction could have a negative political impact in many countries if not properly explained or put into context. Opposition is thought to have come from concerns about potential impacts of higher energy taxes on EU industry competitiveness. Clearly, more work was needed to assess how far increases in energy tax rates could be compensated by reductions in labour taxes to achieve fiscal neutrality at member state level. This idea is closely linked to the so-called double dividend literature, which I will review in Paragraph 2.2.
After that, the Commission modified its previous strategy to design a tax which reflect both the carbon content and the energy value of fossil fuels and promoted a different approach. The introduction of an energy tax was justified not only by environmental arguments but by matters of harmonization in the internal market. The plan to harmonize EU energy taxes - widely seen as a key policy in the fight against climate change – could not be finalized in 1999 neither, and the dossier passed on to the Portuguese presidency without any major progress. Both the Finnish and the preceding German EU presidencies strongly supported the plan, but Spain and Ireland blocked any intervention. Neither France, which succeeded Portugal as EU presidency in the second half of 2000, managed to introduce the harmonization measures.
An agreement on EU-wide minimum energy tax levels was then scheduled to be reached by the end of 2002; but conflicting demands from a number of countries caused a series of postponements. Italy emerged as the final hurdle to overcome, as it blocked the agreement on the grounds that it would harm its hauliers competitiveness. The problem seemed to be
solved in July 2002 when Italy was praised by the Commission for putting its weight behind a proposed directive to harmonize excise taxes for commercial diesel fuel; even so in March 2003 EU finance ministers failed once again to reach a political agreement on a common energy taxation framework. This time, the delay in agreeing the proposal was caused by Austrian objections to providing exemptions for energy-intensive industries. In October 2003 the agreement on the text of a directive was finally achieved. A draft opinion on the directive by Finnish Member of European Parliament (MEP) Anneli Korhola had already been voted by the European Parliament’s environment committee in March 2003. MEPs passed several amendments widening the scope of the directive to all professional vehicles, moving more quickly towards aligning excise taxes on petrol and diesel, and introducing EU-wide taxation of carbon dioxide emissions. The “Directive restructuring the Community framework for the taxation of energy products and electricity” replaced, in part or in whole, its 1992 predecessor dealing just with mineral oils. Both directives set minimum rates for national taxes on specified products. The Directive 2003/96/EC broadens the scope of EC minimum tax rates beyond mineral oils to cover all energy products, including natural gas and solid fuels (coal, peat, lignite), as well as electricity. It is based on a system of minimum excise rates, specific for every individual fuel and energy type, and not of itself introduces a community energy or carbon tax. The directive had to be transposed by Member States by 2005; even if the agreement provided relief for what were difficult negotiations, it is worth emphasizing that excise taxes fixed by the directive were smaller than the national average, as can be checked from Table 1.4.