POLITECNICO DI MILANO
DIPARTAMENTO DI MECCANICA
PhD Course on Mechanical Engineering – XXVII Cycle
2012-2014
A Method for Forecasting Design Requirements
Based on Experts’ Knowledge and Logistic Growth
Model.
Candidate:
Christopher Nikulin Chandia
Mat. 785636
Supervisor:
Prof. Gaetano Cascini
Tutor:
Prof. Quirico Semeraro
PhD. Coordinator:
Table of content
3
Table of Content:
[1] Introduction ... 10
[2] State of the Art ... 15
2.1 The Product Design and Development Process ... 16
2.1.1 Design specification and requirements for product and process ... 19
2.1.2 Role of knowledge during the early design process phase ... 20
2.2 Technology forecasting ... 25
2.2.1 Forecasting methods and related characterization ... 27
2.2.2 Elements for a structured and systematic forecasting analysis ... 33
2.2.3 Role of forecasting software tools in the forecasting analysis ... 34
2.3 Conclusions of the state of art ... 38
2.4 Hypothesis and research questions ... 39
[3] Methodological proposal and research contribution ... 41
3.1 Overall goal of the activity ... 42
3.2 Definition of a reference framework for a method for forecasting design requirements ... 44
3.2.1 Definition of a reference framework for organizing knowledge according to the time dynamics and system hierarchy ... 45
3.2.2 Definition of a reference framework for capturing qualitative and quantitative knowledge about design requirements ... 47
3.2.3 Definition of a reference framework for regression analysis to forecast quantitative requirements evolution ... 50
3.3 A new software tool to support regression analysis based ... 55
3.4 Step by Step Method for Forecasting design requirements ... 61
3.4.1 Elicitation of requirements at system, sub-system and super-system level (STEP-1 and STEP-2) ... 64
3.4.1.1 STEP-1: Elicitation of requirements at system and sub-system level. ... 64
3.4.1.2 STEP-2: Elicitation of requirements at super-system level. ... 66
3.4.2 Identifying how were the requirements in the past (STEP-3) ... 68
3.4.3 Quantitative requirements and regression analysis (STEP-4)... 69
3.4.4 Envision of the requirements at system level and cross-check value at system and sub and super system levels (STEP-5, STEP-6 and STEP-7) ... 74
3.4.4.1 STEP-5: Envision of the requirements at system level. ... 78
3.4.4.2 STEP-6: Cross-check value and requirements envision at system and super-system level. ... 79
3.4.4.3 STEP-7: Cross-check value and requirements envision at system and sub-system level. ... 80
[4] Application of the proposed method for forecasting design requirements, cases studies and tests ... 81
4.1 Case study in the context of FORMAT Project: Vacuum forming case study ... 83
4.1.1 Elicitation of requirements at system, sub-system and super-system (STEP-1 and STEP-2) ... 84
4.1.2 Identifying how were the requirements in the past (STEP-3) ... 87
4.1.3 Quantitative requirements and regression analysis (STEP-4)... 87
4.1.4 Envision of the requirements at system level and cross-check value at system and sub and super system levels (STEP-5, STEP-6 and STEP-7) ... 91
4.1.5 Results: Vacuum Forming case study ... 93
Table of content
4
4.2 Case study in the context of cluster mining project: mining mill ... 95
4.2.1 Chilean Mining industry and the need for forecasting... 96
4.2.2 Elicitation of requirements at system, sub-system and super-system (STEP-1 and STEP-2) ... 98
4.2.3 Identifying how were the requirements in the past (STEP-3) ... 100
4.2.4 Quantitative requirements and regression analysis (STEP-4)... 100
4.2.5 Envision of the requirements at system level and cross-check value at system and sub and super system levels (STEP-5, STEP-6 and STEP-7) ... 103
4.2.6 Results: Mining mill case study ... 105
4.2.7 Discussions and conclusions: Mining mill case study ... 106
4.3 Application of the method and test experiment with students ... 107
4.3.1 Preparation of a Case study for academic purposes (Washing Machine) ... 107
4.3.1.1 Preparation of a Requirements list at system, sub-system and super-system level (STEP -1 and STEP-2) ... 108
4.3.1.2 Identifying how were the requirements in the past (STEP-3) ... 109
4.3.1.3 Quantitative requirements and regression analysis (STEP-4) ... 111
4.3.1.4 Envision of the requirements at system level and cross-check value at system and sub and super system levels (STEP-5, STEP-6 and STEP-7) ... 117
4.3.1.5 Results: Washing machine case study ... 119
4.3.1.6 Discussions and conclusions: Washing machine case study ... 119
4.3.2 Testing of the method and software tool to forecast design requirements ... 121
4.3.2.1 Participants of the testing activity ... 121
4.3.2.2 Test: Control group test ... 122
4.3.2.3 Group B: Additional analysis ... 131
4.3.2.4 Test: Analysis for the group B by using NASA task load Index ... 135
[5] Discussions and Conclusions ... 140
5.1 Summary of Activities... 141
5.2 Achievement of the objectives ... 143
5.3 Limits of the proposed method ... 145
5.4 Potential applications ... 146
[6] References ... 147
[7] Appendix ... 160
7.1 Appendix A - Test comparison between different software tools and logistic growth curve equations ... 161
7.1.1 Part A: Comparison among different software tools ... 161
7.1.2 Part A: Results ... 162
7.1.3 Part A: Discussion and Conclusions ... 164
7.1.4 Part B: Comparison among different logistic growth curves ... 165
7.1.5 Part B: Results ... 165
7.1.6 Part B: Discussion and Conclusions ... 166
Appendix B - Classification of logistic growth papers from Technological Forecasting and Social Changes Journal. ... 167
7.2 Appendix C- Requirements list vacuum forming case study ... 171
7.3 Appendix D - Requirements list of mining mill case study ... 173
7.4 Appendix E - Requirements list of washing machine case study ... 174
7.5 Appendix F – Test with students (Data and information) ... 175
7.5.1 Application of a method for forecasting: Case study of Washing Machine ... 175
7.6 Appendix G - Questionnaire for both Groups A and B ... 176
Table of content
5
7.6.2 Section: Evaluation of the test activities ... 176
7.7 Part H – Questionnaire about the proposed method and models (Only for group-B with the method) ... 178
7.7.1 Method for forecasting requirements (test form) ... 178
7.7.2 Section: Evaluation of model and tool (Only for Group-B) ... 181
7.7.3 Section: Quality of results with Method (extra questions) ... 182
7.7.4 Section: NASA task load questionnaire (Only for group-B with the method) ... 182
7.7.5 Data Sheet: Student test (Group-A) ... 184
7.7.6 Data Sheet: Student test (Group-B) ... 185
7.8 Part I - FORMAT prototype (Description and user manual) ... 186
7.8.1 Description of features of the FORMAT-prototype ... 187
7.8.1.1 Commands to call and view data ... 187
7.8.1.2 Regression analysis and graphic results ... 188
7.8.1.3 Statistics indicators and messages ... 189
7.8.1.4 Basic control graphics ... 191
7.8.1.5 Save project and comparison with different projects ... 192
7.9 Part J – Vector Error-Correction model ... 193
List of figures
6
List of Figures:
Figure 1: The phases describing the systematic Product Development Process according to Pahl et al. (2007). ... 18 Figure 2: Sources of information and knowledge along the different phases of the design process
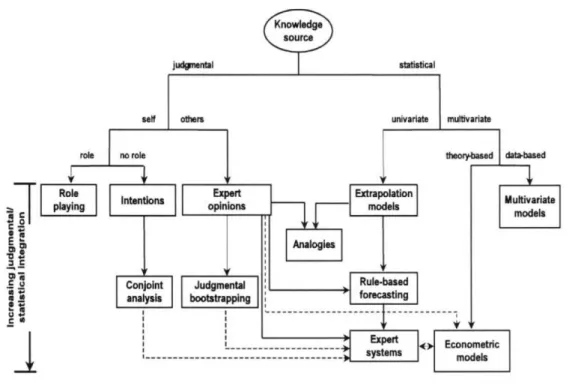
according to Allen et al. (2002). ... 21 Figure 3: Characteristics of the forecasting methods and their relationships according to Armstrong
(2002). ... 31 Figure 4: Elements of a structured and forecasting analysis proposed by Martino (1993), ordered as
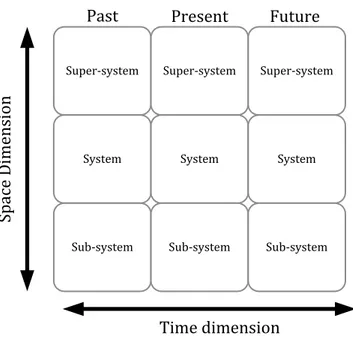
sequential phases to follow. ... 33 Figure 5: The System Operator; the most common schema to stimulate an effective way of thinking
(Altshuller, 1984)... 46 Figure 6: Graphical description of Meyer's logistic growth curve and its equations. ... 52 Figure 7: User interface of a new software tool to support regression analysis based on logistic
growth curve, in specific for those with lack of statistical knowledge as design engineers ... 60 Figure 8: Description of the method’s steps and their relation with the stages proposed by Martino
(1993). ... 61 Figure 9: Management of knowledge for design requirements in the framework of the system
operator. Circled numbers refer to the steps of the procedure of the method, and the arrow represents the direction of movement from one screen to the other. ... 62 Figure 10: Diagram used for STEP-1 related the System Operator model and the logic to elicit
design requirements at system and sub-system... 66 Figure 11: Diagram used for STEP-2 related to the System Operator model and the logic to identify
design requirements at super-system. It can also be used at system and sub-system if it is necessary to elicit new requirements. ... 67 Figure 12: Diagram used for STEP-3 related to the System Operator model and diagram to support
the requirements estimation process in the past. ... 69 Figure 13: System Operator screen and the requirements classification according to the proposed
classes. Future SO-screen is in dotted line as initial envisioning knowledge projections. ... 71 Figure 14: Graphic representation of performances based on the combination of the behaviour of
requirements; Left-side describes requirements behaviours from System Operator screens, the right-side represents the expected trend of combining them; requirements with “fluctuating” behaviour were excluded from the proposal given the uncertainty of the behaviour of the performance delivered. ... 73 Figure 15: Schemes used in STEP-5, STEP-6 and STEP-7 show the System Operator model and the
logic to envision requirements by considering both quantitative and qualitative interpretations. ... 75 Figure 16: Diagram for the interpretation and envisioning for quantitative requirements or
performances (quantitative projections). ... 76 Figure 17: Diagram for the interpretation and envisioning for qualitative requirements or
performances (qualitative projections). In this case the dotted lines are used to illustrate the direction of change, but not necessarily mean that this direction will be linear... 77 Figure 18: Organization of the chapter and related activities; black arrows are activities directly
related to the validation criteria and doted arrows are activities partially related to the validation of the criteria. ... 82
List of figures
7
Figure 19: The dynamic of the case study within the FORMAT-project... 83
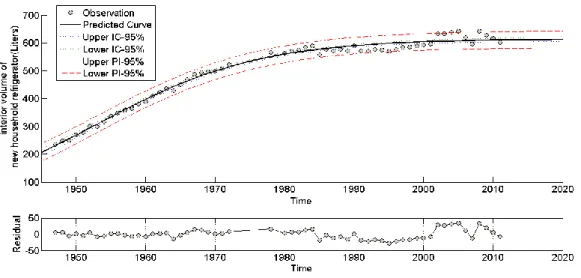
Figure 20: Average of interior volume of new household refrigerator; Data source: Association of Home Appliance Manufactures (AHAM) and Appliance Standards Awareness Project (ASAP). .. 88
Figure 21: Created performance for refrigerator (Effective volume/Energy consumption); Data source: Association of Home Appliance Manufactures (AHAM) and Appliance Standards Awareness Project (ASAP). ... 90
Figure 22: The dynamic of the case study within the Cluster Mining project. ... 96
Figure 23: World copper production; Data source: USGS mineral information and cooper worldwide. ... 101
Figure 24: Mining mill volume trend based on bi-logistic growth model. Data source: Mining Magazine (2014) ... 102
Figure 25: Mining mill volume represented by two simple logistic growth curves... 103
Figure 26: Average load capacity of washing machine per year; Data source: Energy California Commission(2014). ... 112
Figure 27: Relative percentage of European Market growth for washing machine since 1990. Data source: Eurostat... 113
Figure 28: Performance created by the average load capacity of washing machine and average energy consumption per year; Data source: Energy California Commission (2014). ... 114
Figure 29: Performance created by the average capacity of washing machine and average of water factor per year; Data source: Energy California Commission. ... 116
Figure 30: Description of the control group test through an IDEF0 representation ... 123
Figure 31: Summary of students’ choice of software tools to carry out the regression analysis. ... 126
Figure 32: Summary of students’ evaluations of software tool to support the interpretation of the regression outcomes. ... 127
Figure 33: Summary of the students’ evaluations upon the usefulness of logistic growth curve to support the regression analysis. ... 128
Figure 34: Summary of students’ evaluations with the proposed method for the organization of requirements by using System Operator and recommendations for the regression analysis (exploitation of the logistic growth model). ... 132
Figure 35: Summary of students’ evaluations upon the proposed method(test form). ... 133
Figure 36: Overall workload index according to the different tasks developed during the students’ test. ... 137
Figure 37: Method’s step to understand the dynamics of the design requirements (test form). ... 178
Figure 38: Logistic growth description and stages for test with students. ... 180
Figure 39: FORMAT-prototype and related features. ... 186
Figure 40: Commands to open excel files with data. ... 187
Figure 41: Commands to modify data form user’ panel. ... 188
Figure 42: Commands for fit data, select analysis and graphs. ... 189
Figure 43: Table with statistical information about the regression. ... 190
Figure 44: Messages and colour boxes to support users about statistics information. ... 191
Figure 45: Additional commands for graph and curves visualization. ... 192
Figure 46: Commands to save and compare projects. ... 193
Figure 47: Graphical representation of the forecast based on vector error-correction model. ... 193
List of tables
8
List of Tables:
Table 1: Forecasting families and related methods according to TFAWG (2004). ... 28 Table 2: Number of methods extracted by different authors in the forecasting field (FORMAT
deliverable, 2013). ... 32 Table 3: Software tools that can be used to develop a regression analysis with a forecasting
purpose. ... 37 Table 4: Definition of requirements based on enriched ENV logic by considering time perspective
approach. ... 49 Table 5: Classification used in order to address the formalization of knowledge from technological
forecasting to engineering-design field, papers between 2008-2013. ... 54 Table 6: Summary (partial) features required to support design engineers during the regression
analysis based on logistic growth curve. Colour represents the current fulfilment of the features; Red-not satisfied, Yellow-partially satisfied and Green-satisfied. ... 58 Table 7: Requirements list of vacuum forming organized according to system operator framework
after the chunking process. ... 86 Table 8: Statistic results for regression analysis for refrigerator volume. ... 89 Table 9: Statistic results for created performance index (volume refrigerator/energy consumption) ... 90 Table 10: System Operator (future screens) envision according to the different requirements and
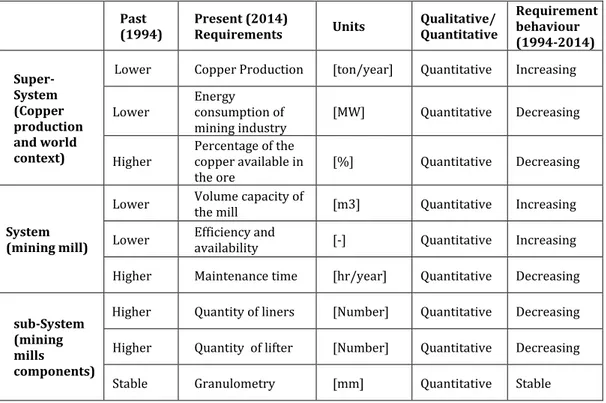
their relations for vacuum forming case study. ... 92 Table 11: Requirements list of mining mill organized according to system operator framework after
the chunking process. ... 99 Table 12: Statistical results for regression analysis of world copper production ... 101 Table 13: Statistical results for volume of mining mill under assumption of bi-logistic growth curve. ... 102 Table 14: System Operator (future screens) envision according to the different requirements and
their relations for mining mill case study. ... 104 Table 15: Requirements list of washing machine organized according to system operator
framework after the chunking process. ... 109 Table 16: Additional economic parameters used to exploit the data available for the washing
machine case study. ... 110 Table 17: Additional requirements used to exploit the available data sources for the washing
machine case study. ... 110 Table 18: Statistic results for regression analysis for average load capacity of washing machine. . 112 Table 19: Statistic results for regression analysis for European Market. ... 113 Table 20: Statistic results for regression analysis for created performance (load capacity of washing
machine/energy consumption) ... 115 Table 21: Statistic results for regression analysis for created performance (load capacity of washing
machine/water factor) ... 116 Table 22: System Operator (future screens) envision according to the different requirements and
their relations for washing machine case study. ... 118 Table 23: Summary of the students’ evaluations about forecasting analysis and their perception of
usefulness to bring new insight about the product. (Green box = positive evaluation; red box = negative evaluation) ... 124
List of tables
9
Table 24: Summary of the number of students in percentage whom have developed the activitiesaccording to Martino’s elements ... 125
Table 25: Statistic by using 2T-test for students’ evaluations upon software usability ... 128
Table 26: Statistic by using 2T-test for students’ evaluations upon usefulness of logistic growth curve. ... 129
Table 27: Statistic by using 2T-test for students’ evaluations about System Operator and Regression analysis (logistic growth curve). ... 133
Table 28: Summary of students’ evaluations according to the methods' outcome and efforts needed. (Green box = positive evaluation; red box = negative evaluation) ... 134
Table 29: Evaluation of different method’s tasks based on NASA task load Index; Scale from 1 to 7. ... 136
Table 30: Descriptive statistic of the student’s evaluation by each task according to NASA task load index. ... 137
Table 31: Description of experimental test among different software tools which are capable to develop a logistic growth curve analysis. ... 162
Table 32: Experimental test to compare different software tools. ... 163
Table 33: Results of Matlab application with Confidence Interval. ... 164
Table 34: Two of the most common logistic growth curve applied in literature ... 165
Table 35: Comparison among two logistic growth equations applied in literature and software tools. ... 166
Table 36: Classification of papers with application of logistic growth models from Technological Forecasting and Social Changes journal (Papers from 2008 until December 2013). ... 167
Table 37: requirements list of vacuum forming case study ... 171
Table 38: requirements list of mining mill case study. ... 173
Table 39: requirements list of the washing machine case study ... 174
Table 40: Description of the requirements and parameters for washing machine (test). ... 175
Table 41: NASA task load (answer table) ... 182
Table 42: Data sheet, student test (Group-A) ... 184
Chapter 1: Introduction
10
Chapter 1
[1] Introduction
Chapter 1: Introduction
11
The rate of technological innovation increased considerably in the last years. This situation forced companies to quickly adapt their organization, processes and products to better answer the emerging demands from the society. In such a continuous fight to survive the market competition, companies need to anticipate the main features of future products and related manufacturing processes as essential mechanisms to keep their market position, competitiveness, and moreover to support the innovation process. Consequently, companies that were once dominant but failed to anticipate the appropriate information have discovered their vulnerability to the changes (Christensen, 2013; Roper et al., 2011). According to Roper et al. (2011), some changes that can affect companies emerge from technology development, market directions, while others will arise from social changes and related political decisions. Christensen (2013) highlighted that the strengths that make an organization successful could become obstacles if it is not prepared to new changes, as for example, the inability to quickly and smoothly adapt organization skills.From system engineering viewpoint, the rate of changes is increasing for both products and processes, essentially motivated by improvements to better satisfy the different customer’s requirements. On the one hand, changes for product and process should fulfill requirements emerged from market needs (Regnell et al., 1998). On the other hand, it should also deal with company’s requirements (i.e. reduce resource consumption and cost). In this dynamic scenario, the constant evolution of products and processes create emerging and non-obvious problems challenging those who conceptualize, develop and implement the new solutions known as design engineers i.e multiple engineering disciplines as mechanical, designer, electric engineers and others (Robinson et al., 2005). Frequently, design engineers address at the conception of a new product by using product design phases (Cross, 2008). These phases allow to keep controlled and organized the design engineering tasks and related activities. Among the different phases, the early design phases are considered the most critical and relevant for the product development (Nguyen et al., 2012). The early design process phases aim at defining and extracting the different requirements of a product or process (Eppinger et al., 1994). Furthermore, a poor definition of requirements during its early phases can dramatically influence the results of the latter phases, causing several losses in terms of effort and time for companies. Consequently, design engineers need to properly understand the company and customers’ requirements to provide solutions that can be developed and implemented, but not only considering a day-by-day perspective, but also a long-term perspective (Cascini, 2013). Moreover, design engineers should anticipate information about product and process requirements to exploit as much as possible their experience and knowledge to address emerging problems and changes. Indeed, the anticipation of information about requirements during the early design process phases should aim at: First, support company’s decision makers, as for example R&D managers or CEO; Second, exploit the knowledge of design engineers in order to better accomplish the later design process phases.
Chapter 1: Introduction
12
In this scenario, the definition of reliable practices and supporting tools having an anticipatory perspective allows at driving with better effectiveness and efficiency the decision making processes. In practice, the process for the anticipation of information is known as forecasting. The forecasting methods are used to anticipate information about future and mainly applied by those who have to assign rights to make decisions, as for example, economists and managers. The results reported by the application of a forecasting method allow deciding on investments for making and implementing good decisions and implement ways to evaluate the business results (Lawrence & Klimberg, 2009). Indeed, the forecasting results and their synthesis provide strategic directions for the decision makers to follow, which support them to effectively manage the companies’ resources.From technology viewpoint, the anticipation of information about how a technology will change and what features will characterize the next generation of products or services is known as technology forecasting (TF). The Technology future analysis working group (2004) highlighted that TF can be defined as a systematic processes that aims at producing valuable predictions for “describing the emergence, performance, features or impacts of a technology at some time in the future” However, even from a technology standpoint TF remains being closer to economists and managers than to those who are facing and solving the emerging problems as design engineers. In some research domains as economic and statistic have been created and developed different complex models of extrapolation and prediction, however, TF is much more than that. Certainly, TF should use quantitative regression, but also has to support at creating reasonable views of the future and bringing new knowledge to users and beneficiaries (Kucharavy and De Guio, 2008).
A relevant research goal in the engineering design domain is the definition and identification of suitable methods and tools to anticipate main features of products and processes, which have to be capable of driving with more efficiency the design process and also support decision makers about technology. This mentioned need is pushing design engineers for looking methods, models, and tools to better answer emerging demands and changes by exploring Technology Forecasting (TF) methods. However, this field of research is in an initial stage (Cascini, 2013).
In this scenario, a current research opportunity in the design domain is emerged at understanding which forecasting methods, techniques and tools can be suitable introduced at general design process. In specific, which are the forecasting methods suitable to be used and adopted by design engineers, by taking into account their skills, knowledge and background. So this PhD thesis attempts to exploit this research opportunity.
Accepting the hypothesis that early design phases are critical stages for the product development process, and forecasting methods are useful to anticipate relevant information about requirements to support the design
Chapter 1: Introduction
13
process and decision makers about technology. Therefore, the main research question is the following:o How to systematically anticipate information about requirements during the early design process stage?
This research question can be further split in three sub-questions that will be faced in the present doctoral dissertation:
o How a design engineer can be guided into use forecasting methods in order to anticipate information about product and process?
o How a method for forecasting can be introduced systematically into the product development process?
o Which is the industrial and academic applicability of a method for forecasting in the design domain?
In order to answer these questions, the present thesis is divided in four chapters. Chapter one presents the state of the art of this research considering two viewpoints. From a design engineer perspective, the state of the art introduces a brief description of different product development processes to understand the common phases, which characterize a general design process. These descriptions clarify why the anticipation of information, particularly for requirements, is crucial at early design phase. From forecasting viewpoint, the state of the art presents particular attention in the definition about what technology forecasting really means in order to harmonize the common knowledge from literature. The different forecasting methods and related classifications are described as well. The last section presents the role of software tools to support the forecasting analysis, with specific attention to those users without experiences in forecasting.
Chapter two presents the original contribution of the present research. The first contribution of this research is the formalization of knowledge among different domains. However, the major contribution of the present research is the consequent introduction of a method for forecasting design requirements usable by design engineers without previous experience in forecasting. This chapter has been structured in three sections.
First, a formalization of the semantic of the requirements. This will allow keeping a structured and systematic description of the requirements during the elicitation process, simplifying the transfer of knowledge.
Second, a formalization of forecasting methods compatible with design engineers’ knowledge is provided. Furthermore, this subsection will linger on the background useful to understand the main traits in the application of the adopted forecasting techniques and models for this research. This section will offer a frame useful to synthesize and create recommendations for design
Chapter 1: Introduction
14
engineers bringing the knowledge from forecasting experts to the design users. Finally, in the last section, a method for forecasting design requirements is proposed as the main contribution of this research capable to support design engineers to anticipate information about design requirements; moreover, it can be useful to drive R&D strategies and related investment.
Chapter three presents the results of this research by considering both applications, from an industrial and an academic perspective. From an industrial perspective, some research results are obtained based on the real application of the proposed method for products and processes, which allows understanding the benefits and limitations of the method proposal. From an academic perspective, tests to students were developed to understand and observe the learning process related to the proposed method and also to get new insights that the method provides through the test's participants. At the end of the section 4 three main validation criteria are described. Those criteria are used to validate the current research, and are based on:
A. Theoretical structural validity (Pedersen et al., 2000): i. Individual constructs constituting the method.
ii. Internal consistency of the way the constructs are put together in the method.
B. Empirical performance validity (Pedersen et al., 2000):
i. Capability to clarify the directions for product and process development and driving related strategic decisions.
C. Capability of the method to guide the design engineers without experience in forecasting:
i. Usability of the time perspective to forecast requirements. ii. Capability of the method to provide new insights and
conclusions about product/process requirements.
iii. Effectiveness of the method to be transferable to design engineers independently from the adopted product development process.
Finally, the conclusions and further development section is presented as the fifth and last one. The outcomes of this research activity are discussed, highlighting to what extent the objectives have been satisfied, which limits have emerged during the application and testing phase, as well as the further opportunities originated from these activities.
Chapter 2: State of the art
15
Chapter 2
[2] State of the Art
Chapter 2: State of the art
16
This chapter defines the context on which the whole research focuses. Furthermore, this chapter presents some considerations about the limitations emerged from the state of the art analysis in the different science domains.In the first section, a brief description of the design phases and related features is presented, together with an overview of Product Development Process (PDP). Moreover, this section describes the need of anticipating the requirement information during the early design phases. The second section introduces briefly what technological forecasting (TF) means, as well as an overview of current TF methods available on literature. In the third section is presented the conclusion of the state of the art analysis. Finally, the hypothesis and research questions are presented as well, which will be addressed through the development of this PhD dissertation.
2.1 The Product Design and Development Process
This section introduces a set of different Product Development Process (PDP) as initial understanding about how time-perspective approaches (i.e. anticipation of information) should be introduced into the design process. The different PDP are presented with a general description of their essential design phases, which are required to develop a product. Furthermore, this section defines the phases and features among different PDP, allowing to understand common knowledge of design engineers.
From the perspective of a design engineer, Cross (2008), carried out a meaningful review of different available approaches for product design. According to his analysis, it is possible to resume the different activities performed by designers during the PDP in four different phases: Exploration, generation, evaluation, and communication. These phases are organized in sequences, and iterations and loops are allowed and expected according to the heuristic of the design process. Also the model proposed by French (1985) is articulated into four phases: Analysis of the problem, conceptual design, embodiment of schemes and detailing. By comparing both the mentioned models, it is clear that every time a design proposal is developed, it requires the generation of solution concepts in order to address a need. Jones (1984), focuses on the same phases, although articulating those concepts in only three steps: Analysis, Synthesis and Evaluation, even if they plainly have a similar meaning to what Cross (2008) has proposed. The objective of these phases is more structured and systematic analysis, as it can be understood from the work proposed on Becattini (2013), where the Analysis stage prescribes to list all the requirements in order to produce a meaningful and complete design specification. During the stage of synthesis, each characteristic of the design specification is singularly addressed to devise solution concepts. The evaluation phase, in turn, specifies that the decision on the final design proposal
Chapter 2: State of the art
17
must be taken into account by considering the capability of the design concepts to match the various requirements.In this context, it is important to note how Pahl et al. (2007) improved the characterization of the design process by prescriptive models for design, identifying four phases along the PDP (Figure 1). In particular, in Pahl’s model, the Clarification of Task and Plan phase collects information about the requirements to be embodied in the solution and also about constraints. Conceptual Design establishes function structures, searches for suitable solution principles, and combines these elements into concept variants. In the phase of Embodiment Design, starting from the concept the designer determines the layout and forms to create a technical product or system in accordance to technical and economic considerations. Finally, Detail Design describes the arrangement of form, dimensions, and surface properties of all the individual parts laid down, together with the materials specified, technical and economic feasibility re-checked; all drawings and other production documents as well
.
With a similar logic, Ulrich and Eppinger (2012), proposed a PDP based on six phases: i) Planning, ii) Concept Development, iii) System-Level Design, iv) Detail Design, v) Testing and Refinement, vi) Production Ramp-Up.Baldussu (2014) noted how apart from the differences in the third phase’s names, these two approaches, Pahl et al. (2007) and Ulrich & Eppinger(2011), share a common perspective for at least the first 4 steps. Moreover, Baldussu (2014) pointed out how most of the times companies specifically develop their own PDP approach, often as an adaptation of one of the standard approaches listed so far (e.g. Cross, 2008; Pahl et al., 2007; Ulrich and Eppinger, 2011). In fact, examples of PDP proposed by Pahl et al. (2007) and Ulrich and Eppinger (2011), are mostly diffused in industries and thought at universities. One common feature among them was observed by comparing all these above-mentioned approaches. All the mentioned PDP models start with an analytical phase to understand the problems to address and the requirements that should be met to obtain a valuable solution.
From this state of the art, it is important to note that requirements analysis seems to be a common step among different PDP models. Therefore, requirements analysis is an essential as well as an elementary step, and it deserves to be a central issue in the design research (Chakrabarti, 1994). Consequently, it is important to note that design engineers have to understand company’s and customers’ requirements to provide solutions that can be developed and implemented, but not only considering a day-by-day perspective, but also a long-term perspective (Cascini, 2013).
Consequently, a research proposal that considers a time-perspective approach has to be introduced at an early design phase, allowing design engineers to bring new knowledge about future of product and process. As a consequence, this research is going to focus the attention on the analysis of design requirements and
Chapter 2: State of the art
18
their potential evolution for both product and process. The following subsection allows at understanding how design engineers deal with design requirements in practice.Figure 1: The phases describing the systematic Product Development Process according to Pahl et al. (2007).
Chapter 2: State of the art
19
2.1.1 Design specification and requirements for product and processThis subsection presents a literature review about the management of requirements during the early design process, with deep attention on the elicitation of requirements. The PDP model developed by Pahl et al. (2007), in specific the first phase model, has been adopted as the reference model for this subsection
According to Pahl et al. (2007), the task clarification phase is characterized by activities which help to identify, collect, transform into a suitable form, and store the requirements and associated information that the design must satisfy to be used during subsequent design phases. The goal of this phase is, basically, to identify and transform information residing in the assignment and other associated documentation into the designer’s own language. At the same time, the definition of the design specification is a task that requires designers to formalize their or others’ knowledge in order to make it manageable, understandable and, most of all, usable to drive the whole product development process with criteria for supporting both the exploration of new solutions and their evaluation (Cross, 2008). Indeed, the satisfaction of requirements influences the decision-making process for both the choice of best alternatives and the search of new solutions. However, it is important to clarify what requirement means, for instance, IEEE’s (1998) defines requirements as:
“A statement that identifies a product or process operational, functional, or design characteristic or constraint, which is unambiguous, testable or measurable, and necessary for product or process acceptability” (by consumers or internal quality assurance guidelines)(IEEE, 1998)
The definition, organization, and management of the system's requirements are challenging especially for those situations characterized by high complexity. The NASA Systems Engineering Handbook (Kapurch, 2010) and the INCOSE textbook are two examples of Systems Engineering approaches for the management of a complex system development. Both of these texts show that the identification of requirements is as relevant as their proper management in appropriate clusters, which are organized hierarchically.
From the Systems Engineering perspective, Bijan et al. (2013) has reviewed the state of the art concerning approaches dealing with system requirements. They characterized them by similarity, considering three relevant categories. A first category focuses on facilitation methods and approaches, collecting those that aim at understanding and acquiring customers' needs (e.g.: Use Cases, QFD, and The Five Whys). Another category concerns the prioritization methods that collect approaches like the Analytic Hierarchy Process (AHP) in order to distinguish requirements according to their importance for customers along the product development process. The third category, the transformation of requirements, in
Chapter 2: State of the art
20
turn, considers approaches whose purposes are to switch data, information, and knowledge into requirements after the application of facilitation techniques. Moreover, Bijan and colleagues also add a further category of approaches (i.e. “standalone”), for which a common characterization is not viable.It is interesting to note that, despite the already mentioned approaches, the majority of those methods were built in order to support the definition of hierarchical relationships between systems and subsystems. The Agile manifesto (Beck, 2001) is the only alternative which allows considering requirements as dynamically changeable during the development process, due to the active presence of the customers as participants to the designing activities. However, it is important to mention that none of the cited approaches addresses at the understanding of the dynamics of requirements of a product beyond the product development process, on a longer time perspective.
However, what emerges from the above-presented analysis of the state of the art, as well as from the mentioned textbooks by NASA and INCOSE, confirms that the importance of knowledge is an essential element of the system development to clearly define targets and objectives so as to drive and check what is generated during the design process. Consequently, this research proposal aims at understanding how to exploit the knowledge design engineers by using time-perspective approach to support the design process.
2.1.2 Role of knowledge during the early design process phase
From the design perspective, the definition of requirements is a cognitive process that deals with the transformation of tacit into explicit knowledge (knowledge externalization). The definition of requirements is one of the most critical cognitive processes to be carried out (Civi, 2000), especially because it is necessary to state in advance what to capture during such knowledge formalization (Hicks et al., 2002). In other words, it is necessary to consider both the sources of knowledge and the content to be formalized inside the design specification. However, it is important to understand which source of knowledge, information, and data are plausible to exploit during the product development. According to Rowley (2007) Data is an unorganized and unprocessed set of discrete units that collects objective facts or observation whose meaning is null until it is not considered within an appropriate context. Information, in turn, collects processed and organized data that is meaningful and relevant within the context in which it has been considered or examined. Finally, Knowledge pertains to the individuals and several processes can breed it, such as the synthesis of multiple sources of information over time as well as study, learning, and experiences. For what concerns the sources of knowledge that may play a relevant role in the design processes, Allen and colleagues (2000) presented a classification
Chapter 2: State of the art
21
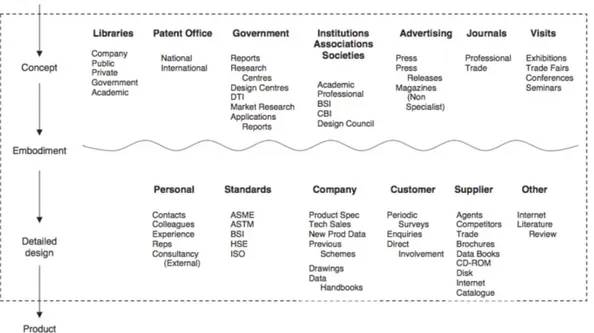
of the different sources of knowledge, both explicit (e.g. libraries, patent offices, advertising, journals, standards, etc.) and tacit (e.g. customers, suppliers, colleagues, in a single word, the stakeholders)(Figure 2). In particular, while the formers require, in case, the interpretation of what is already made explicit, the latters are those sources for which the externalization becomes relevant (Becattini, 2013).Figure 2: Sources of information and knowledge along the different phases of the design process according to Allen et al. (2002).
The stakeholders of a product, a process, or a service (i.e., something that has been somehow designed) are defined as those “who will have an interest in the system throughout its entire life cycle” (Haskins et al., 2006) or “The organization or individual who has requested the product(s) and those who are affected by or are in some way accountable for the product’s outcome” (Kapurch, 2010).
The second definition is also followed by the distinction of stakeholders in customers and its category. The definition of customers is uniform in literature. Customers are those who can be considered as the final beneficiaries of the design outcome. What vary in literature are the categories to be included into the customers. Some authors include designers and engineers (Kapurch, 2010); some others are mostly focusing on the final beneficiaries of mass products (Bijan et al., 2013). From the systems engineering perspective, however, this is perfectly consistent, showing the need of developing instruments which are sufficiently versatile to address the different stakes, whatever is the source they come from.
Considering customers as the first beneficiaries of products (e.g. the purchasers of goods) their opinion about needs, expectations and, eventually, requirements is the content to be considered crucial for a successful design process (Clausing,
Chapter 2: State of the art
22
1994). The so-called “Voice of the Customer” (VoC) plays a relevant role whether the product development process is carried out for the customer (customer outside the design process), with the customer (co-design with the customer as a solution evaluator) or by the customer (co-design with the customer as a solution generator) (Kaulio, 1998). Questionnaires capture the VoC and design experts formulate questions according to customers' requirements defined in advance. Several approaches are available to support the formulation of questions such as, for example, the “quality dimension development process” (Hayes, 2008) and the “critical incident approach” (Flanagan, 1954). Considering a long time perspective, it is worth mentioning that the people involved in these surveys are usually asked to express their opinions about the experiences they already have had with existing products, or after the interaction with already developed prototypes in one of their common usage scenarios. It follows that those answers can poorly drive designers in better understanding customers’ future needs, which are beyond the short term.For what concerns the other stakeholders involved at different extents in the design process (e.g. designers, procurement and organization departments, as well as manufacturers, suppliers, decision makers, etc.), there exist a wider number of design tools or approaches for the elicitation and the management of requirements. Among those, it is worth mentioning technical standards (e.g. those released by entities like ISO). Technical standards are sets of design requirements (both as definitions and range of values) for specific product or process categories. They are very focused on specific fields of techniques and, as a consequence, the more detailed they are, the higher is the degree of complexity of the subject of the standard. This makes them poorly adaptable to a various range of fields of applications. Fulfilling a standard cannot be considered as a real knowledge elicitation, since they just make explicit what was tacit for others. On the contrary, Checklist tries to address this issue with a broader perspective, being more general and by taking into account different issues concerning the development of a product. Several checklists are available through scientific literature. For instance, the textbooks by Pahl et al. (2007); by Roozenburg and Eeekels (1995) as well as the one by Hales and Gooch (2004) present checklists for supporting the identification of the requirements by the stakeholders involved in the product development. They usually address different concepts by following taxonomies that are based on the product lifecycle stages (e.g. such as maintenance, disposal) or on geometry and material issues (e.g. size and weight).
From a different perspective, the “Design for X” (Pahl et al., 2007) guidelines address the needs of a wide range of technological domains. However, they are mostly focused on the definition of best practices to design products so as to satisfy a meta-requirement at a time, rather than a wide range of requirements, as necessary in the development of artificial products that have to interact with a complex environment (Simon, 1981).
Chapter 2: State of the art
23
With the purpose of combining the versatility of the Design for X approach and the capability to cover a wide set of requirements as for standards and checklists, a recent proposal focuses on the development of a more versatile approach for populating a design specification (Becattini, 2013). It introduces a general-purpose checklist based on abstract criteria for the elicitation of requirements. Its taxonomy should allow an investigation of relevant knowledge by considering abstract categories such as performances, harmful effects and consumed resources (Becattini et al., 2011) that are further detailed in sublevels. All the above approaches are capable of triggering reflections in the stakeholders of the development process, so as to generate requirements that are not yet usually considered, but that may become potentially relevant in the future. Noteworthy, they do not provide any contribution in understanding what could be their value for the achievement of satisfaction.It is worth considering the method to carry out the externalization process, being it directly responsible of the effectiveness and the efficiency of the definition of the design specification. The human-human approach involves a methodological facilitator (Fellers, 1987), which is skilled in the procedure for acquiring new knowledge and transfer it to an explicit format. This person (the facilitator) must coordinate the activities in order to keep a clear understanding of what is the content to be externalized, so that it is possible, in turn, to organize it in an appropriate way to make it reusable in the future. These approaches are often based on the interaction through Questions and Answers (Q&A) among different participants. The logic of interviews has been also duplicated in the forms of written questionnaires, so as to start releasing from the need of a facilitator. On the other hand, questionnaires with predefined questions cannot adapt the sequence of Q&A according to the answers the person participating in the survey is writing.
Surveys and interviews, however, are not the only methods capable of carrying out the externalization processes. Several examples demonstrate that this issue can be also addressed through the use of Relation Tables: insert the elicited knowledge in a well-structured framework that is easy to update and that holds a well-defined hierarchical structure. Nevertheless, it is also worth noticing that this highly hierarchical way to represent information dramatically increases the efforts in cases where complex phenomena and systems, as occurs in design for technical systems, should be codified (Martin et al. , 2012).
Noteworthy, several contributions try to exploit the use of computer tools so as to mimic the behaviour of a methodological facilitator. Wang and Zeng, for instance, presented a prototype capable of asking questions in order to capture product requirements from customers’ answers (Wang and Zeng, 2009). Both Shneidermann (2006) and Andersson (2004) proposed computer-based tools exploiting the sequences of questions and answers for the verification of product requirements downwards the development process. From a more problem-based perspective, Becattini et al. (2012) proposed a model and an algorithm that has
Chapter 2: State of the art
24
been implemented in a prototype web application that aims at highlighting the conflicting requirements underlying a design problem.For what concerns the computer mediated communication approaches for improving the knowledge about the future, some applications based on the Delphi-method, e.g.: (Garcia-Magariño et al., 2009) and (Turoff et al.; 1999), show that Q&A is a suitable technique in order to leverage qualitative knowledge. Other instruments, requiring a stronger background in statistics, support the definition of fact-based predictions by means of the regressions of quantitative data (e.g. LSM2 by IIASA and Loglet).
Finally, the organization of knowledge about requirements should be easily understandable and sharable among the different subjects involved at various extents in the development and design processes. Moreover, the anticipation of information for requirements have to be capable of dealing with the externalization of tacit into explicit knowledge, as well as with its quantitative and qualitative aspects, in order to exploit the experience of the different stakeholders involved in the design process.
The following section presents the state of the art related to Technology Forecasting (TF) methods, which deals with the anticipation of data and information about future.
Chapter 2: State of the art
25
2.2 Technology forecasting
“Technology forecasting purpose's is to provide timely insight into the prospects for significant technological change”
(et al., 1997)
How technology change and what features will characterize the next generation of products or services required by the market constitutes strategic information for companies, and represents a shared dilemma among innovators. The research community has tried to address these needs through technology forecasting (TF) methods. However, the definition of what technology forecasting method means in literature is quite fuzzy, and it can be interpreted in different ways depending on the specific research community e.g. economy and statistic. From prescribed language definition, the meaning of method is rather intuitive (“an ordered systematic arrangement of...”) (Oxford English Dictionary, 2014)), however, the meaning of “technology” and “forecasting” are worth of some more explanation.
As first, the Oxford English Dictionary (2014) defines technology as: “the branch of knowledge dealing with the mechanical arts and applied sciences” and “the application of such knowledge for practical purposes, esp. in industry, manufacturing”. With similar perspective, the American Heritage Dictionary (2014) reports: “[technology is] the application of science, especially to industrial or commercial objectives”; “the scientific method and material used to achieve a commercial or industrial objective”. Both of these definitions seem to be adequate for this research since both, product and process, are included in the objectives to be achieved in the definition.
Secondly, the Oxford English Dictionary (2014) defines forecasting as: “to consider or think of beforehand”; “to estimate, conjecture, or imagine beforehand (the course of event or future condition of things)”. On the other hand, the American Heritage Dictionary (2014) defines it as: “To serve as an advance indication of…”; “to estimate or predict in advance, especially to predict”. Both of these definitions fitting the meaning adopted for the term in the present dissertation: both of them deal with the meaning of anticipation regardless of the object of the anticipation itself (i.e. data, information or knowledge.)
Even considering the previous clarifications, the definition of the TF methods in the current vocabulary is rather fuzzy (Porter et al., 2011). In fact, TF is understood differently depending on the field of research. For instance, economy and other fields such as statistics and management rely on forecasting based on statistical/probabilistic prediction (i.e. anticipation of quantitative values),
Chapter 2: State of the art
26
building complex models of extrapolation; as a consequence, their perception about TF is mainly related to data prediction by using those complex models without so much attention on the forecasting users (Porter et al., 2011). On the contrary, Armstrong (2001) highlighted that a suitable forecasting method certainty should use extrapolation techniques to create an accurate future prediction, but in practice the forecasting is more than that. Armstrong (2001) described the “forecasting” as a need to anticipate uncertainty information about the future, highlighting the fact that its usefulness largely depends on the initial user’s knowledge. With similar view, Kucharavy and De Guio (2005) emphasized that a suitable and reliable TF should bring, at least, new knowledge to users and related beneficiaries. On the one hand, the users are essential for the application of the forecasting analysis. On the other hand, the forecasting beneficiaries are important to evaluate the forecasting results (FORMAT-deliverable 2.1, 2013).Other author as Martino (1993) proposed the TF as “a prediction of characteristics of useful machine, process or techniques”, highlighting three main points in his proposal: i) TF deals with characteristics, such as levels of performance (i.e. speed, power, or temperature, etc.), and it does not have to state how these characteristics are achieved; ii) TF deals with useful machines, excluding those items which depend more on the popular tests than on technological capability; and iii) TF needs four essential elements in order to bring useful knowledge to decision maker. These four elements are: the technology being forecast, related characteristics statement, time for forecast and probability. From similar perspective, the Technology Future Analysis Working Group (2004) proposed that TF as a systematic processes which aims at producing valuable predictions by “describing the emergence, performance, features or impacts of a technology at some time in the future”, where its usefulness is conditional to the final decision maker (i.e. economist, managers and others)
Combining the ideas of TF, the author of this dissertation defines a common viewpoint on what TF means i.e. a systematic process capable of anticipating data and information about technology in order to bring new and useful knowledge to users and related decision makers. This meaning allows understanding that technology forecasting is more than predicting data by using extrapolation models; it has to bring also new knowledge about the future for users and beneficiaries.
The next subsection presents the different forecasting methods available on literature to understand methods’ features, benefits and limitations to support design engineers during the design process.
Chapter 2: State of the art
27
2.2.1 Forecasting methods and related characterizationIn literature, several methods and tools are available with different features and characteristic to support decision makers with information about the possible and probable future scenarios of a technology. Since many types of forecasting methods are available in literature, several attempts have been made in the research community to integrate and cluster this wide variety of technology oriented approaches (e.g. Gordon and Glenn (2003); Technology Future Analysis Working Group, 2004). The need to organize the different methods emerged since the forecasting is not a simple and single phenomenon, but it is a rather complex process of analysis and synthesis of data and information. As stated in the FORMAT methodology (2013), the forecasting involves people, processes as well as science and sources of information. Moreover, there are no universal forecasting methods and, in fact, more than one hundred are available in literature (FORMAT deliverable 2.3, 2013). Actually, despite this abundance of technology forecasting methods and techniques, it seems that to come up with a reliable forecasting is still rather difficult. On the one hand, the capability to create a reliable and accurate forecast analysis depends on the techniques and the experience of the analyst using that given forecasting method to understand the technology future. On the other hand, the novelty of the results is a critical feature about what should be forecasted (Armstrong, 2001), even if it is from a relative and not absolute point of view. According to Armstrong (2001), forecasters recognize a useful forecasting method when it is easy to use and when it brings to non-obvious conclusions. With similar view, Kucharavy et al. (2007) point out that there is a need of providing to “final users” usable and reliable forecasting techniques to enable the retrieval of useful indications when setting company's priorities and structuring the design activity. Consequently, it seems that appropriate forecasting methods are those that stem from the specific knowledge of the users providing new insight about the future that the method can provide them. From this perspective, probably the forecasting methods created with a specific scope and purpose represent the most widely acknowledged solution to accept the reliability, usability and accuracy of a method by different users.
Among the different available forecasting methods, Technology Future Analysis Working Group (TFAWG) (2004) presented one of the most recognized classifications of TF methods; in their proposal the technology forecasting method are presented in 9 forecasting families (i.e. groups of different forecasting methods organized according their characteristics). In TFAWG’s classification is possible to distinguish among both Soft (Qualitative) and Hard (Quantitative) forecasting methods. On the one hand, qualitative methods correspond to those methods that create a future scenario based on users’ knowledge and judgment. On the other hand, quantitative methods are those that use quantitative regression and, in some cases, a set of rigorous rules to envisioning the future. Furthermore, TFAWG (2004) proposed a secondary classification about how the forecasting is developed as: i) Exploratory methods which begin from the present, and see where events
Chapter 2: State of the art
28
and trends might take us; ii) Normative methods that begin from the future, asking what trends and events would take us there. However, many methods can be considered normative or extrapolative, quantitative or qualitative, depending on how they are applied. For instance, TFAWG (2004) pointed out that each method can be useful by itself or by a combination of them. In table 1 is presented the classification proposed by the TFAWG (2014).Table 1: Forecasting families and related methods according to TFAWG (2004).
Family Forecasting method Hard/Soft Expl/
Norm Expert
Opinion
Delphi (iterative survey) S-Ql N-E
Focus Groups [panels, workshops] S-Ql N-E
Interviews S-Ql N-E
Participatory techniques S-Ql N
Trend Analysis
Trend Extrapolation [Growth Curve Fitting] H-Qt E
Trend Impact Analysis H-Qt N-E
Precursor Analysis H-Qt E
Long Wave Analysis H-Qt E
Monitoring and Intelligence
Monitoring [environmental scanning, technology watch] S-Ql E
Bibliometrics [research profiling; patent analysis, text
mining] H/S-Ql/Qt E
Statistical
Correlation Analysis H-Qt E
Demographics H-Qt E
Cross Impact Analysis H/S-Ql/Qt E
Risk Analysis H/S-Ql/Qt N-E
Bibliometrics [research profiling; patent analysis, text
mining] H/S-Ql/Qt E
Modelling and Simulation
Agent Modelling H-Qt E
Cross Impact Analysis H/S-Ql/Qt E
Sustainability Analysis [life cycle analysis] H-Qt E
Causal Models H/S-Ql/Qt E
Diffusion Modelling H-Qt E
Complex Adaptive System Modelling (CAS) [Chaos] H-Qt E
Systems Simulation [System Dynamics, KSIM] H-Qt E
Technological Substitution H-Qt E
Scenario-simulation [gaming; interactive scenarios] H-Qt E
Economic based modelling [input-output analysis] H-Qt E
Technology Assessment H/S-Ql/Qt E
Scenarios
Scenarios [scenarios with consistency checks; scenario
management; concept scenario] H/S-Ql/Qt N-E
Scenario-simulation [gaming; interactive scenarios] H-Qt E
Field Anomaly Relaxation Method [FAR] S-Ql N-E
Valuing/ Decision/ Economics
Relevance Trees [futures wheel] S-Ql N-E
Action [options] Analysis S-Ql N-E
Cost-benefit Analysis H-Qt E
Decision Analysis [utility analyses] S-Ql N-E
Economic based Modelling [input-output analysis] H-Qt E
Descriptive and Matrices
Analogies H/S-Ql/Qt E
Backcasting S-Ql N
Checklist for Impact Identification S-Ql E
Innovation System Modeling S-Ql E
Institutional Analysis S-Ql E
Mitigation Analysis S-Ql N
Morphological Analysis S-Ql N-E
Roadmapping [product-technology roadmapping] H/S-Ql/Qt N-E
Social Impact Assessment S-Ql N-E
Chapter 2: State of the art
29
Organizational Analysis S-Ql E
Requirements Analysis [needs analysis] H/S-Ql/Qt N
Creativity
Brainstorming [brainwriting; nominal group process (NGP),
SCAMPER] S-Ql N-E
Creativity Workshops [future workshops] S-Ql N-E
TRIZ H-Qt N-E
Vision Generation S-Ql N-E
Science Fiction Analysis S-Ql N
Given the over-mentioned scenario, an important activity for this research is at least recognizing which are the methods suitable to support the different PDP. Furthermore, recognize which methods are compatible with design engineers’ knowledge. Consequently, a detailed explanation is required to understand their suitability for this research. According to Roper et al. (2011), there are only five families considered frequently used by practitioners:
i) Methods constituted by the ones who have the knowledge, well known as “Expert Opinion”, where the opinion of the expert is obtained and analysed. The main assumption of these methods is that “some individuals know a lot about some topic than others, their forecast will be substantially better” (Roper et al., 2011). However, a limitation of the method is the identification of the appropriate expert for the forecast. Moreover, if the interaction among experts is allowed, the forecast may be affected by several social and psychological factors (Levary et al.,1995);
ii) Methods that rely only in prediction of future values, also known as “Trend analysis”: Mathematical and statistical techniques used to extend the time series data into the future. The main assumption for this family is “past conditions and trends will continue in the future more or less unchanged”. The limitations of these methods are availability and goodness of the data (Phillips et al., 2007).
iii) Methods focused on collecting data and process them to find relevant patterns and trends recognized as “Monitoring”. Actually, strictly speaking this is not considered as a forecasting method; however, it is used to gather data and in some cases information. The main assumption is “there is information useful for a forecast, and it can be obtained”; the main limitation emerged from the quality of the data and their results, because several times it is performed without adequate selectivity and filtering (Coates et al., 2001);
iv) Methods that try to represent the reality by models, well known as “Modelling”, the main assumption is “the basic structure and important aspects of part of the world can be captured by simplified representations”. However, a limitation emerges from the sophisticated techniques that may drive to faulty assumptions, giving a poor credibility to the forecasting results (Armstrong, 1985). In particular, models usually favour on quantifiable over no-quantifiable parameters, thereby neglecting potentially important factors (TFAWG, 2004);