423
December 2008
Baggi et al
Clinical Implications
Numerical results suggest that implant diameter may be more
effective than implant length as a design parameter to control
the risk of bone overload. For a given implant in the molar
re-gion, the worst load transmission mechanisms arise with
maxil-lary placement, and implant biomechanical behavior greatly
improves if bone is efficiently preserved at the crest.
Statement of problem. Load transfer mechanisms and possible failure of osseointegrated implants are affected by
implant shape, geometrical and mechanical properties of the site of placement, as well as crestal bone resorption. Suitable estimation of such effects allows for correct design of implant features.
Purpose. The purpose of this study was to analyze the influence of implant diameter and length on stress distribution
and to analyze overload risk of clinically evidenced crestal bone loss at the implant neck in mandibular and maxillary molar periimplant regions.
Material and methods. Stress-based performances of 5 commercially available implants (2 ITI, 2 Nobel Biocare,
and 1 Ankylos implant; diameters of 3.3 mm to 4.5 mm, bone-implant interface lengths of 7.5 mm to 12 mm) were analyzed by linearly elastic 3-dimensional finite element simulations, under a static load (lateral component: 100 N; vertical intrusive component: 250 N). Numerical models of maxillary and mandibular molar bone segments were gen-erated from computed tomography images, and local stress measures were introduced to allow for the assessment of bone overload risk. Different crestal bone geometries were also modelled. Type II bone quality was approximated, and complete osseous integration was assumed.
Results. Maximum stress areas were numerically located at the implant neck, and possible overloading could
oc-cur in compression in compact bone (due to lateral components of the occlusal load) and in tension at the interface between cortical and trabecular bone (due to vertical intrusive loading components). Stress values and concentration areas decreased for cortical bone when implant diameter increased, whereas more effective stress distributions for cancellous bone were experienced with increasing implant length. For implants with comparable diameter and length, compressive stress values at cortical bone were reduced when low crestal bone loss was considered. Finally, dissimilar stress-based performances were exhibited for mandibular and maxillary placements, resulting in higher compressive stress in maxillary situations.
Conclusions. Implant designs, crestal bone geometry, and site of placement affect load transmission mechanisms.
Due to the low crestal bone resorption documented by clinical evidence, the Ankylos implant based on the platform switching concept and subcrestal positioning demonstrated better stress-based performance and lower risk of bone overload than the other implant systems evaluated. (J Prosthet Dent 2008;100:422-431)
The influence of implant diameter and
length on stress distribution of
osseointegrated implants related to
crestal bone geometry: A
three-dimensional finite element analysis
Luigi Baggi, DDS,
aIlaria Cappelloni, MS,
bMichele Di Girolamo,
DDS,
cFranco Maceri, MS,
dand Giuseppe Vairo, MS, PhD
eUniversity of Rome “Tor Vergata,” School of Dentistry and School
of Medical Engineering, Rome, Italy
aAssociate Professor, School of Dentistry. bPhD student, School of Medical Engineering. cAssistant Professor, School of Dentistry. dFull Professor, School of Medical Engineering. eAssistant Professor, School of Medical Engineering.
Endosseous dental implants are currently used to retain and/ or support prostheses for restor-ing completely or partially edentu-lous patients, for a variety of tooth loss scenarios. Whether an implant is used following a period of undis-turbed healing or immediately af-ter placement, a number of clinical studies1-11 have shown that failure of
osseointegrated implants is generally not related to mechanical failure of the load-bearing artificial structure (generally titanium based), but is in-duced by bone weakening or loss at the periimplant region. Moreover, clinical research has documented that the incidence of implant failure in the maxillary posterior region is generally higher than in the mandibular poste-rior area.7-11
Bone resorption can be activated by surgical trauma or bacterial infec-tion, as well as by overloading at the bone-implant interface.2,12-15 Under
functional forces, overloading of peri-implant bone can be induced by a shortcoming in load transfer mecha-nisms, primarily due to improper oc-clusion, prosthesis and/or implant design, and surgical placement. As a consequence, high stress concentra-tions at the bone-implant interface may arise and, according to well-sup-ported hypotheses,14-17 related strain
fields in bone tissue may stimulate biological bone resorption, jeopardiz-ing implant effectiveness.
Bone resorption at the implant neck (usually called “cratering”) is not inevitable, because some clinical evidence has indicated that a reduc-tion of crestal bone loss is possible when the connection diameter of the abutment is narrower than the im-plant collar; that is, when so-called platform switching configurations are considered.18-20 Combining this
con-cept with subcrestal placement and a microstructured implant, bone ap-position on the horizontal surface of the implant should be accomplished, transferring the biological width from the vertical to the horizontal level (platform shifting). Accordingly,
al-though platform switching configura-tions can suffer higher stress gradients and stress values in the abutment or abutment screw, additional support for overlying soft tissues is provided, inducing a more complete implant integration21-23 and ensuring excellent
esthetics over the long term. The rea-sons that platform switching results in bone preservation have not yet been clarified, but several hypotheses are related to the location of the mi-crogap between the implant and the abutment, as well as to stress distri-bution at periimplant regions.24-27
Stress and strain fields around os-seointegrated dental implants are af-fected by a number of biomechanical factors, including the type of loading, material properties of the implant and the prosthesis, implant geom-etry, surface structure, quality and quantity of the surrounding bone, and the nature of the bone-implant interface.12,13 As far as implant shape
is concerned, design parameters that primarily affect load transfer charac-teristics (the stress/strain distribu-tions in the bone) include implant diameter and the length of the bone-implant interface, as well as, in the case of threaded implants, thread pitch, shape, and depth. To increase the surface area for osseous integra-tion, threaded implants are gener-ally preferred to smooth cylindrical ones.28 Depending on bone quality,
surface treatments and a thread ge-ometry can significantly influence im-plant effectiveness, in terms of both initial stability and the biomechanical nature of the bone-implant interface after the healing process.29,30
Several implant concepts have been developed, and many implant types are commercially available in different sizes, shapes, materials, and surfaces. To analyze the effectiveness and reliability of endosseous plants, revealing possible risks of im-plant failure, stress analysis of bone-implant mechanical interactions is important.31,32
The complex geometry of the cou-pled bone-implant biomechanical
sys-tem prevents the use of closed-form approach for stress evaluation. There-fore, the behavior of endosteal dental implants can be investigated by using numerical techniques. Recently, the fi-nite element method has been widely applied to prosthetic dentistry33,34
to predict stress and strain distribu-tions at periimplant regions, investi-gating the influences of implant and prosthesis designs,35-43 the
magni-tude and direction of loads,41-45 and
bone mechanical properties,46,47 as
well as modelling different clinical scenarios.20,48-52 Some authors
con-sider axisymmetric or bidimensional simplified models,39,41,42 disregarding
the proper shape of the placement site and/or the implant, as well as the effects of clinically evidenced crestal bone loss in functioning implants, that is, after a healing and loading period.53,54 Nevertheless, more
real-istic results can be obtained through a more detailed modelling of implant and bone (including possible crater-like bone resorption effects), as well as suitable boundary conditions that do not affect local stress distribution at the bone-implant interface.
The purpose of this study was to compare, by means of 3-dimensional (3-D) linearly elastic finite element simulations, load transmission mech-anisms and bone overload risk of 5 commercial osseointegrated implants in functioning conditions, modelling clinically evidenced crestal bone ge-ometry. Different implant-abutment connections were considered, includ-ing platform switchinclud-ing configura-tions. Moreover, with the purpose of investigating the influence of the site of placement, placement of implants in both maxillary and mandibular molar bone segments were numeri-cally compared.
MATERIAL AND METHODS Five threaded dental implants were analyzed (Fig. 1, A): 2 ITI Stan-dard implants (Institut Straumann AG, Basel, Switzerland), 2 Nobel Biocare implant systems (Nobel
Bio-December 2008
Baggi et al
Clinical Implications
Numerical results suggest that implant diameter may be more
effective than implant length as a design parameter to control
the risk of bone overload. For a given implant in the molar
re-gion, the worst load transmission mechanisms arise with
maxil-lary placement, and implant biomechanical behavior greatly
improves if bone is efficiently preserved at the crest.
Statement of problem. Load transfer mechanisms and possible failure of osseointegrated implants are affected by
implant shape, geometrical and mechanical properties of the site of placement, as well as crestal bone resorption. Suitable estimation of such effects allows for correct design of implant features.
Purpose. The purpose of this study was to analyze the influence of implant diameter and length on stress distribution
and to analyze overload risk of clinically evidenced crestal bone loss at the implant neck in mandibular and maxillary molar periimplant regions.
Material and methods. Stress-based performances of 5 commercially available implants (2 ITI, 2 Nobel Biocare,
and 1 Ankylos implant; diameters of 3.3 mm to 4.5 mm, bone-implant interface lengths of 7.5 mm to 12 mm) were analyzed by linearly elastic 3-dimensional finite element simulations, under a static load (lateral component: 100 N; vertical intrusive component: 250 N). Numerical models of maxillary and mandibular molar bone segments were gen-erated from computed tomography images, and local stress measures were introduced to allow for the assessment of bone overload risk. Different crestal bone geometries were also modelled. Type II bone quality was approximated, and complete osseous integration was assumed.
Results. Maximum stress areas were numerically located at the implant neck, and possible overloading could
oc-cur in compression in compact bone (due to lateral components of the occlusal load) and in tension at the interface between cortical and trabecular bone (due to vertical intrusive loading components). Stress values and concentration areas decreased for cortical bone when implant diameter increased, whereas more effective stress distributions for cancellous bone were experienced with increasing implant length. For implants with comparable diameter and length, compressive stress values at cortical bone were reduced when low crestal bone loss was considered. Finally, dissimilar stress-based performances were exhibited for mandibular and maxillary placements, resulting in higher compressive stress in maxillary situations.
Conclusions. Implant designs, crestal bone geometry, and site of placement affect load transmission mechanisms.
Due to the low crestal bone resorption documented by clinical evidence, the Ankylos implant based on the platform switching concept and subcrestal positioning demonstrated better stress-based performance and lower risk of bone overload than the other implant systems evaluated. (J Prosthet Dent 2008;100:422-431)
The influence of implant diameter and
length on stress distribution of
osseointegrated implants related to
crestal bone geometry: A
three-dimensional finite element analysis
Luigi Baggi, DDS,
aIlaria Cappelloni, MS,
bMichele Di Girolamo,
DDS,
cFranco Maceri, MS,
dand Giuseppe Vairo, MS, PhD
eUniversity of Rome “Tor Vergata,” School of Dentistry and School
of Medical Engineering, Rome, Italy
aAssociate Professor, School of Dentistry. bPhD student, School of Medical Engineering. cAssistant Professor, School of Dentistry. dFull Professor, School of Medical Engineering. eAssistant Professor, School of Medical Engineering.
Endosseous dental implants are currently used to retain and/ or support prostheses for restor-ing completely or partially edentu-lous patients, for a variety of tooth loss scenarios. Whether an implant is used following a period of undis-turbed healing or immediately af-ter placement, a number of clinical studies1-11 have shown that failure of
osseointegrated implants is generally not related to mechanical failure of the load-bearing artificial structure (generally titanium based), but is in-duced by bone weakening or loss at the periimplant region. Moreover, clinical research has documented that the incidence of implant failure in the maxillary posterior region is generally higher than in the mandibular poste-rior area.7-11
Bone resorption can be activated by surgical trauma or bacterial infec-tion, as well as by overloading at the bone-implant interface.2,12-15 Under
functional forces, overloading of peri-implant bone can be induced by a shortcoming in load transfer mecha-nisms, primarily due to improper oc-clusion, prosthesis and/or implant design, and surgical placement. As a consequence, high stress concentra-tions at the bone-implant interface may arise and, according to well-sup-ported hypotheses,14-17 related strain
fields in bone tissue may stimulate biological bone resorption, jeopardiz-ing implant effectiveness.
Bone resorption at the implant neck (usually called “cratering”) is not inevitable, because some clinical evidence has indicated that a reduc-tion of crestal bone loss is possible when the connection diameter of the abutment is narrower than the im-plant collar; that is, when so-called platform switching configurations are considered.18-20 Combining this
con-cept with subcrestal placement and a microstructured implant, bone ap-position on the horizontal surface of the implant should be accomplished, transferring the biological width from the vertical to the horizontal level (platform shifting). Accordingly,
al-though platform switching configura-tions can suffer higher stress gradients and stress values in the abutment or abutment screw, additional support for overlying soft tissues is provided, inducing a more complete implant integration21-23 and ensuring excellent
esthetics over the long term. The rea-sons that platform switching results in bone preservation have not yet been clarified, but several hypotheses are related to the location of the mi-crogap between the implant and the abutment, as well as to stress distri-bution at periimplant regions.24-27
Stress and strain fields around os-seointegrated dental implants are af-fected by a number of biomechanical factors, including the type of loading, material properties of the implant and the prosthesis, implant geom-etry, surface structure, quality and quantity of the surrounding bone, and the nature of the bone-implant interface.12,13 As far as implant shape
is concerned, design parameters that primarily affect load transfer charac-teristics (the stress/strain distribu-tions in the bone) include implant diameter and the length of the bone-implant interface, as well as, in the case of threaded implants, thread pitch, shape, and depth. To increase the surface area for osseous integra-tion, threaded implants are gener-ally preferred to smooth cylindrical ones.28 Depending on bone quality,
surface treatments and a thread ge-ometry can significantly influence im-plant effectiveness, in terms of both initial stability and the biomechanical nature of the bone-implant interface after the healing process.29,30
Several implant concepts have been developed, and many implant types are commercially available in different sizes, shapes, materials, and surfaces. To analyze the effectiveness and reliability of endosseous plants, revealing possible risks of im-plant failure, stress analysis of bone-implant mechanical interactions is important.31,32
The complex geometry of the cou-pled bone-implant biomechanical
sys-tem prevents the use of closed-form approach for stress evaluation. There-fore, the behavior of endosteal dental implants can be investigated by using numerical techniques. Recently, the fi-nite element method has been widely applied to prosthetic dentistry33,34
to predict stress and strain distribu-tions at periimplant regions, investi-gating the influences of implant and prosthesis designs,35-43 the
magni-tude and direction of loads,41-45 and
bone mechanical properties,46,47 as
well as modelling different clinical scenarios.20,48-52 Some authors
con-sider axisymmetric or bidimensional simplified models,39,41,42 disregarding
the proper shape of the placement site and/or the implant, as well as the effects of clinically evidenced crestal bone loss in functioning implants, that is, after a healing and loading period.53,54 Nevertheless, more
real-istic results can be obtained through a more detailed modelling of implant and bone (including possible crater-like bone resorption effects), as well as suitable boundary conditions that do not affect local stress distribution at the bone-implant interface.
The purpose of this study was to compare, by means of 3-dimensional (3-D) linearly elastic finite element simulations, load transmission mech-anisms and bone overload risk of 5 commercial osseointegrated implants in functioning conditions, modelling clinically evidenced crestal bone ge-ometry. Different implant-abutment connections were considered, includ-ing platform switchinclud-ing configura-tions. Moreover, with the purpose of investigating the influence of the site of placement, placement of implants in both maxillary and mandibular molar bone segments were numeri-cally compared.
MATERIAL AND METHODS Five threaded dental implants were analyzed (Fig. 1, A): 2 ITI Stan-dard implants (Institut Straumann AG, Basel, Switzerland), 2 Nobel Biocare implant systems (Nobel
Bio-424
Volume 100 Issue 6
December 2008
425
Baggi et al
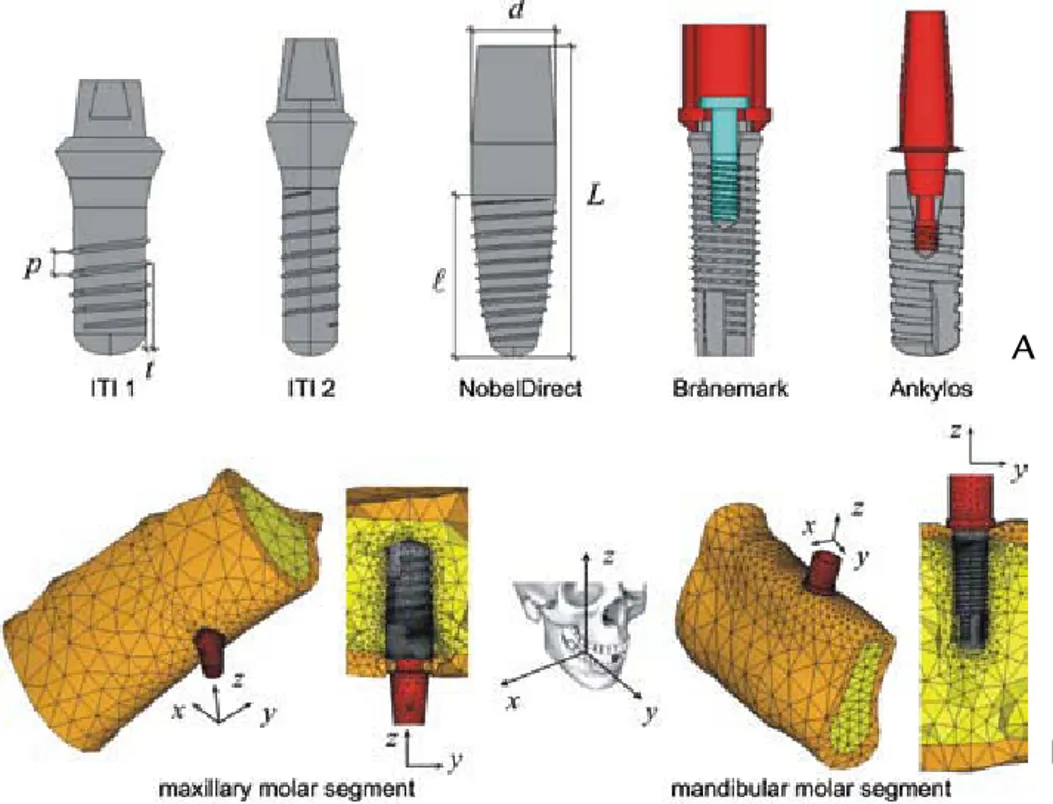
1 A, Solid models of 5 implant systems analyzed (L: implant total length; l : bone-implant interface
length; d: implant maximum diameter; p: average thread pitch; t: average thread depth). B, Mesh details of overall bone-implant system for both maxillary and mandibular bone segments.
care AB, Göteborg, Sweden), and an Ankylos implant (Dentsply Friadent, Mannheim, Germany). The ITI and NobelDirect implants were modelled by a 1-body structure; the Brånemark implant is connected to the abutment by an internal screw; the Ankylos sys-tem has a threaded abutment directly inserted into the implant, and in agreement with the platform switch-ing concept. The thread is trapezoidal for the Ankylos implant and triangular
for the other implants. As summarized in Table I, implants are comparable in thread pitch and depth, whereas the diameter varies from 3.3 mm to 4.5 mm, and the length of the implant-bone interface varies from 7.5 mm to 12 mm.
Three-dimensional solid models of implants and abutments were de-veloped by using a comparative tech-nique involving high-resolution pic-tures and actual implants. Maxillary
and mandibular bone segments rel-evant to molar regions were modelled from CT (computed tomography) im-ages, evaluating the physiological pa-rameters of cancellous and compact bone with software (SimPlant 7.0; Materialise Dental NV, Leuven, Bel-gium). Gingival soft tissues were not modelled, and bone segments were modelled with 2 volumes (Fig. 1, B): an outer shell with an average thick-ness of about 2 mm, representing the
A
B
ITI Standard (1) ITI Standard (2) NobelDirect Brånemark System Ankylos Implant 7.5 9.0 9.0 12.0 11.0 16 17 16 14 11 L (mm) 4.10 3.30 4.50 3.75 4.50 d (mm) 1.15 0.98 0.73 0.60 1.06 p (mm) 0.24 0.20 0.21 0.27 0.20 t (mm)Institut Straumann AG, Basel, Switzerland Nobel Biocare AB, Göteborg, Sweden Dentsply Friadent, Mannheim, Germany
Manufacturer
Table I.
Geometric properties of 5 implants analyzed in this study. Notation refers to Fig-ure 1: L is implant total length;l
denotes bone-implant interface length; d indicates implant maximum diameter; p is average thread pitch; t is average thread depthcortical bone layer, and an inner vol-ume representing cancellous bone tis-sue, assumed to be perfectly connect-ed with the cortical layer. The length of bone segments in the mesial-distal direction (Fig. 1, y axis) was approxi-mately 40 mm, and the average height was about 16 mm for the maxillary segment and 24 mm for the mandibu-lar segment. Implant systems were as-sumed to be placed approximately at the midspan of bone segments.
To realistically reproduce the physiological structure of the com-pact bone arising around a function-ing implant after a healfunction-ing period, different periimplant crestal geom-etries were modelled. Depending on
implant shape and in accordance with well-established clinical evidence (Fig. 2, A),53,54 2 types of crestal bone
geometries were considered in de-tail. As shown in Figure 2, a “flared” shape was modelled for ITI and No-bel Biocare implants, accounting for a cratering effect with a mean crestal bone loss of about 45% in thickness. For the Ankylos implant, the platform switching configuration indicated low crestal bone loss (assumed to be about 20% in thickness) should be modeled with a horizontal cortical bone layer apposition of about 0.3 mm in thickness.
All 3-D solid models (bone seg-ments and implants) were built
us-ing a custom-made preprocessus-ing tool, developed as a part of a com-mercial software program (MATLAB; The MathWorks, Inc, Natick, Mass), which is able to produce the primary topology of each model through a cu-bic interpolation algorithm. Its output is fully compatible with a commercial finite element code (ANSYS 7.1; AN-SYS, Inc, Canonsburg, Pa) used for merging all of the parts comprising the overall bone-implant model and for generating and solving the discrete finite element meshes.
Numerical models of implants in maxillary and mandibular bone seg-ments were generated by means of 10-node tetrahedral elements based
2 Geometrical modelling of crestal bone loss induced by implant shape. A, Periapical radiographs showing
crestal bone loss for ITI Standard (2), Nobel Biocare, and Ankylos implants after loading period of approxi-mately 1 year. B, Bone solid models relevant to situation of significant cratering crestal bone loss (left) and to situation of low bone loss, due to platform switching configuration and subcrestal placement (right).
A
Volume 100 Issue 6
December 2008
Baggi et al
1 A, Solid models of 5 implant systems analyzed (L: implant total length; l : bone-implant interface
length; d: implant maximum diameter; p: average thread pitch; t: average thread depth). B, Mesh details of overall bone-implant system for both maxillary and mandibular bone segments.
care AB, Göteborg, Sweden), and an Ankylos implant (Dentsply Friadent, Mannheim, Germany). The ITI and NobelDirect implants were modelled by a 1-body structure; the Brånemark implant is connected to the abutment by an internal screw; the Ankylos sys-tem has a threaded abutment directly inserted into the implant, and in agreement with the platform switch-ing concept. The thread is trapezoidal for the Ankylos implant and triangular
for the other implants. As summarized in Table I, implants are comparable in thread pitch and depth, whereas the diameter varies from 3.3 mm to 4.5 mm, and the length of the implant-bone interface varies from 7.5 mm to 12 mm.
Three-dimensional solid models of implants and abutments were de-veloped by using a comparative tech-nique involving high-resolution pic-tures and actual implants. Maxillary
and mandibular bone segments rel-evant to molar regions were modelled from CT (computed tomography) im-ages, evaluating the physiological pa-rameters of cancellous and compact bone with software (SimPlant 7.0; Materialise Dental NV, Leuven, Bel-gium). Gingival soft tissues were not modelled, and bone segments were modelled with 2 volumes (Fig. 1, B): an outer shell with an average thick-ness of about 2 mm, representing the
A
B
ITI Standard (1) ITI Standard (2) NobelDirect Brånemark System Ankylos Implant 7.5 9.0 9.0 12.0 11.0 16 17 16 14 11 L (mm) 4.10 3.30 4.50 3.75 4.50 d (mm) 1.15 0.98 0.73 0.60 1.06 p (mm) 0.24 0.20 0.21 0.27 0.20 t (mm)Institut Straumann AG, Basel, Switzerland Nobel Biocare AB, Göteborg, Sweden Dentsply Friadent, Mannheim, Germany
Manufacturer
Table I.
Geometric properties of 5 implants analyzed in this study. Notation refers to Fig-ure 1: L is implant total length;l
denotes bone-implant interface length; d indicates implant maximum diameter; p is average thread pitch; t is average thread depthcortical bone layer, and an inner vol-ume representing cancellous bone tis-sue, assumed to be perfectly connect-ed with the cortical layer. The length of bone segments in the mesial-distal direction (Fig. 1, y axis) was approxi-mately 40 mm, and the average height was about 16 mm for the maxillary segment and 24 mm for the mandibu-lar segment. Implant systems were as-sumed to be placed approximately at the midspan of bone segments.
To realistically reproduce the physiological structure of the com-pact bone arising around a function-ing implant after a healfunction-ing period, different periimplant crestal geom-etries were modelled. Depending on
implant shape and in accordance with well-established clinical evidence (Fig. 2, A),53,54 2 types of crestal bone
geometries were considered in de-tail. As shown in Figure 2, a “flared” shape was modelled for ITI and No-bel Biocare implants, accounting for a cratering effect with a mean crestal bone loss of about 45% in thickness. For the Ankylos implant, the platform switching configuration indicated low crestal bone loss (assumed to be about 20% in thickness) should be modeled with a horizontal cortical bone layer apposition of about 0.3 mm in thickness.
All 3-D solid models (bone seg-ments and implants) were built
us-ing a custom-made preprocessus-ing tool, developed as a part of a com-mercial software program (MATLAB; The MathWorks, Inc, Natick, Mass), which is able to produce the primary topology of each model through a cu-bic interpolation algorithm. Its output is fully compatible with a commercial finite element code (ANSYS 7.1; AN-SYS, Inc, Canonsburg, Pa) used for merging all of the parts comprising the overall bone-implant model and for generating and solving the discrete finite element meshes.
Numerical models of implants in maxillary and mandibular bone seg-ments were generated by means of 10-node tetrahedral elements based
2 Geometrical modelling of crestal bone loss induced by implant shape. A, Periapical radiographs showing
crestal bone loss for ITI Standard (2), Nobel Biocare, and Ankylos implants after loading period of approxi-mately 1 year. B, Bone solid models relevant to situation of significant cratering crestal bone loss (left) and to situation of low bone loss, due to platform switching configuration and subcrestal placement (right).
A
426
Volume 100 Issue 6
December 2008
427
Baggi et al
on a pure displacement formulation, with quadratic displacement shape functions and 3 degrees of freedom per node.55 Resulting from an
opti-mization process based on numerical convergence analyses, mean value of the mesh size was set equal to approx-imately 0.6 mm for the bone-implant interface, and to approximately 0.1 mm at the periimplant region. Table II summarizes the number of elements and nodes for the convergent discrete models.
Dry material models were used for bone tissues, neglecting the effects of fluid-solid interactions. Materials were assumed to have a linearly elas-tic isotropic behavior, and all material volumes were considered to be ho-mogeneous. Implants and abutments were assumed to be constituted of a titanium alloy, Ti6Al4V, with a Young’s modulus and Poisson’s ratio of 114 GPa and 0.34, respectively.42,56 In
agreement with data available in the literature, the Poisson’s ratio of bone tissue (both cortical and trabecular) was assumed to be 0.3,52 Young’s
modulus of both maxillary and man-dibular cortical bone was assumed to be 13.7 GPa,42,57 and Young’s
modu-lus for maxillary (mandibular) can-cellous bone was set to 0.5 GPa52 (1
GPa42). These properties approximate
type II bone quality,58 and maxillary
trabecular bone was assumed to be less dense than mandibular, resulting in a smaller Young’s modulus.59
Complete osseous integration between implants and living tissues was assumed, resulting in the
conti-nuity of the displacement field at the implant-bone interface. Furthermore, displacement functions were assumed to be continuous at possible inter-faces between different implant parts (abutment, internal screw, implant), and the end sections (parallel to the
xz plane, Fig. 1) of the bone segments were assumed to be fixed; that is, all nodal displacement components of segments were set equal to zero. Since the free length of bone segments (the distance between end surfaces of an-atomical sites and the implant loca-tion) was sufficiently larger than the maximum dimension of the implant and in agreement with the theory of elasticity, these boundary conditions should not significantly affect the stress results at the periimplant re-gion.
Finite element simulations for the 5 commercial single tooth implants were developed considering a static load applied at the top of abutments without any eccentricity with respect to the implant axis (Fig. 1, z), and angled at approximately 22 degrees with reference to z. The lateral force component along the buccal-lingual axis (opposed to the x-axis direc-tion) was assumed to be 100 N, and the vertical intrusive component was 250 N. To allow for significant com-parisons, abutments were adjusted in such a way that all loading applica-tion points were 7 mm from the bone insertion surface.
Coupled bone-implant models were numerically analyzed to evaluate stress distributions on both compact
and cancellous bone at periimplant regions, providing risk measures of critical bone overloading. In agree-ment with a number of studies,33-52
the von Mises stress field (σVM) was used as an indicator of the average stress level at the periimplant region, providing a global measure of load transfer mechanisms. Moreover, in agreement with the maximum normal stress criterion,60 principal stresses
were used at the bone-implant inter-face to define local risk indicators of physiological bone failure and of the activation of bone resorption. Ac-cordingly, assuming ultimate bone strength as a physiological limit, local overloading at cortical bone occurs in compression when the maximum compressive principal stress (σC) ex-ceeds 170-190 MPa in modulus, and in tension when the maximum tensile principal stress (σT) exceeds 100-130 MPa.17,59 Moreover, local overloading
at the trabecular bone occurs when σT and/or |σC| exceed 5 MPa,17 the
sym-bol |σC| denoting the modulus of σC. In order to provide quantitative indications that are useful for com-parative evaluations, trabecular (Σt) and compact (Σc) bone layers sur-rounding the implant and having an average thickness of approximately 1 mm were considered. For a given position along the implant axis, aver-age and peak values of σVM, σT, and σC were computed over Σc and Σt, by using a custom-made postprocessing procedure, with input consisting of some primary geometrical and topo-logical data (nodal coordinates and
Table II.
Number of elements and nodes used in finite element models of 5 implantsITI Standard (1) ITI Standard (2) NobelDirect Brånemark System Ankylos Implant Maxillary Segment 116,677 108,961 126,318 135,838 179,903 Elements 134,464 128,282 146,946 152,533 210,289 Nodes Mandibular Segment 102,079 103,627 126,318 147,732 156,793 Elements 116,052 122,401 146,946 168,328 178,447 Nodes
elements lying at bone-implant inter-facial regions) and stress solutions at finite element integration points.
RESULTS
Figures 3 and 4 show von Mises stress distributions computed for the 5 commercial osseointegrated im-plants evaluated. With reference to
the section view at y=0, stress con-tours for both maxillary and man-dibular bone regions were compared and, to provide significant indications about both compact and trabecular periimplant regions, numerical results are presented as means of the 2 differ-ent scales of values.
Figures 5, 6, and 7 summarize peaks and average values of
princi-pal and von Mises stress measures at both the mandibular and maxillary periimplant regions. Bar charts in Fig-ure 5 refer to the cortical bone (Σc), whereas Figures 6 and 7 show quan-titative results computed at the trabe-cular bone and refer to a subdivision of the periimplant domain Σt into 3 different regions along the implant axis: near the crestal interface (Figs. 6
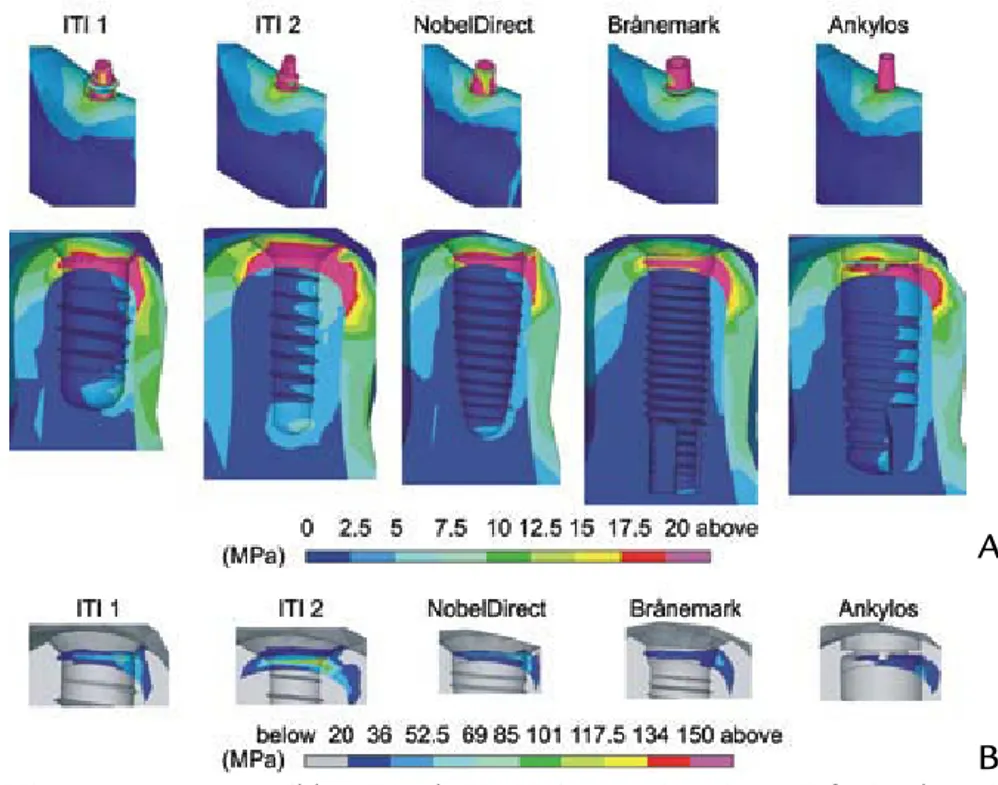
3 A, von Mises stress contours (blue: 0; red: 20 MPa) at section view y=0 for implants in
man-dibular molar segment. B, Contour details at cortical bone interface (blue: 20; red: 150 MPa).
4 A, von Mises stress contours (blue: 0; red: 20 MPa) at section view y=0 for implants in
maxillary segment. B, Contour details at cortical bone interface (blue: 20; red: 150 MPa).
A
B
A
Volume 100 Issue 6
December 2008
Baggi et al
on a pure displacement formulation, with quadratic displacement shape functions and 3 degrees of freedom per node.55 Resulting from an
opti-mization process based on numerical convergence analyses, mean value of the mesh size was set equal to approx-imately 0.6 mm for the bone-implant interface, and to approximately 0.1 mm at the periimplant region. Table II summarizes the number of elements and nodes for the convergent discrete models.
Dry material models were used for bone tissues, neglecting the effects of fluid-solid interactions. Materials were assumed to have a linearly elas-tic isotropic behavior, and all material volumes were considered to be ho-mogeneous. Implants and abutments were assumed to be constituted of a titanium alloy, Ti6Al4V, with a Young’s modulus and Poisson’s ratio of 114 GPa and 0.34, respectively.42,56 In
agreement with data available in the literature, the Poisson’s ratio of bone tissue (both cortical and trabecular) was assumed to be 0.3,52 Young’s
modulus of both maxillary and man-dibular cortical bone was assumed to be 13.7 GPa,42,57 and Young’s
modu-lus for maxillary (mandibular) can-cellous bone was set to 0.5 GPa52 (1
GPa42). These properties approximate
type II bone quality,58 and maxillary
trabecular bone was assumed to be less dense than mandibular, resulting in a smaller Young’s modulus.59
Complete osseous integration between implants and living tissues was assumed, resulting in the
conti-nuity of the displacement field at the implant-bone interface. Furthermore, displacement functions were assumed to be continuous at possible inter-faces between different implant parts (abutment, internal screw, implant), and the end sections (parallel to the
xz plane, Fig. 1) of the bone segments were assumed to be fixed; that is, all nodal displacement components of segments were set equal to zero. Since the free length of bone segments (the distance between end surfaces of an-atomical sites and the implant loca-tion) was sufficiently larger than the maximum dimension of the implant and in agreement with the theory of elasticity, these boundary conditions should not significantly affect the stress results at the periimplant re-gion.
Finite element simulations for the 5 commercial single tooth implants were developed considering a static load applied at the top of abutments without any eccentricity with respect to the implant axis (Fig. 1, z), and angled at approximately 22 degrees with reference to z. The lateral force component along the buccal-lingual axis (opposed to the x-axis direc-tion) was assumed to be 100 N, and the vertical intrusive component was 250 N. To allow for significant com-parisons, abutments were adjusted in such a way that all loading applica-tion points were 7 mm from the bone insertion surface.
Coupled bone-implant models were numerically analyzed to evaluate stress distributions on both compact
and cancellous bone at periimplant regions, providing risk measures of critical bone overloading. In agree-ment with a number of studies,33-52
the von Mises stress field (σVM) was used as an indicator of the average stress level at the periimplant region, providing a global measure of load transfer mechanisms. Moreover, in agreement with the maximum normal stress criterion,60 principal stresses
were used at the bone-implant inter-face to define local risk indicators of physiological bone failure and of the activation of bone resorption. Ac-cordingly, assuming ultimate bone strength as a physiological limit, local overloading at cortical bone occurs in compression when the maximum compressive principal stress (σC) ex-ceeds 170-190 MPa in modulus, and in tension when the maximum tensile principal stress (σT) exceeds 100-130 MPa.17,59 Moreover, local overloading
at the trabecular bone occurs when σT and/or |σC| exceed 5 MPa,17 the
sym-bol |σC| denoting the modulus of σC. In order to provide quantitative indications that are useful for com-parative evaluations, trabecular (Σt) and compact (Σc) bone layers sur-rounding the implant and having an average thickness of approximately 1 mm were considered. For a given position along the implant axis, aver-age and peak values of σVM, σT, and σC were computed over Σc and Σt, by using a custom-made postprocessing procedure, with input consisting of some primary geometrical and topo-logical data (nodal coordinates and
Table II.
Number of elements and nodes used in finite element models of 5 implantsITI Standard (1) ITI Standard (2) NobelDirect Brånemark System Ankylos Implant Maxillary Segment 116,677 108,961 126,318 135,838 179,903 Elements 134,464 128,282 146,946 152,533 210,289 Nodes Mandibular Segment 102,079 103,627 126,318 147,732 156,793 Elements 116,052 122,401 146,946 168,328 178,447 Nodes
elements lying at bone-implant inter-facial regions) and stress solutions at finite element integration points.
RESULTS
Figures 3 and 4 show von Mises stress distributions computed for the 5 commercial osseointegrated im-plants evaluated. With reference to
the section view at y=0, stress con-tours for both maxillary and man-dibular bone regions were compared and, to provide significant indications about both compact and trabecular periimplant regions, numerical results are presented as means of the 2 differ-ent scales of values.
Figures 5, 6, and 7 summarize peaks and average values of
princi-pal and von Mises stress measures at both the mandibular and maxillary periimplant regions. Bar charts in Fig-ure 5 refer to the cortical bone (Σc), whereas Figures 6 and 7 show quan-titative results computed at the trabe-cular bone and refer to a subdivision of the periimplant domain Σt into 3 different regions along the implant axis: near the crestal interface (Figs. 6
3 A, von Mises stress contours (blue: 0; red: 20 MPa) at section view y=0 for implants in
man-dibular molar segment. B, Contour details at cortical bone interface (blue: 20; red: 150 MPa).
4 A, von Mises stress contours (blue: 0; red: 20 MPa) at section view y=0 for implants in
maxillary segment. B, Contour details at cortical bone interface (blue: 20; red: 150 MPa).
A
B
A
428
Volume 100 Issue 6
December 2008
429
Baggi et al
5 von Mises (A, σVM) and principal (B, σC compressive and σT tensile) stress measures at cortical bone-implant inter-face. Average (bars) and peak (lines) values.
6 von Mises (A, σVM) and principal (B, σC compressive and σT tensile) stress measures at trabecular bone-implant in-terface for mandibular implants. Average (bars) and peak (lines) values computed at 3 different regions along implant axis: near crestal interface (light blue bars), at middle (blue bars), and at lower end (dark blue bars) of implant.
7 von Mises (A, σVM) and principal (B, σC compressive and σT tensile) stress measures at trabecular bone-implant interface for maxillary implants. Average (bars) and peak (lines) values computed at 3 different regions along implant axis: near crestal interface (light blue bars), at middle (blue bars), and at lower end (dark blue bars) of implant.
250 M P a 200 150 100 50 Mandibular 0 ITI 1 ITI 2
σ
VM NobDir Br Ank Maxillary 150 M P a 0 –75 75 –150 –225 –300 –375 ITI 1 ITI 2σ
Tσ
C NobDir Br Ank Mandibular Maxillary 5 M P a 3 4 2 1 0σ
VMITI 1 ITI 2 NobDir Br Ank
24 M P a 0 12 16 20 8 4 –4 –8 ITI 1 ITI 2
σ
Tσ
C NobDir Br Ank 5 M P a 3 4 2 1 0σ
VMITI 1 ITI 2 NobDir Br Ank
20 24 M P a 0 12 16 8 4 –4 –8 ITI 1 ITI 2
σ
Tσ
C NobDir Br AnkA
A
A
B
B
B
and 7, light blue bars), at the middle (Figs. 6 and 7, blue bars), and at the lower end (Figs. 6 and 7, dark blue bars) of the cancellous bone-implant interface. These 3 parts of Σt had the same length along the implant axis.
Stress concentration areas were located at the cortical bone around the implant neck, and the highest values of von Mises and compressive stresses at this region were numeri-cally observed for maxillary implants (σVMranging from about 65 MPa (An-kylos) to 220 MPa (ITI Standard 2), compressive stresses |σC| from about
36 MPa (Ankylos) to approximately 375 MPa (ITI Standard 2)), depend-ing on the implant design and the crestal bone geometry. However, ten-sile peaks were smaller (σT from about 18 MPa to about 100 MPa) than compressive peaks for both the man-dibular and maxillary analyses.
The Ankylos implant induced the lowest average and peak values of stress acting on the cortical bone (both in compression and in ten-sion), producing stresses equal to 4 MPa, at the most, at the trabecular bone interface. However, the highest stresses were numerically observed for the NobelDirect and ITI Stan-dard 2 implants on the mandibular segment, and for the ITI Standard 2 implant on the maxillary segment. Average stresses induced by the No-belDirect and ITI Standard 2 implants at the mandibular cortical bone were greater than those of the Ankylos sys-tem by approximately 145% in ten-sion and 290% in compresten-sion (180% considering σVM). Furthermore, when the ITI Standard 2 implant was ana-lyzed, stress values in maxillary corti-cal bone were greater (about 150% in tension, 600% in compression, 300% for the von Mises measure) than for the Ankylos implant. The previously introduced physiological limits in compression, assumed equal to the ultimate bone strength,17,59 were
ex-ceeded at the compact maxillary bone when implants ITI 1, ITI 2, and Bråne-mark were considered, whereas ten-sile bone strength limits were never
reached.
As far as the overloading risk in-dicators for cancellous bone were concerned, tensile peaks were always greater than compressive peaks, and significant concentrations appeared at the trabecular-compact interface, as well as, with smaller values, at the lower end of the implant. Strength of cancellous bone (about 5 MPa17) was
exceeded, primarily in tension, at the concentration areas for all the im-plants except for Ankylos.
DISCUSSION
The 5 commercial osseointegrated implants that were analyzed by finite element simulations exhibited differ-ent stress-based biomechanical behav-ior, dependent on shape parameters and on the site of placement, as well as on the compact bone geometry at the implant neck. For a given implant, placement in the mandibular and max-illary molar segments induced stress distributions that were dissimilar at the bone-implant interface as a con-sequence of different geometries and bone mechanical properties, resulting in higher compressive overloading risk in the maxillary segment. For a given implant, the compressive peaks and average stress at the maxillary cortical bone were about 140% of the values for the mandibular one. Accordingly, proposed quantitative stress analysis may help in understanding the clinical evidence that maxillary implants can have a higher incidence of failure than mandibular implants.7-11
Simulation results considered functioning implants, modelling cr-estal bone loss after a healing and loading period. These results have also highlighted the influence of implant length and diameter on load transfer mechanisms. In agreement with the numerically experienced trend pro-posed by Himmlova et al,39 Holmgren
et al,41 and Bozkaya et al,42 maximum
implant diameter seems to affect stress peaks at the cortical bone but not at the trabecular region, whereas stress values and distribution at the
cancellous bone-implant interface are primarily influenced by implant length. Nevertheless, to control the risk of bone overload and to improve implant biomechanical stress-based performance, numerical results from the current study suggest that implant diameter can be considered to be a more effective design parameter than implant length. In this context, the re-sults of this study can be considered to be complementary to similar, pre-viously published studies.39,41-44 Due
to the simplified and different geo-metrical models usually used in these studies,39,41,42 quantitative
compari-sons cannot be made. Analogously, Carter’s15 hypotheses regarding the
influence of the strain level of the bone on hypertrophic responses or bone resorption cannot be directly verified in a quantitative sense, but numerical simulations of the present study have confirmed that the risk of bone overload essentially affects re-gions around the implant neck.
Stress analysis of implants with similar diameters (such as Nobel-Direct, ITI 1, and Ankylos) highlights the concept that the risk of overload-ing compact bone strongly increases when significant crestal bone loss oc-curs. Accordingly, when crestal bone geometry was modelled by platform switching configurations and sub- crestal positioning (as seen with the Ankylos implant), the best stress-based performance for compact bone was obtained, together with accept-able stress values at the cancellous interface. However, when traditional adaptive bone changes were consid-ered (bone conical remodelling after loading), physiological strength limits were exceeded for both the trabecular and compact bone, inducing the risk of further bone loss and jeopardizing implant effectiveness. These results are qualitatively in agreement with those obtained by Maeda et al,20
al-though the geometries and loads that were used in that study for the finite element analyses were different from those used in the present study.
Volume 100 Issue 6
December 2008
Baggi et al
5 von Mises (A, σVM) and principal (B, σC compressive and σT tensile) stress measures at cortical bone-implant inter-face. Average (bars) and peak (lines) values.
6 von Mises (A, σVM) and principal (B, σC compressive and σT tensile) stress measures at trabecular bone-implant in-terface for mandibular implants. Average (bars) and peak (lines) values computed at 3 different regions along implant axis: near crestal interface (light blue bars), at middle (blue bars), and at lower end (dark blue bars) of implant.
7 von Mises (A, σVM) and principal (B, σC compressive and σT tensile) stress measures at trabecular bone-implant interface for maxillary implants. Average (bars) and peak (lines) values computed at 3 different regions along implant axis: near crestal interface (light blue bars), at middle (blue bars), and at lower end (dark blue bars) of implant.
250 M P a 200 150 100 50 Mandibular 0 ITI 1 ITI 2
σ
VM NobDir Br Ank Maxillary 150 M P a 0 –75 75 –150 –225 –300 –375 ITI 1 ITI 2σ
Tσ
C NobDir Br Ank Mandibular Maxillary 5 M P a 3 4 2 1 0σ
VMITI 1 ITI 2 NobDir Br Ank
24 M P a 0 12 16 20 8 4 –4 –8 ITI 1 ITI 2
σ
Tσ
C NobDir Br Ank 5 M P a 3 4 2 1 0σ
VMITI 1 ITI 2 NobDir Br Ank
20 24 M P a 0 12 16 8 4 –4 –8 ITI 1 ITI 2
σ
Tσ
C NobDir Br AnkA
A
A
B
B
B
and 7, light blue bars), at the middle (Figs. 6 and 7, blue bars), and at the lower end (Figs. 6 and 7, dark blue bars) of the cancellous bone-implant interface. These 3 parts of Σt had the same length along the implant axis.
Stress concentration areas were located at the cortical bone around the implant neck, and the highest values of von Mises and compressive stresses at this region were numeri-cally observed for maxillary implants (σVMranging from about 65 MPa (An-kylos) to 220 MPa (ITI Standard 2), compressive stresses |σC| from about
36 MPa (Ankylos) to approximately 375 MPa (ITI Standard 2)), depend-ing on the implant design and the crestal bone geometry. However, ten-sile peaks were smaller (σT from about 18 MPa to about 100 MPa) than compressive peaks for both the man-dibular and maxillary analyses.
The Ankylos implant induced the lowest average and peak values of stress acting on the cortical bone (both in compression and in ten-sion), producing stresses equal to 4 MPa, at the most, at the trabecular bone interface. However, the highest stresses were numerically observed for the NobelDirect and ITI Stan-dard 2 implants on the mandibular segment, and for the ITI Standard 2 implant on the maxillary segment. Average stresses induced by the No-belDirect and ITI Standard 2 implants at the mandibular cortical bone were greater than those of the Ankylos sys-tem by approximately 145% in ten-sion and 290% in compresten-sion (180% considering σVM). Furthermore, when the ITI Standard 2 implant was ana-lyzed, stress values in maxillary corti-cal bone were greater (about 150% in tension, 600% in compression, 300% for the von Mises measure) than for the Ankylos implant. The previously introduced physiological limits in compression, assumed equal to the ultimate bone strength,17,59 were
ex-ceeded at the compact maxillary bone when implants ITI 1, ITI 2, and Bråne-mark were considered, whereas ten-sile bone strength limits were never
reached.
As far as the overloading risk in-dicators for cancellous bone were concerned, tensile peaks were always greater than compressive peaks, and significant concentrations appeared at the trabecular-compact interface, as well as, with smaller values, at the lower end of the implant. Strength of cancellous bone (about 5 MPa17) was
exceeded, primarily in tension, at the concentration areas for all the im-plants except for Ankylos.
DISCUSSION
The 5 commercial osseointegrated implants that were analyzed by finite element simulations exhibited differ-ent stress-based biomechanical behav-ior, dependent on shape parameters and on the site of placement, as well as on the compact bone geometry at the implant neck. For a given implant, placement in the mandibular and max-illary molar segments induced stress distributions that were dissimilar at the bone-implant interface as a con-sequence of different geometries and bone mechanical properties, resulting in higher compressive overloading risk in the maxillary segment. For a given implant, the compressive peaks and average stress at the maxillary cortical bone were about 140% of the values for the mandibular one. Accordingly, proposed quantitative stress analysis may help in understanding the clinical evidence that maxillary implants can have a higher incidence of failure than mandibular implants.7-11
Simulation results considered functioning implants, modelling cr-estal bone loss after a healing and loading period. These results have also highlighted the influence of implant length and diameter on load transfer mechanisms. In agreement with the numerically experienced trend pro-posed by Himmlova et al,39 Holmgren
et al,41 and Bozkaya et al,42 maximum
implant diameter seems to affect stress peaks at the cortical bone but not at the trabecular region, whereas stress values and distribution at the
cancellous bone-implant interface are primarily influenced by implant length. Nevertheless, to control the risk of bone overload and to improve implant biomechanical stress-based performance, numerical results from the current study suggest that implant diameter can be considered to be a more effective design parameter than implant length. In this context, the re-sults of this study can be considered to be complementary to similar, pre-viously published studies.39,41-44 Due
to the simplified and different geo-metrical models usually used in these studies,39,41,42 quantitative
compari-sons cannot be made. Analogously, Carter’s15 hypotheses regarding the
influence of the strain level of the bone on hypertrophic responses or bone resorption cannot be directly verified in a quantitative sense, but numerical simulations of the present study have confirmed that the risk of bone overload essentially affects re-gions around the implant neck.
Stress analysis of implants with similar diameters (such as Nobel-Direct, ITI 1, and Ankylos) highlights the concept that the risk of overload-ing compact bone strongly increases when significant crestal bone loss oc-curs. Accordingly, when crestal bone geometry was modelled by platform switching configurations and sub- crestal positioning (as seen with the Ankylos implant), the best stress-based performance for compact bone was obtained, together with accept-able stress values at the cancellous interface. However, when traditional adaptive bone changes were consid-ered (bone conical remodelling after loading), physiological strength limits were exceeded for both the trabecular and compact bone, inducing the risk of further bone loss and jeopardizing implant effectiveness. These results are qualitatively in agreement with those obtained by Maeda et al,20
al-though the geometries and loads that were used in that study for the finite element analyses were different from those used in the present study.