Gender-specific transcriptional profiles identified in
b-thalassemia patients
by Aikaterini Nanou, Chrisavgi Toumpeki, Pavlos Fanis, Nicoletta Bianchi, Lucia Carmela Cosenza, Cristina Zuccato, George Sentis, Giorgos Giagkas, Coralea Stephanou, Marios Phylactides, Soteroula Christou, Michalis Hadjigavriel, Maria Sitarou, Carsten W. Lederer, Roberto Gambari, Marina Kleanthous, and Eleni Katsantoni
Haematologica 2020 [Epub ahead of print]
Citation: Aikaterini Nanou, Chrisavgi Toumpeki, Pavlos Fanis, Nicoletta Bianchi, Lucia Carmela Cosenza, Cristina Zuccato, George Sentis, Giorgos Giagkas, Coralea Stephanou, Marios Phylactides, Soteroula Christou, Michalis Hadjigavriel, Maria Sitarou, Carsten W. Lederer, Roberto Gambari, Marina Kleanthous, and Eleni Katsantoni. Gender-specific transcriptional profiles identified in b-thalassemia patients.
Haematologica. 2020; 105:xxx doi:10.3324/haematol.2020.248013 Publisher's Disclaimer.
E-publishing ahead of print is increasingly important for the rapid dissemination of science. Haematologica is, therefore, E-publishing PDF files of an early version of manuscripts that have completed a regular peer review and have been accepted for publication. E-publishing of this PDF file has been approved by the authors. After having E-published Ahead of Print, manuscripts will then undergo technical and English editing, typesetting, proof correction and be presented for the authors' final approval; the final version of the manuscript will then appear in print on a regular issue of the journal. All legal disclaimers that apply to the journal also pertain to this production process.
Copyright 2020 Ferrata Storti Foundation.
1 Title:
Gender-specific transcriptional profiles identified in β-thalassemia patients
Short title:
Gender-specific transcriptomics in β-thalassemia
Aikaterini Nanou1, Chrisavgi Toumpeki1, Pavlos Fanis2, Nicoletta Bianchi3, Lucia Carmela Cosenza3, Cristina Zuccato3, George Sentis1, Giorgos Giagkas1, Coralea Stephanou2, Marios Phylactides2, Soteroula Christou4, Michalis Hadjigavriel5, Maria Sitarou6, Carsten W. Lederer2, Roberto Gambari3, Marina Kleanthous2 and Eleni Katsantoni1*
1
Basic Research Center, Biomedical Research Foundation, Academy of Athens, Athens, Greece; 2Molecular Genetics Thalassaemia Department, The Cyprus Institute of Neurology and Genetics, Nicosia, Cyprus; 3Department of Life Sciences and Biotechnology, Ferrara University, Ferrara, Italy; 4Thalassaemia Clinic, Archbishop Makarios III Hospital, Nicosia, Cyprus; 5Limassol General Hospital, Department of Internal Medicine, Limassol, Cyprus; 6Thalassemia Clinic Larnaca, Larnaca General Hospital, Larnaca, Cyprus
*Correspondence: Eleni Katsantoni Basic Research Center
Biomedical Research Foundation, Academy of Athens Soranou tou Ephessiou 4
115.27 Athens Greece Tel office: +30 210 6597444 Tel lab: +30 210 6597439 Fax: +30 210 6597545 [email protected]
2 Letter to Editor
β-thalassemia comprises a group of heterogeneous autosomal recessive hereditary anemias characterized by the reduction or absence of β-globin chain synthesis, and it is a highly prevalent disease affecting 1.5% of the global population.1 Three different clinical conditions are recognized in patients with β-thalassemia minor (trait) being the asymptomatic form, β-thalassemia major (TM) being the most severe form of the disease and β-thalassemia intermedia (TI) presenting with variable severity. Despite extensive characterization of the genetic basis of disease pathogenesis2, currently the classification of patients relies on the severity of symptoms and HbF levels regardless of the underlying genotype. Thus, the aim of the study was to develop an approach for patient stratification based on gene expression, pinpoint the targets that dictate each phenotype and provide a framework for the development of therapeutic strategies focused on these targets. To this end, we have analysed the gene expression profiles of TI, TM and healthy individuals using RNA-seq (NCBI, GSE117221) and we have studied the differentially expressed genes (DEGs) and pathways irrespective to patient genotype. Interestingly, after analysis of various confounding factors, we identified gender differences in the patients’ expression profiles suggesting that males and females are differentially affected by β-thalassemia. Thus, taking gender into account might benefit prognosis, diagnosis, stratification and therapeutic management of the disease.
In particular, 49 subjects (after exclusion of low quality samples) were included in the analysis and organized in groups of three age- and gender-matched samples within each group (Tables S1-2). RNA-seq libraries were generated from erythroid precursor cell cultures after the isolation of peripheral blood mononuclear cells from all participants, as previously described.3 We identified 716 genes with aberrant expression between TI patients and healthy subjects, and 2885 between TM patients and healthy subjects with most of DEGs seen in TI patients being also present in TM patients when compared to healthy subjects, albeit with more pronounced changes (Figure 1A; Tables 1, S3-5). However, no significantly DEGs were found when TM patients were compared directly to TI patients suggesting that either the global gene expression profile was very similar between the two types of the disease or that substantial variability in expression did not allow the identification of consistent changes, or both (Table S6). In general, only small changes were detected when TM and TI were directly compared (Figure 1B) and the increased gene expression variability seen in TI patients, which did not allow the identification of the same number of significantly DEGs as in the case of TM patients, also hindered the identification of DEGs between TI and TM patients. Increased gene expression variability in TI potentially reflects the high level of phenotypic heterogeneity for TI patients.
Nonetheless, the expression profiles accurately portrayed the clinical
observations of β-thalassemia. The severe TM phenotype was associated with
induction of organismal injuries, as well as inhibition of key haematological system genes and inflammatory response molecules compared to the less severe type of the disease (TI) (Figure 1C-D, Table S7). Moderate changes were seen in the expression levels of various globin and other interacting proteins in TI patients, whereas in TM patients the data portrayed the marked repression of β-thalassemia-related proteins with concomitant up-regulation of other globin proteins as a means of compensating for the ineffective erythropoiesis (Figure S1). Focusing on molecular pathways affected by the disease, gene set enrichment analysis (GSEA) revealed very similar
3
pathways in both TI and TM patients as differentially represented when compared to healthy participants, in accordance with the gene expression profiles (Figure S2). Several of the pathways identified have been previously linked to β-thalassemia validating our results, such as the impaired packaging of telomere ends4, impaired unfolded protein response (UPR) pathway5 and lipid abnormalities6, 7. Nonetheless, the lack of significant changes between TI and TM patients in terms of global gene expression profiles or molecular pathways suggest that a continuous spectrum describes the disease and not distinct conditions.
We then sought for other biological confounders that could affect global expression patterns allowing patient stratification, since the study was designed to limit as much as possible all technical sources of variation (balanced groups in terms of gender and age, standardized cell culture protocol in all centers with the matched samples being cultured at the same time, library construction performed by a single user and balanced sequencing runs). Distinct analyses performed per research center, age group and other clinical characteristics of the patients (such as HbF levels and presence or absence of splenectomy, hepatomegaly, extramedullary hematopoiesis or bone deformities) were not able to detect any major differences in the expression profiles. To further explore the data, we performed Principal Component Analysis (PCA), which visualizes strong patterns in a dataset by reducing the dimensionality of the dataset and clustering of samples based on their similarity. PCA did not yield clear clustering when taken into account all the different patient characteristics, with the striking exception of gender, where all samples were clustered into two distinct groups representing males and females irrespective of the disease status (Figure 2A). Although a clear distinction between males and females was anticipated, it raised the question whether the two genders were affected in distinctive ways by the disease. To examine such a possibility, same gender analysis between healthy participants and patients was performed expecting fewer changes due to the lower number of samples used per differential expression analysis (from 49 participants, 23 were males and 26 were females) and similar DEGs between genders, as β-thalassemia presents with similar phenotype in both genders and it has not been linked to gender-defining genes. Interestingly, very different results were yielded for males and females suffering from TI against healthy participants, with 1559 DEGs in males, but only 14 DEGs in females (Tables 1, S8-S9). The very low number of DEGs in females highlights the increased biological variability seen in females and suggests that other factors might play an important role in determining the disease outcome. When comparing the significantly DEGs identified in both male and female TI patients with the genes identified only in male TI patients, a significant overlap was seen in down-regulated genes, not only in terms of specific genes, but also in terms of gene functionality through Gene Ontology (GO) terms (Figures 2B, S3A-B; Table S5). In contrast, in up-regulated genes, fewer common genes were identified and fewer similarities in their functionality suggesting less conserved changes. Different results were also found for males and females suffering from TM when compared to healthy participants, albeit less prominent, with 441 DEGs identified in males and 310 DEGs in females (Tables 1, S10-S11). Furthermore, the overwhelming majority of genes identified in either male or female TM patients were also yielded when all TM patients were analysed against healthy subjects irrespective of the gender (Figures 2C, S3C-D; Table S5). The limited number of deregulated genes in common between female and male TM patients could demonstrate gender-specific differences, further supported by the association of different terms related to diseases and body functions in male and female patients when compared to same gender healthy subjects (Figure
4
S4). Dissection of the molecular pathways involved through pathway and GO analysis revealed pathways with opposing status between males and females, such as the production of nitric oxide and reactive oxygen species in macrophages, and glioma invasiveness signalling (Figures 2D-F, S4). Per gender, all the significant DEGs identified exhibited a unanimous direction of transcription, but different members of the pathway were differentially expressed in males and females. The DEGs identified in male or female TI and TM patients could be potentially invaluable for the development of gender-specific treatment options and stratification strategies (Table S5, S12-S13, Figure S5).
To our knowledge no other studies exist comparing gene expression profiles in males and females suffering from β-thalassemia, however, there have been reports of correlations of disease symptoms or complications related to gender. For instance, HbF levels have been found significantly higher in the female population of TM patients and this difference became more apparent after the age of 30 years.8 When considering complications of the disease, male TM patients have shown a strong association with diabetes9 and although no clear reason currently exists for such an association, it can be partly attributed to increased sensitivity of males to iron overload.10 Better survival rate has also been reported in females rather than males with fewer occurrences of cardiac complications and cardiac-based morbidities.11 In terms of development of osteoporosis and osteopenia in TM patients, a gender difference was seen in the prevalence and the severity of the disorder with males being more frequently and severely affected than females.12 In general, various pathways have been found to exhibit gender-related differences, many of which are linked to β-thalassemia, such as oxidative stress defense13, lipid metabolism14 and erythropoietin activity15. The present study, besides the identification of gender-specific transcriptional profiles in β-thalassemia through public availability of our data, represents a novel resource for meta-analyses and follow-up studies. In conclusion, our data highlight the need for considering gender as an important variable of the disease, which should be taken into account when developing differential diagnostic and therapeutic strategies.
Acknowledgements
The authors would like to thank Dr. Sjaak Philipsen for critical reading of the manuscript, GeneCore/EMBL for sequencing support and Panayiota Papasavva for helpful discussions. This work was supported by the European Union’s FP7 THALAMOSS (Project number 306201 to E.K., R.G., M.K.), the European Union’s Horizon 2020 research and innovation programme under the Marie Skłodowska-Curie grant agreement No 813091 (E.K.) and by the Republic of Cyprus through the Research Promotion Foundation under grants agreements YΓΕΙΑ/ΒΙΟΣ0609 (ΒΕ)/01 (E.K., M.K.) and ΥΓΕΙΑ/ΒΙΟΣ/0311(ΒΕ)/20 (M.K.).
Conflict-of-interest disclosure: The authors declare no competing financial interests. Correspondence: Eleni Katsantoni, Basic Research Center, Biomedical Research Foundation, Academy of Athens, Soranou tou Ephessiou 4, 115.27 Athens, Greece;
5 References
1. Colah R, Gorakshakar A, Nadkarni A. Global burden, distribution and
prevention of beta-thalassemias and hemoglobin E disorders. Expert Rev Hematol. 2010;3(1):103-117.
2. Thein SL. Genetic Basis and Genetic Modifiers of beta-Thalassemia and
Sickle Cell Disease. Adv Exp Med Biol. 2017;1013:27-57.
3. Cosenza LC, Breda L, Breveglieri G, et al. A validated cellular biobank for beta-thalassemia. J Transl Med. 2016;14(1):255.
4. Chaichompoo P, Pattanapanyasat K, Winichagoon P, Fucharoen S, Svasti S.
Accelerated telomere shortening in beta-thalassemia/HbE patients. Blood Cells Mol Dis. 2015;55(2):173-179.
5. Lithanatudom P, Leecharoenkiat A, Wannatung T, Svasti S, Fucharoen S,
Smith DR. A mechanism of ineffective erythropoiesis in beta-thalassemia/Hb E disease. Haematologica. 2010;95(5):716-723.
6. Amendola G, Danise P, Todisco N, D'Urzo G, Di Palma A, Di Concilio R.
Lipid profile in beta-thalassemia intermedia patients: correlation with erythroid bone marrow activity. Int J Lab Hematol. 2007;29(3):172-176.
7. Livrea MA, Tesoriere L, Maggio A, D'Arpa D, Pintaudi AM, Pedone E.
Oxidative modification of low-density lipoprotein and atherogenetic risk in beta-thalassemia. Blood. 1998;92(10):3936-3942.
8. el-Hazmi MA, Warsy AS, Addar MH, Babae Z. Fetal haemoglobin
level--effect of gender, age and haemoglobin disorders. Mol Cell Biochem. 1994;135(2):181-186.
9. Pes GM, Tolu F, Dore MP. Anti-Thyroid Peroxidase Antibodies and Male
Gender Are Associated with Diabetes Occurrence in Patients with Beta-Thalassemia Major. J Diabetes Res. 2016;2016:1401829.
10. Marsella M, Borgna-Pignatti C, Meloni A, et al. Cardiac iron and cardiac
disease in males and females with transfusion-dependent thalassemia major: a T2* magnetic resonance imaging study. Haematologica. 2011;96(4):515-520.
11. Marsella M, Pepe A, Borgna-Pignatti C. Better survival and less cardiac
morbidity in female patients with thalassemia major: a review of the literature. Ann N Y Acad Sci. 2010;1202:129-133.
12. Kyriakou A, Savva SC, Savvides I, et al. Gender differences in the prevalence and severity of bone disease in thalassaemia. Pediatr Endocrinol Rev. 2008;6 Suppl 1:116-122.
13. Kander MC, Cui Y, Liu Z. Gender difference in oxidative stress: a new look at the mechanisms for cardiovascular diseases. J Cell Mol Med. 2017;21(5):1024-1032.
14. Link JC, Reue K. Genetic Basis for Sex Differences in Obesity and Lipid
Metabolism. Annu Rev Nutr. 2017;37:225-245.
15. Soliz J, Khemiri H, Caravagna C, Seaborn T. Erythropoietin and the
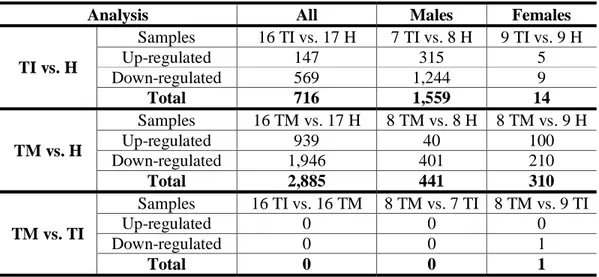
6 Table 1. Numbers of significantly differentially expressed genes. Numbers of
significantly differentially expressed genes are shown for all comparisons performed. The analysis is produced by DESeq2 and differentially expressed genes were defined as significant when padj < 0.1.
Analysis All Males Females
TI vs. H Samples 16 TI vs. 17 H 7 TI vs. 8 H 9 TI vs. 9 H Up-regulated 147 315 5 Down-regulated 569 1,244 9 Total 716 1,559 14 TM vs. H Samples 16 TM vs. 17 H 8 TM vs. 8 H 8 TM vs. 9 H Up-regulated 939 40 100 Down-regulated 1,946 401 210 Total 2,885 441 310 TM vs. TI Samples 16 TI vs. 16 TM 8 TM vs. 7 TI 8 TM vs. 9 TI Up-regulated 0 0 0 Down-regulated 0 0 1 Total 0 0 1 Figure Legends
Figure 1. Differential gene expression analysis of TI or TM patients against healthy participants. (A) Venn diagram depicting common significantly DEGs when
TI (N = 16) or TM (N = 16) patients were compared to healthy (H) participants (N = 17). (B) Heatmap depicting relative normalized gene expression levels (z score) of all 2999 genes that were found significantly differentially expressed in TI or TM patients when compared to healthy participants. The log2FoldChange values of the genes used
range from -3.0 to 3.0. (C-D) Mosaic graphs produced by IPA depicting enriched
terms regarding diseases and biological functions when TI patients were compared to healthy participants (C) or when TM patients were compared to healthy participants (D). The z-score depicts predicted inhibition or activation of disease/function, whereas the size of the box represents the significance of each identified term (-log10pValue). Due to visualization purposes, category labels are not shown in full, but
detailed enrichment terms can be found in Table S7.
Figure 2. Differential gene expression analysis of β-thalassemia patients against healthy participants according to gender. (A) PCA graph showing clustering of
samples according to gender irrespective of disease status. (B-C) Circοs plots depicting the down-regulated (left) and up-regulated (right) significantly DEGs when TI (B) or TM (C) patients were analysed against healthy participants. Outer circle represents the type of analysis with red depicting analysis of all samples (16 TI or 16 TM samples), green depicting analysis of male samples only (7 TI or 8 TM samples) and blue depicting analysis of female samples only (9 TI or 8 TM samples). Inner circle represents the overlap with dark orange depicting genes that exist in multiple lists and light orange depicting genes that are unique to that particular list. Purple lines link the same genes when shared by multiple lists, whereas blue lines link different genes that fall into the same ontology term. (D) Heatmap produced by IPA depicting enriched terms regarding canonical pathways when all TM patients were analyzed against healthy participants, male only TM patients were analyzed against healthy males or female only TM patients were analyzed against healthy females. The
7
activation z-score depicts predicted inhibition or activation of the pathway. (E-F) Heatmaps produced by IPA for two example canonical pathways; Glioma Invasiveness Signaling (E) and Production of Nitric Oxide and Reactive Oxygen Species in Macrophages (F). The heatmaps depict gene expression levels (Expression Log Ratio, i.e. log2FoldChange), whereas the boxes above the heatmaps depict the
z-score corresponding to panel D and showing the predicted inhibition or activation of the pathway.
1 Haematologica
Supplemental Data
Gender-specific transcriptional profiles identified in β-thalassemia patients.
A. Nanou, C. Toumpeki, P. Fanis, N. Bianchi, L.C. Cosenza, C. Zuccato, G. Sentis, G. Giagkas, C. Stephanou, M. Phylactides, S. Christou, M. Hadjigavriel, M. Sitarou, C. W. Lederer, R. Gambari, M. Kleanthous and E. Katsantoni.
2
Supplemental Methods
ParticipantsAll participants were enrolled to the study after submission of written informed consent according to the Declaration of Helsinki and approval by the Ethical Committee of Ferrara Hospital, the Ethical Committee of Rovigo Hospital or the Cyprus National Bioethics Committee, as appropriate. 24 samples were collected from the Ferrara and Rovigo Hospitals in Italy (8 healthy subjects, 8 TI patients and 8 TM patients) and 30 samples were collected from the Thalassemia Clinics in Nicosia and Larnaca, the Limassol General Hospital and the Cyprus Institute of Neurology and Genetics in Cyprus (10 healthy subjects, 10 TI patients and 10 TM patients). All samples were organized in 18 groups, each one consisting of one TI patient, one TM patient and one healthy subject (Table S1). All samples per group originated from the same research center or hospital were cultured at the same time, and were gender- and age-matched. The average SD for age per group of matched samples was 1.83 years (range 0.58-3.46 years).
Erythroid Precursor Cell (ErPC) cultures
Separation of PBMCs from peripheral blood was performed using Lympholyte-H Cell Separation Media (Cedarlane Labs), and CD34+ cells were isolated using anti-human CD34+ beads and two rounds of enrichment on pre-chilled and equilibrated MACS LS columns (Miltenyi Biotec). The cells were resuspended in 5 ml expansion medium StemSpan SFEM II (STEMCELL Technologies) supplemented with 1% CC-100 Cytokine Cocktail (STEMCELL Technologies), 2 U/mL erythropoietin, 10-6 M dexamethasone and 1x Penicillin/Streptomycin solution. Cell confluency was maintained below 0.5x10⁶ cells/ml during expansion, and erythroid differentiation was initiated around the 14th day of expansion. Expansion time was variable across all samples and unrelated to the analysis group (healthy, TI, TM).
For erythroid differentiation, cells were resuspended in differentiation medium containing 70% MEMα (Corning Cellgro), 30% defined FBS (HyClone Defined FBS), 10-5 M 2-mercapto-ethanol, 10 U/ml erythropoietin, 10 ng/ml Stem Cell Factor and 1x Penicillin/Streptomycin solution. ErPC cultures were characterized using flow cytometry staining for surface markers prior to and after differentiation (at the 11th and 13th day of expansion, and at the 4th day of differentiation). The antibodies used for characterization of differentiation stage included APC-conjugated mouse anti-human CD235a monoclonal antibody (BD Pharmingen, 551336), PE-conjugated mouse anti-human CD117 monoclonal antibody (eBioscience, 12-1178-42), PE-conjugated mouse anti-human CD29 monoclonal antibody (eBioscience, 12-0299-42) and PE/Cy7-conjugated rat anti-human CD44 monoclonal antibody (Biolegend, 103030). Cells for RNA-seq analysis were collected on the 4th day of differentiation, where levels of differentiation and cell death were similar between all three analysis groups, as assessed by flow cytometry and visual inspection after cytocentrifugation. Library Preparation and Sequencing
Total RNA extraction was performed using Tri Reagent (Sigma) and RNA quality was verified prior to library construction using spectrophotometry, electrophoresis and measurement of RNA Integrity Number (RIN) values using an Agilent Bioanalyzer 2100 (RNA 6000 Nano Kit, Agilent, 5067-1511). The RNA-seq libraries were constructed using the TruSeq RNA Sample Preparation kit v2 (Illumina RS-122-2001) using 1.5-2.0 μg of total RNA according to manufacturer’s instructions. All sequenced libraries contained single-end reads with no strand specificity and the read
3 lengths were 50-51 bp depending on the library (Table S2). An Agilent Bioanalyzer 2100 was used to perform quality control of the RNA-seq libraries (DNA chips 1000, Agilent, 5067-1504) and all libraries were sequenced on the Illumina HiSeq2000 high-throughput sequencer.
NGS Data Analysis
After sequencing, quality control of all libraries was performed using the FastQC algorithm.1 Trimming of library reads due to low base-calling quality (1-3 bp from the start of the read) and removal of primer/adapter sequences was performed using Trimmomatic (v0.30),2 if necessary. The reads were then aligned to the human transcriptome (hg38), allowing for split reads, using TopHat2.3 HTSeq (v0.5.4)4 was used for expression quantification and DESeq2 (v1.8.1)5 for differential expression analysis with normalization steps for eliminating batch effects using the ‘groups’ as blocking factor. After analysis, five samples (1 healthy subject, 3 TI patients and 1 TM patient) were excluded from further studies due to the low quality of sequencing or alignment efficiency. In addition, one TM patient was re-classified by medical personnel to TI after the patient selection and library construction. After DE analysis and multiple testing correction, differentially expressed genes were defined as significant when padj < 0.1 in all the performed analyses. More information regarding the patients and libraries quality can be found in the Supplementary Data (Tables S1-S2).
For visualization of expression levels, data matrices were created and represented as heatmaps using the Java TreeView software.6 Gene set enrichment analysis (GSEA) was performed by ranking the genes according to their log2FoldChange values (pre-ranked analysis option) and testing them against datasets from the Molecular Signatures Database (MSigDB v6.1).7 Gene Ontology (GO) analysis was also performed using Metascape8 either for single gene lists or for comparison of GO terms between multiple lists. Moreover, the data were further explored using the Ingenuity Pathway Analysis (IPA, Qiagen Inc.) for additional interpretation.9 Data have been deposited in NCBI10 and are accessible through accession number GSE117221.
Validation by Reverse Transcriptase quantitative PCR (RT-qPCR)
19 participants from Cyprus and Italy were recruited and CD34+ cells isolation/cultures were performed as described above (ErPC cultures). Total RNA was extracted using Trizol (Sigma), treated with RQ1 RNase-Free DNaseI (Promega) and reverse transcribed with MMLV Reverse Transcriptase (Invitrogen), as previously described.11, 12 Real-time PCR was performed with SYBR Green on an ABI PRISM 7000 Sequence Detection System (Applied Biosystems). The amount of template was normalized using primers for HPRT11 and specific gene primer sequences (5'-3') are:
ELF3: CAGATGTCATTGGAGGGTACAG (F), CTTCTCCACTTGGTAGCTGATC
(R); SAA1: CCATTCTGAAGGTGTCTTATCTCC (F), GCCAAGGAACGAA AAGAAGC (R); TACC2: AAAAGGAAGCAGCAGGACA (F), CAGAACTC TCAGAAGCGGTG (R). The relative quantitation was performed using the ΔΔCt method.13 The log2FC values were calculated from the ratios of the ΔΔCt values for TMM vs HM, TMF vs HF, TIM vs HM, TIF vs HF, and compared to RNA-seq data (DESeq2 log2FC).
4
Supplemental Results
To validate the RNA-seq data, RT-qPCR was performed in randomly selected differentially expressed genes. The genes tested show a corresponding change in expression for RT-qPCR and RNA-seq analyses, with different levels for each method, owing to differences in sample numbers and methodology. However, similar trend was seen for both methods validating gender-related differences that will be further explored with greater patient numbers in future studies (Figure S5).
References
1. Andrews S. FastQC A Quality Control tool for High Throughput Sequence Data.[cited; from: http://www.bioinformatics.babraham.ac.uk/projects/fastqc/]
2. Bolger AM, Lohse M, Usadel B. Trimmomatic: a flexible trimmer for Illumina sequence data. Bioinformatics. 2014 Aug 1;30(15):2114-20.
3. Kim D, Pertea G, Trapnell C, Pimentel H, Kelley R, Salzberg SL. TopHat2: accurate alignment of transcriptomes in the presence of insertions, deletions and gene fusions. Genome biology. 2013;14(4):R36.
4. Anders S, Pyl PT, Huber W. HTSeq--a Python framework to work with high-throughput sequencing data. Bioinformatics. 2015 Jan 15;31(2):166-9.
5. Love MI, Huber W, Anders S. Moderated estimation of fold change and dispersion for RNA-seq data with DESeq2. Genome biology. 2014;15(12):550.
6. Saldanha AJ. Java Treeview--extensible visualization of microarray data. Bioinformatics. 2004 Nov 22;20(17):3246-8.
7. Subramanian A, Tamayo P, Mootha VK, et al. Gene set enrichment analysis: a knowledge-based approach for interpreting genome-wide expression profiles. Proc Natl Acad Sci U S A. 2005 Oct 25;102(43):15545-50.
8. Tripathi S, Pohl MO, Zhou Y, et al. Meta- and Orthogonal Integration of Influenza "OMICs" Data Defines a Role for UBR4 in Virus Budding. Cell Host Microbe. 2015 Dec 9;18(6):723-35.
9. Kramer A, Green J, Pollard J, Jr., Tugendreich S. Causal analysis approaches in Ingenuity Pathway Analysis. Bioinformatics. 2014 Feb 15;30(4):523-30.
10. Edgar R, Domrachev M, Lash AE. Gene Expression Omnibus: NCBI gene expression and hybridization array data repository. Nucleic acids research. 2002 Jan 1;30(1):207-10.
11. Theodorou M, Speletas M, Mamara A, et al. Identification of a STAT5 target gene, Dpf3, provides novel insights in chronic lymphocytic leukemia. PLoS One. 2013;8(10):e76155.
12. Nanou A, Toumpeki C, Lavigne MD, et al. The dual role of LSD1 and HDAC3 in STAT5-dependent transcription is determined by protein interactions, binding affinities, motifs and genomic positions. Nucleic Acids Res. 2017 Jan 9;45(1):142-54.
13. Livak KJ, Schmittgen TD. Analysis of relative gene expression data using real-time quantitative PCR and the 2(-Delta Delta C(T)) Method. Methods. 2001 Dec;25(4):402-8.
5
Supplemental Figures
Figure S1. Protein networks in β-thalassemia. Key proteins in β-thalassemia are depicted and colored according to their gene expression levels (green depicts down-regulation and red depicts up-down-regulation), as produced by the Ingenuity Pathway Analysis (IPA) program. Only significantly differentially expressed genes are colored according to log2(Fold Change) values (padj < 0.1). Solid lines show direct interactions, whereas dotted lines show indirect interactions. (A) Gene expression levels were determined after differential expression analysis of TI patients (N = 16) against healthy (H) participants (N = 17). (B) Gene expression levels were determined after differential expression analysis of TM patients (N = 16) against healthy participants (N = 17).
Figure S2. Molecular pathways affected by β-thalassemia. Gene Set Enrichment Analysis (GSEA) was performed by ranking all genes according to their log2FoldChange values (pre-ranked analysis option) and testing them against datasets from the Molecular Signatures Database. Positive Normalized Enrichment Score (NES) shows enrichment of term in the up-regulated genes, whereas negative NES shows enrichment of term in the down-regulated genes. The molecular pathways identified were yielded after comparison of all TI patients against healthy subjects (A), all TM patients against healthy subjects (B) or after all TM patients against all TI patients (C). Only the top statistically significant terms are shown (FDR q-value < 0.01).
Figure S3. Comparing differentially expressed genes in male and female β-thalassemia patients. (A-B) Venn diagrams depicting common and unique differentially expressed genes showing down- or up-regulation when comparing analyses of all TI patients against healthy subjects (16 TI vs. 17 H), males only (7 TI vs. 8 H) or females only (9 TI vs. 9 H). (C-D) Venn diagrams depicting common and unique differentially expressed genes showing down- or up-regulation when comparing analyses of all TM patients against healthy subjects (16 TM vs. 17 H), males only (8 TM vs. 8 H) or females only (8 TM vs. 9 H).
Figure S4. Gene ontology analysis and gender bias in β-thalassemia. Mosaic graphs produced by IPA depicting enriched terms regarding diseases and body functions per gender. For better visualization, category labels are not shown in full, but detailed enrichment terms can be found in Table S7. (A) On the left, female TI patients (N = 9) were compared to healthy female participants (N = 9) and on the right male TI patients (N = 7) were compared to healthy male participants (N = 8). (B) On the left, female TM patients (N = 8) were compared to healthy female participants (N = 9) and on the right male TM patients (N = 8) were compared to healthy male participants (N = 8). The z-score depicts predicted inhibition or activation of disease/function, whereas the size of the box signifies the possibility of a non-random association (-log10pValue).
Figure S5. Validation of RNA-seq data by RT-qPCR. Relative mRNA expression levels for selected genes were measured by RT-qPCR. The samples used (N=19) included TM patients [N=7, males (N=4), females (N=3)], TI patients [N=6, males (N=3), females (N=3)] and healthy participants [N=6, males (N=3), females (N=3)]. For RT-qPCR (left) the histograms represent the log2FoldChange values calculated from the ratios of the ΔΔCt values for TMM vs HM, TMF vs HF, TIM vs HM, TIF vs
6 HF and for RNA-seq (right) the histograms represent the DESeq2 log2FoldChange values for the same comparisons; M: male, F: female.
7
Supplemental Tables as Excel file only
Table S1. List of participants used in transcriptomics analysis. The table presents all the participants recruited, as organized in age- and gender-matched groups.
Table S2. List of RNA-seq libraries generated from healthy participants, TI and TM patients. The library size is shown, as well as alignment information to reference genome of each library.
Table S3. Differential expression analysis of TI patients (N=16) versus healthy participants (N=17). The analysis is produced by DESeq2. All significantly differentially expressed genes with p-adjusted value below 0.1 are highlighted in red. Table S4. Differential expression analysis of TM patients (N=16) versus healthy participants (N=17). The analysis is produced by DESeq2. All significantly differentially expressed genes with p-adjusted value below 0.1 are highlighted in red. Table S5. Common and unique genes that show significant differential gene expression between different analyses. The following comparisons are included in the Table: a. DE genes of (TI vs. H) and (TM vs. H) analyses, b. down-regulated DE genes of (TI vs. H) analysis present in males, females and all participants, c. up-regulated DE genes of (TI vs. H) analysis present in males, females and all participants, d. down-regulated DE genes of (TM vs. H) analysis present in males, females and all participants and up-regulated DE genes of (TM vs. H) analysis present in males, females and all participants.
Table S6. Differential expression analysis of TM patients (N=16) versus TI patients (N=16). The analysis is produced by DESeq2.
Table S7. List of enriched disease terms presented in mosaic plots (Figure 1C-D, Figure S4) according to differential expression levels, as produced by IPA software. The lists include the terms, the p-value generated, the z-score, as well as the molecules represented by each term; IPA: Ingenuity Pathway Analysis.
Table S8. Differential expression analysis of female TI patients (N=9) versus female healthy participants (N=9). The analysis is produced by DESeq2. All significantly differentially expressed genes with p-adjusted value below 0.1 are highlighted in red.
Table S9. Differential expression analysis of male TI patients (N=7) versus male healthy participants (N=8). The analysis is produced by DESeq2. All significantly differentially expressed genes with p-adjusted value below 0.1 are highlighted in red. Table S10. Differential expression analysis of female TM patients (N=8) versus female healthy participants (N=9). The analysis is produced by DESeq2. All significantly differentially expressed genes with p-adjusted value below 0.1 are highlighted in red.
Table S11. Differential expression analysis of male TM patients (N=8) versus male healthy participants (N=8). The analysis is produced by DESeq2. All
8 significantly differentially expressed genes with p-adjusted value below 0.1 are highlighted in red.
Table S12. Differential expression analysis of female TM patients (N=8) versus female TI patients (N=9). The analysis is produced by DESeq2. The significantly differentially expressed gene with p-adjusted value below 0.1 is highlighted in red. Table S13. Differential expression analysis of male TM patients (N=8) versus male TI patients (N=7). The analysis is produced by DESeq2.
9 Figure S1
A
B
TI vs. H analysis TM vs. H analysis10 Figure S2
A
B
11 Figure S3 Males All Females 815 138 422 7 2 Males All Females 251 62 81 2 1 2 TI vs. H Down-regulated TM vs. H Down-regulated Up-regulated TM vs. H Males Females All 1429 316 141 60 9 25 All Females Males 819 27 89 7 4 9
A
B
C
D
TI vs. H Up-regulated12 Figure S4
Females Males Females Males
TI vs. H TM vs. H
-6.5 7.5
z-score
13 Figure S5