1
Potential Biomarkers of thyroid neoplasia: the impact of
proteomics analysis in the diagnosis.
Summary
Fine-needle aspiration cytology (FNA) is the most important tool to correctly
address a thyroid lesion. Thyroid cancers account for about 5% of all lesions.
A correct diagnosis may be difficult using FNA. Thyroid biomarkers help to
better characterized thyroid lesions. Among the new techniques, proteomics ,
since 2002, has been increasingly used. In this thesis we describe the results
obtained by the proteomic analysis of thyroid FNA to detect potential
biomarkers for thyroid neoplasia and its impact in clinical management of
2
INTRODUCTION
The most important diagnostic approach to distinguish between benign and
malignant thyroid nodules is represented by fine-needle aspiration cytology
(FNA)1,2. Malignant thyroid tumors account for about 5% of all thyroid
lesions3,4. A correct diagnosis of FNA samples may sometimes be difficult
using the traditional tools5-6. Recently, the discovery of thyroid biomarkers
has led to the identification of various proteins which help to better
characterized thyroid lesions6-8. Among the new techniques, since 2002,
proteomics has been used to differentiate thyroid malignancies from benign
lesions9-14. The aim of this thesis is to describe the results obtained by the
proteomic analysis of thyroid FNA to detect potential biomarkers for thyroid
neoplasia and its impact in clinical management of thyroid malignancies.
PATIENT AND METHODS
Chemicals
Iodoacetamide (IAA), CHAPS, urea, thiourea, glycerol, SDS, TEMED,
ammonium persulfate, glycine, 30% acrylamide-N,N,N-bisacrylamide,
trifluoroacetic acid (TFA), HEPES and copper sulphate were acquired from
Sigma-Aldrich (St. Louis, MO, USA). Sodium chloride (NaCl), acetonitrile
(ACN) from J.T. Baker. Sodium acetate, Trizma base, SDS, DTT and
3
3–10 NL and dry strip cover fluid were purchased from GE Health Care,
Europe (Uppsala, Sweden). Coomassie Brilliant Blue G 250 was from Merck
(Darmstadt, Germany). All other reagents were supplied by standard
commercial sources and were of the highest grade available.
Patients
The study was conducted between October 2005 and April 2010. A full
clinical evaluation and routine laboratory tests were performed and all
patients. Inclusion criteria were represented by normal preoperative values of
free F-T3, F-T4 and thyroid stimulating hormone (TSH). Detectable serum
anti-thyroid peroxidase (Ab-TPO) and anti-thyroglobulin antibodies (Ab-Tg)
were considered exclusion criteria to dismiss patients from the study. Therapy
with L-thyroxine at the time of the surgery was also considered as an
exclusion criterion. An informed consensus was obtained from all patients for
diagnostic or clinical purposes. The study was approved by the local Ethics
Committee. The normal and malignant nature of FNA samples was assessed
by histological analysis6. Formalin-fixed and paraffin-embedded samples of
thyroid tissues were stained by hematoxylin and eosin (E&E). Definitive
diagnoses of benign lesion or thyroid carcinoma were performed in
accordance with the guidelines of the World Health Organization (WHO) 3.
4
62 female patients. Mean age (years, ±SD) was 47.2 ±14.0 years (range
22-75). A surgical procedure of total thyroidectomy was achieved in all patients.
Sample collection and preparation
Immediately after surgical removal of the thyroid, a FNA with a 23G needle
was performed by the surgeon on the suspected nodule. The same procedure
was performed in the normal tissue (control sample) of the opposite lobe.
After passing the needle through the tissue 3 or 4 times, 4 mL of saline
solution were aspirated with the same syringe. This fluid collected was
immediately centrifuged at 2300g for 20 min at 4 °C and processed. Proteins
from resulting supernatants were precipitated using 10% (w/v) trichloroacetic
acid (TCA) and 0.05% ditiothreitol (DTT). After incubation at 0 °C for 1 h,
the insoluble material was pelleted at 14000g. The pellets were washed three
times with pure acetone, air-dried and solubilized in 7 M urea, 2 M thiourea,
4% CHAPS, 60 mM DTT, 0.5% 3-10 ampholytes and 0.002% bromophenol
blue (rehydration solution). The amount of protein was estimated by means of
a RC DC protein assay from Bio-Rad. The protein amount was determined
using Bio-Rad RC DC-protein assay. Bovine serum albumin (BSA) was used
5
2-DE analysis
For analytical gels, 150 μg of proteins, for each sample, were filled up to 350 μl in 7M urea, 2M thiourea, 4% CHAPS, 60mM DTT, 0.5% 3-10 ampholytes
and 0.002% bromophenol blue (rehydration solution). Isoelectrofocusing
(IEF) was carried out by using 18 cm Immobiline Dry-Strips (GE Healthcare)
with a non linear, pH 3-10, gradient. IEF was performed at 16°C on an Ettan
IPGphor II apparatus (Amersham Biosciences), according to the following
schedule: the samples were applied by in-gel rehydration for 10 h using low
voltage (30 V), then the voltage was linearly increased from 200 to 5000
during the first 4 h, and then the proteins were focused for up to 70 000Vh at
a maximum voltage of 8000 V. To prepare the IPG strips for the second
dimension, the strips were first equilibrated 15 min at room temperature in a
buffer containing 50 mM Tris-HCl, pH 8.8, 6 M Urea, 30% glycerol, 2%
SDS, 0.002% bromophenol blue, 1% DTT, followed by a second
equilibration for 10 min in the same buffer except that DTT was replaced by
2.5% IAA. Subsequently, the IPG strips were applied horizontally on top of
12.5% SDS-polyacrylamide gels (20x18x0.15 cm) and electrophoresis was
performed using the PROTEAN-II Multi Cell system (Bio-Rad) with constant
amperage (40mA/gel) at 10 °C until the dye front reached the bottom of the
6
Staining and image analysis
The analytical gels were stained with ammoniacal silver nitrate. The
procedure of silver staining consisted of five sequential phases including
protein fixation, sensitization, silver impregnation, image development and
stopping. To ensure that the spot staining was within the values of the
linearity range, the silver stain was performed in standard conditions of time
and temperature. All solutions were kept at 4°C, except for silver solution,
while room temperature was controlled at 18°C. All steps were performed on
an orbital shaker. Briefly, at the end of the second dimension run, the gels
were removed from the glass plates, washed in deionized water for 5 min,
soaked in ethanol: acetic acid: water (40: 10: 50) for 1 hour and then soaked
in ethanol: acetic acid: water (5: 5: 90) overnight. After protein fixation, the
gels were washed in deionized water for 5 min at 4°C and soaked in a solution
containing glutaraldehyde (1%) and sodium acetate (0.5 M) for 30 min. After
washing 3 times in deionized water for 10 min at 4°C, the gels were soaked
twice in a 2.7 naphtalene-disulfonic acid solution (0.05% w/v) for 30 min at 4
°C in order to obtain homogeneous dark brown staining of the proteins. Then
the gels were rinsed 4 times in deionized water for 15 min at 4 °C. Staining
was carried out in a freshly made ammoniacal (30%) silver nitrate (2.5%)
solution for 30 minutes at 18 °C. After staining, the gels were washed 4 times
7
containing citric acid (0.01% w/v) and formaldehyde (0.1% v/v) for 5
minutes. Development was stopped with a solution containing Tris (0.4M)
and acetic acid (2% v/v). The stained gels were scanned using an Epson
Expression 1680 Pro scanner and the images were analyzed using
Image-Master 2D Platinum 6.01 (GE Health Care Europe, Uppsala). Spots were
automatically detected, manually edited and then counted. After spot
detection in gels, a match set and a synthetic image for each class was
generated. A synthetic gel was obtained by averaging the positions, shapes,
and optical densities of the matched spots in the set of gels class. This
produces an intersection of all the gels, showing only the spots found in
almost 75% of the images of each class.
Statistical analysis
The optical density of the proteins was expressed as a percentage of the
volume, (mean ± SD) of the spots representing a certain protein that was
determined in comparison with the total number of proteins present in the
2-DE gel. The significance of the differences (p value <0.05) was calculated
using Mann-Whitney test.
Preparative gels
In order to identify proteins of interest, preparative gels are performed and
8
compatible with mass spectrometry but less sensitive than silver staining
therefore, for preparative gels, we had to load 1500 μg of proteins. For first
dimension, a preliminary step at 200 V for 12 h was introduced, while second
dimension is the same as analytical gels. The preparative gels for mass
spectrometric analysis were stained with Coomassie Brilliant Blue G-colloidal
(0,12%Coomassie G-250, 10% ammonium sulfate, 2% phosphoric acid).
Briefly, after protein fixation with acetic acid (7%) and methanol (40%) for 1
h, the gels were stained overnight with Coomassie Brilliant Blue G-colloidal
diluted with methanol (4:1 v/v). The gels were then rinsed 60 seconds with a
solution of acetic acid (10%) and methanol (25%) and finally washed twice
for few seconds with a solution of methanol (25%). Both analytical and
preparative gels showed the same protein pattern. Protein spots of interest
were cut from gel and sent to Core Facility Proteomic (Université de Genève)
for analysis by mass spectrometry and protein identification.
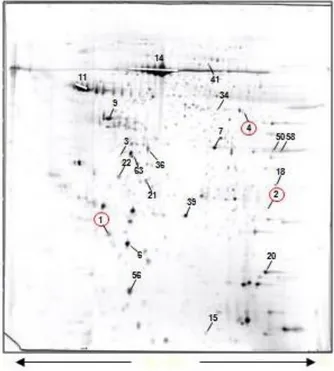
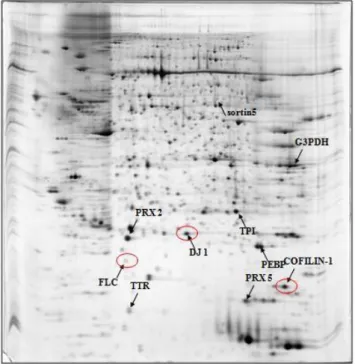
RESULTS
The first part of our experience was oriented in defining the proteomic profile
of human thyroid FNA fluid. 2DE analysis was performed 17 patients (Ratio
M:F 6:11, mean age (SD) 48.6(±14.0) years, range 22-75), 2DE analysis with silver staining allowed us to recognize about 220 protein’s spot per sample
(Fig. 1). Therefore a MALDI-TOF peptide mass fingerprint analysis was
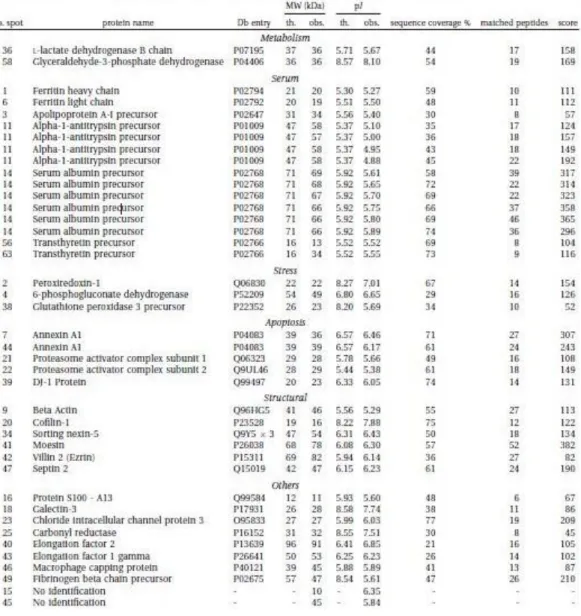
9
were classified by function (metabolic, antioxidative, pro-apoptotic, motility,
other) or usual site (serum proteins). In some cases the same peptide was
yielded by different spots, suggesting a post-transaltional modification. Table
1 summarize the proteins identified. Validation of findings was performed by
means of Western Blot analysis for one protein of each class (Fig 2)14.
Once obtained the proteome of human thyroid FNA, we performed a second
trial comparing the proteomic analysis on all of the 77 patients (M:F 15:62,
mean age 47.2±14.0 years, range 22-75) which had a preoperative diagnosis
either suspicious or highly suggestive of a thyroid carcinoma (FNA Bethesda
4-6)3,6. Final diagnosis, as represented in (Table 2), was of classical variant of
papillary carcinoma (cPTC) in 25 patients, follicular variant (PFV) in 15, tall
cells variant (TCV) in 12, benign follicular lesion in 21. In the other 4 patients
were found: 2 anaplastic thyroid carcinoma (ATC), 1 parathyroid carcinoma and 1 Riedel’s thyroiditis. The latter was submitted to surgery for the
suspicion of an anaplastic thyroid carcinoma. TCV patients showed
extracapsular involvement in 50% of cases, thus confirming the higher
aggressiveness of this variant. The proteomic profile on 2DE gel allowed
finding qualitative and quantitative differences which characterized each
variant of thyroid cancer from the control tissue. About 200-270 spots were
identified (Fig.3a-3d). Peptide mass fingerprinting via MALDI-TOF mass
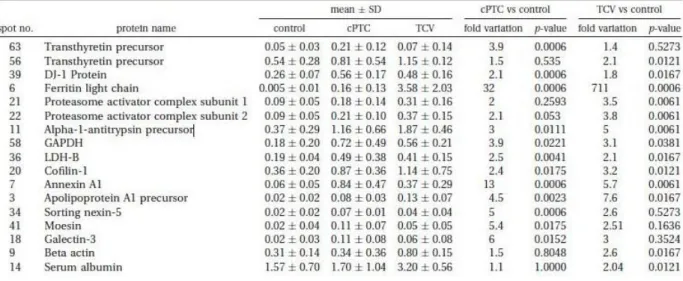
10
different expressions of each detected proteic spots respect to control tissue in
cPTC and TCV. Detailed results are showed in Table 3. An up-regulation of
9 spots was found both ic cPTC and TCV. Between the two sub-type of
cancer cPTC showed up-regulation of four more proteins: sorting nexin-5,
moesin, galectin-3 and TTR precursor-spot 63, while in TCV 3 spots were
exclusively up-regulated: TTR precursor-spot 56, beta actin, serum albumin.
Moreover each subtype exclusively expressed some protein spots on 2DE gel:
twelve spots in cPTC and three in TCV (circled spots in Fig.3a, 3b). A
detailed comparison with cPTC, TCV and normal tissue helped to better
clarify the up-regulation observed for each spot (Fig.4A-C).
The proteins profile of FNA of FVC well overlapped with those obtained
from previous other variants of papillary cancer. Similar to PTC and TCV a
significant up-regulation of specific functional proteins as glycolitic enzymes,
serum and structural proteins was oserved when compared to control tissue.
Specifically was found an increase of ferritin light chain (FLC)(p=0.029),
protein DJ-1 (p=0.0475) and cofilin-1 (p=0.0021) confirming the potential
role of these proteins in thyroid cancer progression (Fig.3c).
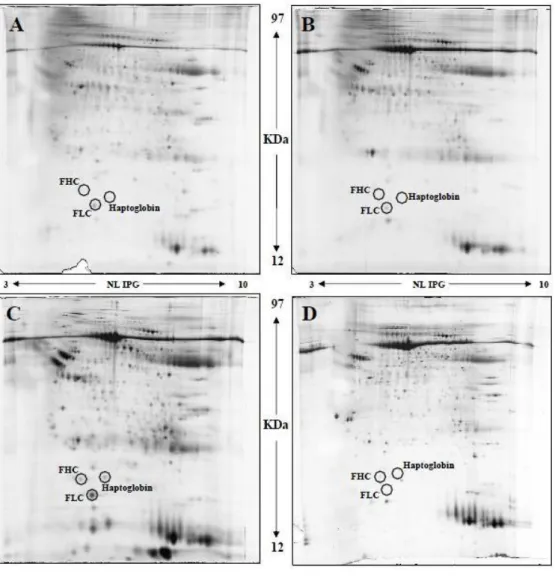
The patient in whom a Riedel’s thyroiditis (RT) was diagnosed by final
histology was a 72-years old woman admitted for a clinical and ultrasound
findings suspicion of ATC (Fig.5). The 2DE gel was compared to those of an
11
cancer (ferritin heavy chain (FHC), FLC, and haptoglobin) were evaluated. Protein expression in Riedel’s patients and control tissue did not show
significative differencies (p= 0.37, 0.73, 0.11 respectively for haptoglobin,
FLC and FHC), while in ATC expression of haptoglobin, FLC and FHC
respect RT was significantly increased (p=0.037, 0.035 and 0.047
respectively).
DISCUSSION
Proteomic analysis allowed us to define the human thyroid proteome,
providing moreover an imaging patter specific for thyroid normal tissue14.
Starting from this pattern we compared FNA samples of sub-type of thyroid
carcinoma to define the eventual changing presented in protein expression15.
An up-regulation of nine proteins specific protein in all papillary carcinomas
and moreover four and three proteins exclusively expressed by cPTC and
TCV respectively was found.
Analyzing the pattern of proteins hyper-expression our study confirmed the
earlier findings by Brown and Torres Cabala regarding the upregulation for
moesin, annexin A1 and gal-3 as well as for FLC, DJ-1 and TTR already
described for cold nodule or thyroid cancer9,11-13,15. Particularly high levels of
annexin A1 were reported by Petrella comparing well-differentiated and
non-differentiated thyroid cancers, suggesting the role of this protein as a tumor
12
role of annexin family seems to be confirmed also by the recent report of Jung
in which the degree of downregulation of annexin A3 expression (sub-type of
the group of annexins) correlates with tumor progression in papillary thyroid
carcinoma17.
Proteomics analysis allowed us to detect in all of the sub-types of cancer
evaluated an up-regulation of structural protein respect to control. All the
three variant (cPTC, TCV, FCV) presented significant increased expression of
Cofilin (p=0.018, p=0.012, p=0.0021, respectively) respect to control15.
Cofilin regulates actin polymerization and depolymerization during cell
migration, thus directly affecting tumor invasion, thus its different expression
within the sub-types might indicate a different degree of aggressiveness15,18.
In cPTC exclusively S100A13 up-regulation was found. The S100 protein
family is a Ca2+ binding protein superfamily, with 25 different peptides
found in humans so far19. S100A13 is involved in non-classical pathway
transmembrane transport of fibroblast growth factor-1 (FGF-1) and
interleukin-1a, which are involved in angiogenesis, tumor growth, and cell
proliferation and differentiation19. Specifically, S100A13 acts in the
non-classical (non-vesicular) release of FGF-1 19,20. FGF-1, is a potent mitogen
and angiogenic protein as a participant in the initiation, development and
metastasis of tumors19,20. The importance of S100 family in tumor progression
13
cancer aggressiveness11,21-24. Brown determined by immunohistochemistry the
hyper-expression of S100-A6 in thyroid malignancies11, while Sofiadis
recently reported its up-regulation in papillary thyroid cancer (especially in
those with a history of previous irradiation) but not in follicular thyroid
cancer22. Moreover Nipp found a correlation in between the expression of
S100-A10 and S100-A6 and the lymph node metastasis in patients affected by
papillary carcinoma. So far S100A13 overexpression may be considered, in
the pattern of S100 family’s actions, as a key factor for cell proliferation and
tumor progression in cPTC.
A significant up-regulation of 6-fold to respect with controls was also found
exclusively in cPTC regarding gal-3, confirming the role of this glycoprotein
as a biomarker for thyroid carcinoma, as already stated by other
authors11,12,25,26.
The TTR precursor presented two spot (marked 56 and 63) but each spot was
more expressed in only one of the two variants. The two spots showed a
different molecular weight (respectively of 13 and of 34 KDa); the two
different forms are respectively a monomeric TTR (spot 56) and a oligomeric
TTR (spot 63). TTR-56 corresponded to a monomeric form typical of TCV,
while TTR-63, is an oligomeric form due to strong non-covalent interaction
14
forms might be related to the different oxidative status or protease activity in
the specific cancer subtype15.
Focusing on TCV three proteins were exclusively over-expressed FHC,
peroxiredoxin-1 (PRX1) and 6-phosphogluconate dehydrogenase (6-GHPD).
FHC showed an increase of 711-fold. It is well known that FHC plays a key
role in protecting cells from oxidative stress27. Thus the level of
over-expression of this protein may correlate with tumor progression and being a
useful marker for TCV15. On the other hand PRX1 itself may concur to the
effects of FHC, because of its role against oxidative stress, inducing an
antiapoptotic effect, resulting in abnormal cell proliferation. 6GHPD is one of
the regulatory factors in the redox pentose phosphate pathway. Hence its role
may be linked to FHC and PRX1 to provide protection to neoplastic cells
during tumor proliferation15.
Regarding the patient with RT, a pre-operative work-up was inconclusive for
a diagnosis and clinical exam suspected an anaplastic carcinoma. Proteomics of patient’s samples demonstareted an expression of haptogloblin, FLC, and
FHC comparable to the FNA of normal thyroid tissues, while in the AC 2DE
15
CONCLUSIONS
Our study demonstrated that proteomics may have a preminent role in
differentiation the profile of thyroid nodules. A specific proteome profile has
been found for many sub-types of well differentiated (cPTC, TCV, FCV) and
anaplastic thyroid carcinoma (ATC) allowing to recognize those forms
harbouring a clinical higher aggressiveness compared to cPTC, but for which
usually diagnosis is made only with pathological examination. Although not
already included in the common clinical practice, the introduction of
proteomic study on thyroid FNA might help the surgeon to tailor the proper
16
REFERENCES
1. Gharib H, Goellner JR. Fine-needle aspiration biopsy of the thyroid: an
appraisal. Ann Inter Med 1993, 118: 282-289.
2. Diamantis A, Magiorkinis E, Koutselini H. Fine-needle aspiration
(FNA) biopsy: historical aspects. Folia Histochem Cytobiol. 2009, 47:
191-197.
3. DeLellis RA, Llyoyd RV, Heitz PU, Eng C. 2004 World Health
Organization Classification of Tumours: Pathology and Genetics of
Tumours of Endocrine Organs; IARC Press: Lyon, France, 2004.
4. Lundgren CI, Zedenius J, Skoog L. Fine-needle aspiration biopsy of
benign thyroid nodules: an evidence-based review. World J Surg 2008;
32: 1247-1252.
5. Zeiger MA, Dackiw AP. Follicular Thyroid lesions, elements that affect
both diagnosis and prognosis. J Surg Oncol 2005; 89(3): 108-113.
6. Cibas ES, Ali SZ. The Bethesda System for Reporting Thyroid
Cytopathology. Am J Clin Pathol 2009; 132: 658-665.
7. Prasad LM, Pellegatta SN, Huang Y, Nagaraja NN, De la Chapelle A,
Kloos TR. Galectin-3, fibronectin-1, CITED-1, HBME1 and
cytokeratin-19 immunohistochemistry is useful for the differential
17
8. Santoro M, Melillo RM, Carlomagno F, Vecchio G, Fusco A.
Minireview: RET: normal and abnormal functions. Endocrinology
2004; 145(12): 5448-5451.
9. Srisomsap C, Subhasitanont P, Otto A, Mueller EC, Punyarit P,
Wittman-Liebold B, vasti J. Detection of cathepsin B upregolation in
neoplastic thyroid tissue by proteomic analysis. Proteomics 2002, 2(6):
706-712.
10. Suriano R, Lin Y, Ashok BT, Schaefer SD, Schantz SP, Geliebter J,
Tiwari RK. Pilot study using SELDI-TOF-MS based proteomic profile
for the identification of diagnostic biomarkers of thyroid proliferative
disease. J Proteome Res 2006; 5(4): 856-861.
11. Brown LM, Helme Sm, Hunsucker SW, Neta-Maier RT, Chiang SA,
Heinz DE, Shroyer KR, Duncan MW, Haugen BR. Quantitative and
qualitative differences in protein expression between papillary thyroid
carcinoma and normal thyroid tissue. Mol Carcinog 2006; 45(8):
613-626.
12. Torres-Cabala C, Bibbo M, Panizo-Santos A, Barazi H, Krutzsch H,
Roberts DD, Merino MJ. Proteomic identification of new biomarkers
18
13. Krause K, Karger S, Schierhorn A, Poncin S, Many MC, Fuhrer D.
Proteomic profiling of cold thyroid nodules. Endocrinology 2007;
148(4): 1754-1763.
14. Giusti L, Iacconi P, Ciregia F, Giannaccini G, Basolo F, Donatini G,
Miccoli P, Lucacchini A. Proteomic analysis of human thyroid fine
needle aspiration fluid. J Endocrinol Invest 2007; 30: 865-869.
15. Giusti L, Iacconi P, Ciregia F, Giannaccini G, Donatini GL, Basolo F,
Miccoli P, Pinchera A, Lucacchini A. Fine-needle aspiration of thyroid
nodules: proteomic analysis to identify cancer biomarkers. J Proteome
Res. 2008 Sep;7(9):4079-88. Epub 2008 Jul 30.
16. Petrella A, Festa M, Ercolino SF, Zerilli M, Stassi G, Solito E, Parente
L. Annexin-1 downregulation in thyroid cancer correlates to the degree
of tumor differentiation. Cancer Biol Ther. 2006 Jun;5(6):643-7. Epub
2006 Jun 11.
17. Jung EJ, Moon HG, Park ST, Cho BI, Lee SM, Jeong CY, Ju YT,
Jeong SH, Lee YJ, Choi SK, Ha WS, Lee JS, Kang KR, Hong SC.
Decreased annexin A3 expression correlates with tumor progression in
papillary thyroid cancer. Proteomics Clin Appl. 2010 May;4(5):528-37.
19
18. Wang W, Mouneimne G, Sidani M, Wyckoff J, Chen X, Makris A,
Goswami S, Bresnick AR, Condeelis JS. The activity status of cofilin is
directly related to invasion, intravasation, and metastasis of mammary
tumors. J Cell Biol. 2006 May 8;173(3):395-404. Epub 2006 May 1.
19. Cao R, Yan B, Yang H, Zu X, Wen G, Zhong J. Effect of human
S100A13 gene silencing on FGF-1 transportation in human endothelial
cells. J Formos Med Assoc. 2010 Sep;109(9):632-40.
20. Jouanneau J, Moens G, Montesano R, et al. FGF-1 but not FGF-4
secreted by carcinoma cells promotes in vitro and in vivo angiogenesis
and rapid tumor proliferation. Growth Factors 1995;12910:37–47.
21. Torres-Cabala C, Panizo-Santos A, KrutschHC, Barazi H, Namba M,
Sakaguchi M, Roberts DD, Merino MJ. Differential expression of
S100C in thyroid lesions. Int J Surg Pathol 2004; 12: 107-115
22. Sofiadis A, Dinets A, Orre LM, Branca RM, Juhlin CC, Foukakis T,
Wallin G, Höög A, Hulchiy M, Zedenius J, Larsson C, Lethiö J.
Proteomic Study of Thyroid Tumors Reveals Frequent Up-Regulaion
of the Ca2+-Binding Protein S100A6 in Papillary Thyroid Carcinoma.
Thyroid 2010; 20(10): 1067-1076
23. Nipp M, Elsner M, Balluff B, Meding S, Sarioglu H, Ueffing M,
20
thioredoxin, and S100-A6 as biomarkers of papillary thyroid carcinoma
with lymph node metastasis identified by MALDI Imaging. J Mol Med
(Berl). 2011 Sep 22. [Epub ahead of print].
24. Danø K, Behrendt N, Høyer-Hansen G, Johnsen M, Lund LR, Ploug M,
Rømer J. Plasminogen activation and cancer. Thromb Haemost. 2005
Apr;93(4):676-81. Review.
25. Bartolazzi A, Bellotti C, Sciacchitano S. Methodology and Technical
Requirements of the Galectin-3 Test for the Preoperative
Characterization of Thyroid Nodules. Appl Immunohistochem Mol
Morphol. 2011 Jun 17. [Epub ahead of print]
26. Prasad ML, Pellegata NS, Huang Y, Nagaraja HN, de la Chapelle A,
Kloos RT.Galectin-3, fibronectin-1, CITED-1, HBME1 and
cytokeratin-19 immunohistochemistry is useful for the differential
diagnosis of thyroid tumors. Mod Pathol. 2005 Jan;18(1):48-57.
27. Pham CG, Bubici C, Zazzeroni F, Papa S, Jones J, Alvarez K,
Jayawardena S, De Smaele E, Cong R, Beaumont C, Torti FM, Torti
SV, Franzoso G. Ferritin heavy chain upregulation by NF-kappaB
inhibits TNFalpha-induced apoptosis by suppressing reactive oxygen
21
28. Iacconi P, Giusti L, Da Valle Y, Ciregia F, Giannaccini G, Torregrossa
L, Proietti A, Donatini G, Mazzeo S, Basolo F, Lucacchini A. Can proteomic approach help us in diagnosis of Riedel’s thyroiditis? A case
22
FIGURES.
Fig.1. Results of 2DE (220 spots).
Fig.2. Validation of findings was performed by means of Western Blot analysis for one protein of each class.
23
Fig. 3a-3d. 2DE pattern for cPTC, TCV, FVC and AP.
Fig. 3a. Papillary carcinoma classical variant (cPTC).
24
Fig. 3c. Papillary carcinoma. Follicular variant.
25
ig. 4. Detailed comparison between normal thyroid tissue (A), cPTC (B) and TCV (C), highlighting 2DE findings.
26
fig. 5. US findings in RT patients.
Fig. 6. 2DE comparing of RT(A), ATC(C) and normal thyroid tissue (B,D).
27
TABLES.
28
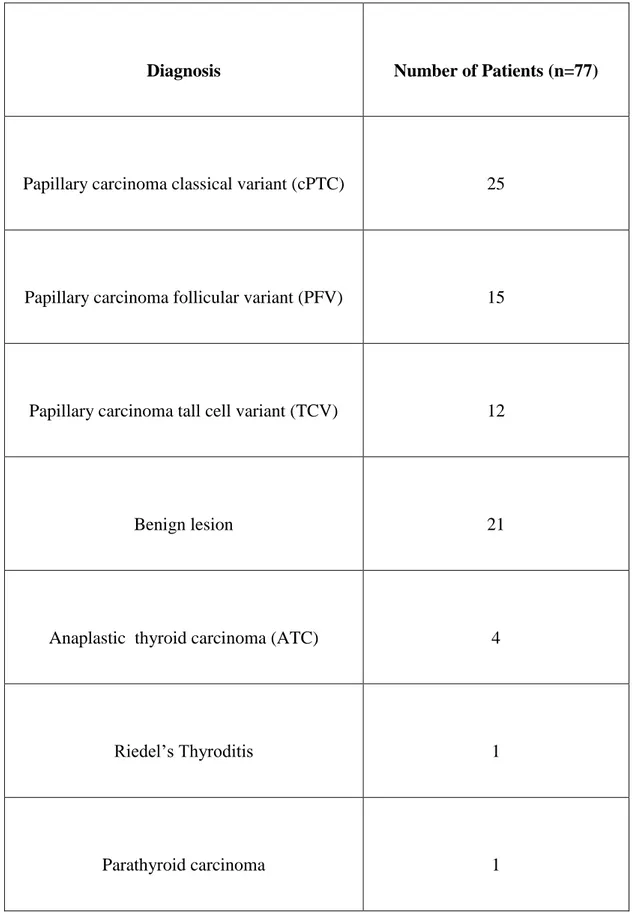
Table 2. Final diagnosis on pathological report.
Diagnosis Number of Patients (n=77)
Papillary carcinoma classical variant (cPTC) 25
Papillary carcinoma follicular variant (PFV) 15
Papillary carcinoma tall cell variant (TCV) 12
Benign lesion 21
Anaplastic thyroid carcinoma (ATC) 4
Riedel’s Thyroditis 1
29