_________________
Development of a Device to Measure Mass and Resuspension
Rate of Dust inside Confined Environments
Andrea Malizia
1, Riccardo Rossi
21Department of Biomedicine and Prevention, Faculty of Medicine and Surgery, University of Rome Tor Vergata, Via di
Montpellier, No.1, 00133, Rome, Italy, [email protected]
2Department of Industrial Engineering, University of Rome Tor Vergata, Via del Politecnico, No.1, 00133, Rome, Italy.
A dust explosion is one of the key security issues for many industrial, pharmaceutical and agro-alimentary plants and for the safety of the workers. We have developed an optoelectronic sensor system to determine the mass of deposited dust and the resuspension rate. The authors also mount antennas on an optoelectronic sensor system to perform measurements remotely. The technique used is based on a non-invasive light absorption method. The paper reports a cost analysis in order to demonstrate the possibility to use, in our optoelectronic sensor system, several sensors to monitor large volume. In this paper the authors present the sensor system, the test and calibration of its components together with the results and the error analysis, demonstrating experimentally what is the maximum and the minimum readable range. Keywords: Measure, sensor, mass, resuspension rate, non-invasive.
1. INTRODUCTION
A dust explosion is one of the key security issues for many industrial plants [1]-[5]. The main cause is the presence of large concentrations of combustible dust in an oxidant atmosphere with the presence of ignition sources. Major damage to the industrial plants is produced when dust is mobilized in confined volumes [6]-[16].
In the laboratory of Quantum Electronics and Plasma Physics (QEP), University of Rome “Tor Vergata”, the sensor system with the experiment STARDUST-Upgrade has been developed. It is a cylindrical stainless-steel vessel, where it is possible to replicate Loss of Vacuum Accidents with different conditions [17]-[24].
In the previous experimental campaigns, QEP research group studied the monophase fluid dynamic of STARDUST-U [20]-[23] and, after that, PIV (Particle Image Velocimetry),
PTV (Particle Tracking Velocimetry) and
SHADOWGRAPH measures have been implemented [17]-[19], [25].
The aim of this paper is to present the calibration and test of a sensor, based on an optical technique, to measure dust mobilization factors together with the results obtained, the error analysis and the limits of the optical technique adopted. The idea is to design a sensor system for dust mobilization replicating this sensor in many positions inside STARDUST-U.
2. MATERIALS AND METHODS
The technique developed to measure dust mobilization in confined environments (like STARDUST-U) is based on absorption of light. The light that crosses a material is attenuated; the attenuation factors are function of the optical properties and concentration of the material. It is possible to measure the concentration of the material starting from its optical properties [26].
Fig.1. Scheme of the sensor developed to measure the deposited dust.
Fig.1. shows a simplified scheme of the device developed in this work. A light source emits the light, which is parallelized through a first convex lens. Then, the light
crosses the wall where the dust is deposited. The wall must be transparent to the light source wavelength. Thus, the light passes the measurement region. At the end, a second convex lens converges the light in the light receiver, which reads the transmitted light. The initial intensity of the light is I0. Let us neglect the loss of light intensity due to the lenses. When the light crosses the wall, it loses a portion of light that is function of the Beer-Lambert-Bouguer law. The transmitted intensity is called Iw:
𝐼𝐼𝑤𝑤= 𝐼𝐼0𝑒𝑒− ∫ 𝜎𝜎𝜎𝜎𝜎𝜎𝜎𝜎= 𝐼𝐼0𝑒𝑒−𝜇𝜇𝑣𝑣𝜎𝜎 (1)
Where σ is the absorption cross-section of the material, N its molecular concentration and x is the coordinate parallel to the direction of the light propagation. If we use a homogeneous dust layer on the tray, the product of σ with N is constant and the integrative term can be written as μvx,
where μv is the coefficient of linear attenuation. Once the light
crosses the measurement region, interacting with the dust, a portion of this light is transmitted (It) and it is a function of dust concentration. If the deposited dust is homogeneous:
𝐼𝐼𝑡𝑡= 𝐼𝐼𝑤𝑤𝑒𝑒− ∫ 𝜎𝜎𝜎𝜎𝜎𝜎𝜎𝜎= 𝐼𝐼𝑤𝑤𝑒𝑒−𝜎𝜎𝜎𝜎�𝜎𝜎= 𝐼𝐼𝑤𝑤𝑒𝑒−
𝜎𝜎
𝑃𝑃𝑃𝑃𝑃𝑃𝑚𝑚𝐼𝐼𝑤𝑤= 𝑒𝑒−𝜉𝜉𝑚𝑚𝑃𝑃 (2)
Where PM is the molecular mass, A is the measurement section, m is the mass and ξ is the absorption cross section referred to the mass. Then, the measurement of mass can be achieved by (2):
𝑚𝑚 =𝐴𝐴𝜉𝜉ln �𝐼𝐼𝑤𝑤
𝐼𝐼𝑡𝑡� (3)
Note that the measured mass is the entire mass of dust contained in the measurement volume. We can say that it coincides with the deposited mass only if the resuspended dust is negligible.
In our experimental facility, we are interested in mapping dust mobilization. The large number of these devices needed to map entirely STARDUST-U led to the necessity of developing a low-cost system.
The sensor system comprises a light source, two convex lenses, a light filter, a glass window, and a light detector. The light source is a red LED (High-output solid-state light source). It has a dominant wavelength of 627 nm and the forward voltage is 3.51 V. The first lens (LA-1951 THORLABS) has a focal length equal to 25.4 mm. The second lens (LA-1805 THORLABS) has a focal length equal to 30.0 mm. A light filter (THORLABS NE10A) is used to avoid light source saturation. The light detector is a high-speed silicon detector (THORLABS DET210). Mechanical supports are used to fix each component. Fig.2. shows a photo of the experimental setup described.
A microcontroller (Arduino Uno) [27] is used to power up the light source and read the transmitted intensity. Arduino Uno is a microcontroller board, with some input/output analog/digital pins. One digital output is used to power up the light source. The output voltage is 5 V, and then a resistor is used to decrease the voltage on the LED The light source signal is read through analog input pins. The input pins have
a resolution of 10 bits, and their influence on the measurements is analyzed in the results section.
Four different types of dust are used inside STARDUST-Upgrade. They are flour, stainless steel, tungsten, and graphite. The stainless-steel dust is an AISI 814 (Fe/Cr18/Ni10/Mo8) powder, supplied by Good Fellow. The maximum particle size is 45 μm. The carbon dust is a natural graphite powder F, produced by LUBRITECH. It is a very fine dust with a high level of purity, generally used as a solid lubricant. The tungsten dust is a powder with 99.95 % of purity of the Alfa Aesar products. The last dust type is flour. We used a commercial “00” type flour of wheat, normally used for cooking. [24]
Fig.2. Photo of the sensor system in two different views. This is the device to test, calibrate and analyze the method. 3. RESULTS
A. Calibration
The calibration is performed for each type of dust. At first, the transmitted intensity without dust is measured. We also measured the transmittance of the glass plate, which is 92 %. One hundred measurements have been performed for each dust type. Each measurement follows these steps:
• Deposition of dust over the glass plate. The dust is deposited through a sieve (that has a grid size of 50 µm) in order to avoid agglomerated particles;
• The mass of deposited dust is measured through a precision weighing scale;
• The plate with the dust is positioned in the prototype; • The light source turns on and the light receiver starts the
acquisition. The light receiver performs 300 measurements. The mean and the standard deviation are calculated;
• Light source and receiver turn off and another measurement begins.
Fig.3. Transmitted intensity (It) in function of mass per surface deposited on the wall.
Fig.4. Natural logarithm of intensities ratio in function of mass per surface measured experimentally and the linear fit of the data.
Fig.3. shows the transmitted light in function of the mass deposited on the glass wall. The mass is divided by the analyzed surface. The intensity exponentially decreases according to the Beer-Lambert-Bouguer law. Each point is calculated as the average of 300 consecutive measurements. Now, we have to find the absorption cross-section of each dust type. It can be calculated by means of (3). Then, we calculate the natural logarithm of the ratio between transmitted intensity by glass and mass (Iw/It).
Fig.4. shows this variable in function of the mass surface. Then, a linear regression is performed, and the linear curves are shown in the figure. An intercept has been placed at (0,0) since we must have no light intensity variation when there is no mass concentration. Then, we have a curve with a general equation y = mx, where y is the mass per surface (m/A) and x is the natural logarithm of the intensities. Then, the slope coefficient (m) is equal to the absorption cross section (ξ).
Table 1. shows the results of the calibration. The data confirmed the linearity, and the coefficients of determination (R2) are near one.
Table 1. Calculated absorption cross sections and coefficients of determination of the linear regression.
Dust ξ [m2/kg] R2
Flour 62.93 99.59%
Tungsten 41.85 99.20%
SS 53.302 99.41%
Graphite 421.64 97.34%
B. Error analysis of mass measurement
This section shows the error analysis of the method, in order to understand the limits of the techniques and the influence that the microcontroller has on the measurements. Consider (3) and let us apply the equation of error propagation for independent variables [28]: 𝜎𝜎𝑚𝑚= � �𝜕𝜕𝑚𝑚(𝐴𝐴,𝜉𝜉,𝐼𝐼𝑤𝑤,𝐼𝐼𝑡𝑡) 𝜕𝜕𝐴𝐴 𝜎𝜎𝐴𝐴� 2 + �𝜕𝜕𝑚𝑚(𝐴𝐴,𝜉𝜉,𝐼𝐼𝑤𝑤,𝐼𝐼𝑡𝑡) 𝜕𝜕𝜉𝜉 𝜎𝜎𝜉𝜉� 2 + �𝜕𝜕𝑚𝑚(𝐴𝐴,𝜉𝜉,𝐼𝐼𝑤𝑤,𝐼𝐼𝑡𝑡) 𝜕𝜕𝐼𝐼𝑤𝑤 𝜎𝜎𝐼𝐼𝑤𝑤� 2 + �𝜕𝜕𝑚𝑚(𝐴𝐴,𝜉𝜉,𝐼𝐼𝑤𝑤,𝐼𝐼𝑡𝑡) 𝜕𝜕𝐼𝐼𝑡𝑡 𝜎𝜎𝐼𝐼𝑡𝑡� 2 (4)
Where σi is the standard deviation of the variable i. We calculate each term inside the equation:
𝜕𝜕𝑚𝑚(𝐴𝐴,𝜉𝜉,𝐼𝐼𝑤𝑤,𝐼𝐼𝑡𝑡) 𝜕𝜕𝐴𝐴 𝜎𝜎𝐴𝐴= 1 𝜉𝜉ln � 𝐼𝐼𝑤𝑤 𝐼𝐼𝑡𝑡� 𝜎𝜎𝐴𝐴= 𝐴𝐴 𝜉𝜉ln � 𝐼𝐼𝑤𝑤 𝐼𝐼𝑡𝑡� 𝜎𝜎𝑃𝑃 𝐴𝐴 = 𝑚𝑚 𝜎𝜎𝑃𝑃 𝐴𝐴 (5) 𝜕𝜕𝑚𝑚(𝐴𝐴,𝜉𝜉,𝐼𝐼𝑤𝑤,𝐼𝐼𝑡𝑡) 𝜕𝜕𝜉𝜉 𝜎𝜎𝜉𝜉= − 𝐴𝐴 𝜉𝜉2ln �𝐼𝐼𝐼𝐼𝑤𝑤𝑡𝑡� 𝜎𝜎𝜉𝜉= −𝑚𝑚𝜎𝜎𝜉𝜉𝜉𝜉 (6) 𝜕𝜕𝑚𝑚(𝐴𝐴,𝜉𝜉,𝐼𝐼𝑤𝑤,𝐼𝐼𝑡𝑡) 𝜕𝜕𝐼𝐼𝑤𝑤 𝜎𝜎𝐼𝐼𝑤𝑤= 𝐴𝐴 𝜉𝜉 𝐼𝐼𝑡𝑡 𝐼𝐼𝑤𝑤 1 𝐼𝐼𝑡𝑡𝜎𝜎𝐼𝐼𝑡𝑡𝑤𝑤 = 𝐴𝐴 𝜉𝜉 𝜎𝜎𝐼𝐼𝑤𝑤 𝐼𝐼𝑤𝑤 (7) 𝜕𝜕𝑚𝑚(𝐴𝐴,𝜉𝜉,𝐼𝐼𝑤𝑤,𝐼𝐼𝑡𝑡) 𝜕𝜕𝐼𝐼𝑡𝑡 𝜎𝜎𝐼𝐼𝑡𝑡= − 𝐴𝐴 𝜉𝜉 𝐼𝐼𝑡𝑡 𝐼𝐼𝑤𝑤 𝐼𝐼𝑤𝑤 𝐼𝐼𝑡𝑡2𝜎𝜎𝐼𝐼𝑡𝑡𝑤𝑤= − 𝐴𝐴 𝜉𝜉 𝜎𝜎𝑡𝑡 𝐼𝐼𝑡𝑡 (8)
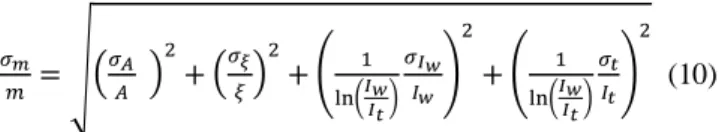
Using equations (5), (6), (7), and (8) combined with (4) we obtain the following formulation of error propagation for the mass measurement: 𝜎𝜎𝑚𝑚= ��𝑚𝑚𝜎𝜎𝐴𝐴𝑃𝑃 � 2 + �𝑚𝑚𝜎𝜎𝜉𝜉 𝜉𝜉� 2 + �𝐴𝐴𝜉𝜉𝜎𝜎𝐼𝐼𝑤𝑤 𝐼𝐼𝑤𝑤� 2 + �𝐴𝐴𝜉𝜉𝜎𝜎𝑡𝑡 𝐼𝐼𝑡𝑡� 2 (9) That equation can be used also to calculate the relative error of the mass: 𝜎𝜎𝑚𝑚 𝑚𝑚 = �� 𝜎𝜎𝑃𝑃 𝐴𝐴 � 2 + �𝜎𝜎𝜉𝜉 𝜉𝜉� 2 + � 1 ln�𝐼𝐼𝑤𝑤𝐼𝐼𝑡𝑡� 𝜎𝜎𝐼𝐼𝑤𝑤 𝐼𝐼𝑤𝑤� 2 + � 1 ln�𝐼𝐼𝑤𝑤𝐼𝐼𝑡𝑡� 𝜎𝜎𝑡𝑡 𝐼𝐼𝑡𝑡� 2 (10)
This equation is fundamental in the evaluation of error analysis and in understanding the technique limits.
The relative error of the measurement area is function of the first convex lens, its distance from the light source and light source properties, especially the divergence of the emitted light. In fact, the relative distance between light source and lens determines the size of the area and its divergence. The divergence involves a change of the measurement area along the optical axis. The small depth of the deposited dust involves a very small error due to divergence.
The relative error of the absorption cross-section can be calculated in the calibration section. We calculated it through a B method [28] and it was always lower than 5 %.
The influence of both intensities plays an important role. In fact, they are directly proportional to the natural logarithm of their ratio (10). Then, when the mass is very small, and the natural logarithm goes to zero, there is a huge increase in the relative error. We have another critical value of the relative error of mass; that is when the transmitted intensity goes to zero. The error of light intensity is mainly due to the minimum resolution of the light receiver and to random error. Let us neglect the random error influence and call the minimum resolution of the light receiver δ (this parameter is constant).
Fig.5. Relative mass error in function of transmitted intensity calculated through error propagation equation.
Fig.5. shows the relative error of mass in function of transmitted intensity. This is calculated by (10), using a relative error of surface equal to 10 % and a no-mass intensity (Iw) equal to 5 mV. The error has been taken constant and equal to 1/210; that is the minimum voltage resolution readable by our instrument. The function has two vertical asymptotes for the transmitted light which tends to zero and to the no-mass intensity (Iw). It implies that there are two limits of transmitted intensity, which limits the minimum and maximum readable mass.
Now, we calculate the experimental error using the experimental data and the model calculated. Then, we compute the error and the relative error as follows:
𝐸𝐸𝐸𝐸𝐸𝐸𝐸𝐸𝐸𝐸𝑖𝑖= �𝑚𝑚𝑒𝑒𝜎𝜎𝑒𝑒,𝑖𝑖−𝐴𝐴𝜉𝜉ln �𝐼𝐼𝐼𝐼𝑤𝑤𝑡𝑡,𝑖𝑖�� (11)
𝑅𝑅𝑒𝑒𝑅𝑅𝑅𝑅𝑅𝑅𝑅𝑅𝑅𝑅𝑒𝑒 𝐸𝐸𝐸𝐸𝐸𝐸𝐸𝐸𝐸𝐸𝑖𝑖=
�𝑚𝑚𝑒𝑒𝑒𝑒𝑒𝑒,𝑖𝑖−𝑃𝑃𝜉𝜉ln�𝐼𝐼𝑡𝑡,𝑖𝑖𝐼𝐼𝑤𝑤��
𝑚𝑚𝑒𝑒𝑒𝑒𝑒𝑒,𝑖𝑖 (12)
Where mexp is the mass measured through the weighing scale.
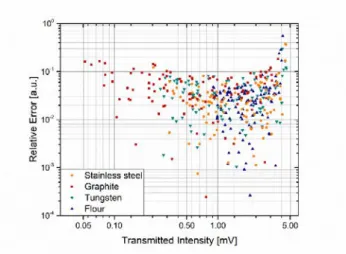
Fig.6. Relative error in function of transmitted intensity. The experimental data confirm the numerical model. We have an asymptote for the transmitted intensity which goes to Iw and to zero.
Fig.6. shows the relative error calculated by the previous (12). This graph confirms what we demonstrated with the analytical analysis the two asymptotic trends for extreme values of transmitted intensity.
The authors show the maximum and minimum readable mass through this method and this sensor system. At first, an acceptable error must be selected (it is arbitrary). In this case, the choice is 10 %. Then, consider the error propagation (10). It follows: �� 1 ln�𝐼𝐼𝑤𝑤𝐼𝐼𝑡𝑡� 𝜎𝜎𝐼𝐼𝑤𝑤 𝐼𝐼𝑤𝑤� 2 + � 1 ln�𝐼𝐼𝑤𝑤𝐼𝐼𝑡𝑡� 𝜎𝜎𝑡𝑡 𝐼𝐼𝑡𝑡� 2 < 0.10 (13) Solving this equation, it is possible to find the maximum and minimum acceptable transmitted intensity. The minimum
transmitted intensity is 0.001168 mV and the maximum is 0.499 mV. This limit implies a maximum and a minimum limit of measurable mass, which depends on the absorption cross-section of the dust. The maximum and minimum mass changes for the different dust samples (see Table 2.) and are calculated by (3).
This technique is sensitive to dust in the entire volume of measurements, so deposited dust should not be overestimated. In fact, if there is a cloud of resuspended dust, the transmitted intensity will decrease and then, according to (3), the read deposited mass increase. This error can be neglected only in two cases:
1. The light sensor is very close to the surface. This case is usually unacceptable because of fluid-dynamic interaction with the light sensor. In fact, it may change the fluid-dynamic behavior and then the measurement is falsified.
2. The concentration of resuspended dust is very low. This solution depends on what we are measuring, for example, when we have a low expected concentration in the volume measurement. It may happen when the mass inside the vessel is small and the volume is very large, that is equal to say that the average concentration of dust is low. Table 2. Calculated absorption cross sections and coefficients of
determination of the linear regression.
Dust ξ [m2/kg] Minimum m/A [kg/m2] Maximum m/A [kg/m2] Flour 62.93 0.0366 0.1328 Tungsten 41.85 0.0550 0.1998 Steel 53.302 0.0432 0.1568 Graphite 421.64 0.0054 0.0198
C. Remote measurements and cost analysis
We can connect the Arduino board directly to a ZigBee antenna. If we have another antenna in the external environment, connected to a PC, we are able to read the measurements without the use of any cable. It may imply a better isolation of the vacuum vessel. Furthermore, the system could be used also in industrial applications, where usually the distance between the measurement devices and the control room are much larger.
There are a lot of different antennae, which can reach different ranges of distances and frequencies. In our case, we used the XBEE SERIES 1 802.15.4. It has a data rate of 250 kbs, 100 m in indoor range and 1.6 km outdoor. The frequency band is 2.4 GHz.
At last, we performed a cost analysis of sensor. Table 3. shows the costs of each optical device. The light receiver cost is the highest in our sensor system. Anyway, this device has been used because of our laboratory availabilities. Cheaper light receivers can be used and their influence on the experimental setup can be evaluated following the steps in the previous section. Convex lenses and filter have an average cost which depends on their quality. The light source is the cheapest device (our light source costs 1.50 €).
Table 3. Optical device costs.
Optical Device Average cost
Laser source 1.00 – 3.00 €
Convex lenses 20.00 – 45.00 € (each)
Filter 30.00 – 45.00 €
Light receiver 100.00 – 200.00 € (cheaper devices exist) Table 4. shows the costs of the electrical and electronic components. The electrical conductors depend on their length, and then cost per meter is given. Arduino Uno is the electronic device used to power the light source and read the signal. Its use and influence on the measurement accuracy have been analyzed in the previous section.
Table 3. Electronics and electrical device costs.
Electronic and Electrical Device Average cost
Arduino Uno 15.00 – 30.00 €
Electrical Conductors 1.69 [€/m]
In case of remote measurements, the antenna implementation has an additional cost that depends on the antenna properties. The cost range is around 150.00 €.
The low cost of the apparatus will allow us to set a large number of sensors inside the entire vessel of STARDUST-Upgrade. Through these we will be able to understand where dust re-suspends and deposits, the resuspension rate, and the deposition rate.
4. CONCLUSIONS
Information about dust resuspension and deposition is fundamental to understand the physics of multiphase interactions inside our experimental facility. The absorption-based techniques are well known and used also to perform dust concentration. We developed a sensor to track resuspension and deposition of dust inside our vessel. Since we are interested in the use of several sensors, their cost is another important variable to take into account.
The technique uses a light emitter, two lenses, a transparent wall, and a light receiver. The electronic device is an Arduino Uno and some conductor. This equipment is extremely cheap and the effect of this low quality should be analyzed.
We calibrated our sensor and found the absorption cross-section of each dust type. A good data fit has been found, which means a reliable technique. The error analysis has shown the accuracy of the method and highlighted two important limits. The first limit is the maximum readable dust. When there is too much dust on the surface, the transmitted light is too low and the error due to the maximum resolution of the light receiver dominates the measurement. The other limit is the minimum dust, since the ratio of the intensities goes to one and its logarithm goes to zero. It implies a singularity which makes the measurement wrong.
We also consider the possibility to use an antenna, in our case an XBee, to avoid long wires and connector between the vacuum chamber and external environment.
The cost analysis has been shown and the cost of the instrumentation is very low, especially if we change the light receiver. The cheapness of these devices allows using a lot of them to monitor the entire vessel of STARDUST-Upgrade.
The sensitivity and the limits of this apparatus are acceptable for our aim and we are working on the design and making an instrumentation to set inside the STARDUST-Upgrade facility. Anyway, this kind of application could find also interesting use in industrial fields, where the monitoring of dust may be crucial for safety and health issues.
REFERENCES
[1] Abbasi, T., Abbasi, S. (2007). Dust explosions-Cases, causes, consequences, and control. Journal of
Hazardous Materials, 140 (1-2), 7-44.
[2] Dust Explosion Info. (2016). Dust Explosions - the
basics.
http://www.dustexplosion.info/dust%20explosions%2 0-%20the%20basics.htm.
[3] Eckhoff, R.K. (2003). Dust Explosions in the Process
Industries.Gulf Professional Publishing.
[4] U.S. Chemical Safety and Hazard Investigation Board. (2005). Investigation digest: Dust explosion at West
Pharmaceutical Services.
[5] U.S. Chemical Safety and Hazard Investigation Board. (2009). Investigation report: Sugar dust explosion and
fire.
[6] Amyotte, P.R., Eckhoff, R.K. (2010). Dust explosion causation, prevention and mitigation: An overview.
Journal of Chemical Health & Safety, 17 (1), 15-28.
[7] Eckhoff, R. (2009). Understanding dust explosions. The role of powder science and technology. Journal of Loss
Prevention in the Process Industries, 22 (1), 105-116.
[8] Gao, W., Mogi, T., Sun, J., Yu, J., Dobashi, R. (2013). Effects of particle size distributions on flame propagation mechanism during octadecanol dust explosions. Powder Technology, 249, 168-174. [9] Giby, J., CSB Hazard Investigation Team. (2007).
Combustible dusts: A serious industrial hazard. Journal
of Hazardous Materials, 142 (3), 589-591.
[10] Hauert, F., Vogl, A., Radandt, S. (1996). Dust cloud characterization and the influence on the pressure-time-history in silos. Process Safety Progress, 15 (341), 178-184.
[11] Occupational Safety and Health Administration (OSHA). (2014). Hazard alert: Combustible dust
explosion. OSHA Fact Sheet, DSG 12, 1-2.
[12] Abuwser, M., Amyotte, P., Khan, F., Morrison, L. (2013). An optimal level of dust explosion risk management: Framework and application. Journal of
Loss Prevention in the Process Industries, 26 (6),
1530-1541.
[13] Eckhoff, R.K. (1996). Prevention and Mitigation of dust explosions in the process industries: A survey of recent research and development. Journal of Loss Prevention
[14] Yuan, Z., Khakzad, N., Khan, F., Amyotte, P., Reniers, G. (2013). Risk-based design of safety measures to prevent and mitigate dust explosion hazards. Industrial
& Engineering Chemistry Research, 52 (50),
18095-18108.
[15] Murillo, C., Dufand, O., Bardin-Monnier, N., Lopez, O., Munoz, F., Perrin, L. (2013). Dust explosions: CFD modeling as a tool to characterize the relevant parameters of the dust dispersion. Chemical Engineering Science, 104, 103-116.
[16] Federici, G., Skinner, C.H., Brooks, J.N. et al. (2001). Plasma-material interactions in current tokamaks and their implications for next step fusion reactors. Nuclear
Fusion, 41 (12), 1967.
[17] Poggi, L.A., Gaudio, P., Rossi, R., Ciparisse, J.F., Malizia, A. (2017). Non-invasive assessment of dust concentration and relative dustiness in a dust cloud mobilized by a controlled air inlet inside STARDUST-U facility. Reliability Engineering and System Safety, 167, 527-535.
[18] Rossi, R., Malizia, A., Poggi, L.A., Ciparisse, J.-F., Peluso, E., Gaudio, P. (2016). Flow motion and dust tracking software for PIV and dust PTV. Journal of
Failure Analysis and Prevention, 16 (6), 951-962.
[19] Camplani, M., Malizia, A., Gelfusa, M. et al. (2016). Image computing techniques to extrapolate data for dust tracking in case of an experimental accident simulation in a nuclear fusion plant. Review of Scientific
Instruments, 87 (1), 013504.
[20] Poggi, L.A., Malizia, A., Ciparisse, J.F. et al. (2016). STARDUST-U experiments on fluid-dynamic conditions affecting dust mobilization during LOVAs.
Journal of Instrumentation, 11 (7), C07012.
[21] Malizia, A., Poggi, L.A., Ciparisse, J.-F., Rossi, R., Bellecci, C., Gaudio, P. (2016). A review of dangerous
dust in fusion reactors: From its creation to its resuspension in case of LOCA and LOVA. Energies, 9 (8), 578.
[22] Poggi, L.A., Malizia, A., Ciparisse, J.F., Gelfusa, M., Murari, A., Pierdiluca, S., Lo Re, E., Gaudio, P. (2015). First experimental campaign to demonstrate STARDUST-upgrade facility diagnostics capability to investigate LOVA conditions. Journal of Fusion
Energy, 34 (6), 1320-1330.
[23] Gaudio, P., Malizia, A., Lupelli, I. (2010). Experimental and numerical analysis of dust resuspension for supporting chemical and radiological risk assessment in a nuclear fusion device. In
International Conference on Mathematical Models for Engineering Science, 134-147.
[24] Malizia, A., Poggi, L.A., Ciparisse, J.-F., Rossi, R., Bellecci, C., Gaudio, P. (2016). A review of dangerous dust in fusion reactors: From its creation to its resuspension in case of LOCA and LOVA. Energies, 9 (8).
[25] Rossi, R., Gaudio, P., Poggi, L.A., Peluso, E., Malizia, A. (2018). Imaging of dust re-suspension in case of LOVA. Fusion Engineering and Design, 126, 156-159. [26] Weiner, J., Ho, P.T. (2003). Light-Matter Interaction:
Fundamental and Applications, Volume 1. Wiley.
[27] D’Ausilio, A. (2012). Arduino: A low-cost multipurpose lab equipment. Behavior Research
Methods, 44 (2), 305-313.
[28] Joint Committee for Guides in Metrology (JCGM). (2008). Evaluation of measurement data – Guide to the
expression of error in measurement. JCGM 100:2008
(Gum 1995 with minor corrections).
Received January 09, 2018. Accepted April 25, 2018.