1
A multilevel multimember model for smoothing a
disease map of lung cancer rates
Nicola Bartolomeo, Paolo Trerotoli, Gabriella Serio.
Department of Biomedical Science and Human Oncology, Chair of Medical Statistics, University of Bari. Bari. Italy.
E-mail of corresponding author: [email protected]
Abstract: Aim of this study is to assess the effect of smoothing a hospitalization rates map, based on the assumption that they may be influenced by the neighboring municipalities, the health service organization (HSO) and environmental risk factors. To smooth rates, two different Multilevel Multimembership Models were fitted: in the first the random effects were the municipality heterogeneity, the spatial dependence of the municipalities and the local HSO; in the second we replaced the local HSO effect by the environmental risk effect. The models were applied to show the spatial rates of hospitalization for lung cancer in Apulia in the year 2006.
Maps shaded with the rates obtained at the end of the smoothing procedure seem to express a geographic distribution pattern of higher or lower rates in specific areas of the region. The effect of smoothing was greater in municipalities with a more unstable Risk Adjusted Rate.
Keywords: Spatial analysis, Lung cancer, Smoothing, Multilevel Model
1. Introduction
Spatial analysis is often used to assess mortality or hospitalization rates but in such cases a problem of instability arises when they are calculated on small areas, owing to the small number of expected and observed cases (Olsen, 1996). Spatial smoothing could help to generate a correct interpretation of geographic variations of the risks of hospitalization or mortality (Carrington, 2007).
The primary aim of this study was to show, by spatial representation, how the hospitalization rates can be influenced both by the immediately neighboring municipalities and by the local health service management (ASL) to which the municipality belongs, as well as by environmental risk factors associated with the disease under study. As an example, the hospitalization rates for lung cancer recorded for the Apulia region were used.
2. Materials and Methods
To estimate the spatial effects with a multilevel model, the model must contain two components specifying the structure of random effects: a random effect or heterogeneity term, and a term representing the spatial contribution of neighborhood areas.
Because relative risks can be spatially autocorrelated, the multilevel model must be seen as a “Multiple Membership Model” (Goldstein, 2003; Goldstein, 1998), where each
municipality belongs to a higher level unit that also contains the neighboring municipalities. The criterion used to establish the cluster level was the distance radius
(25 km) within which all the municipalities are considered to belong to the same cluster. Let's consider the i-th municipality with Ei expected cases obtained at the end of a
2
where log (Ei) is treated as an offset, α is a constant, vi represents the random effects due
to the spatial dependency, ui represent the effects of the heterogeneity among the
municipalities and xiβ = 0 if there is no covariate.
Each municipality i is spatially dependent on one or more municipalities j belonging to the higher level geographic area ∂i , each contributing with weight zij . The sum of the weights of municipality i is equal to one. Therefore, when drawing up the model each spatial effect vi referred to municipality i must be taken as the sum of a set of
independent random effects, so that:
can be seen as the effect of municipality j on the other municipalities and zij is its associated weight.
In our first hypothesis the hospitalization rate varies among municipalities also according to the different management of the diagnosis by the local health service units. For this reason, we added a further random effect wi representing the ASL each
municipality belongs to:
After building the matrix of random effects (Langford, 1999) Model A was estimated by (3) and the smoothed hospitalization rates for each municipality were calculated. In equation (3), the parameters were estimated by the maximum likelihood technique. In the second hypothesis the hospitalization rates vary among municipalities according to the degree of exposure to some risk factors. We identified 12 mutually esclusive areas of environmental risk, each centered around a municipality where industries with a high environmental impact are located, and extending for a radius of 10 km around it (Dominici, 2006). Then Model B was estimated by (3), with the random effect wi that
represents the risk area in which the municipality is located. Industrial poles with a high environmental impact are indicated on the proposed maps to explore their effect on the geographic distribution of the disease. The analysis was conducted by selecting, from the Hospital Discharge Forms (HDF) for Apulian residents for the year 2006, those patients admitted with ICD9-CM codes of primary diagnosis 162--. To fit the multilevel models we used the SAS software.
3. Results
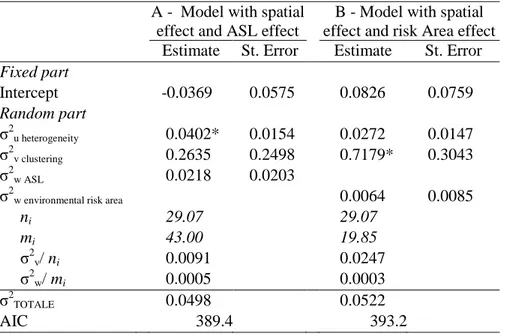
In 2006, a total of 2,591 patients resident in Apulia were hospitalized with a primary ICD9-CM diagnosis in the category “Malignant tumors of the trachea, bronchi and lungs” (crude regional rate = 6.36 per 10,000 inhabitants). The parameters and estimated standard errors with Models A and B are shown in Table 1.
In Model A, the only significant parameter was the variance due to the municipality heterogeneity (p=0.0092). The spatially structured variability quota is lower: 18.27% (0.0091/0.0498), while the ASL value is equal to 1.00% (0.0005/0.0498).
In Model B the estimated random effect due to the environmental risk areas is not significant (p=0.2261), nor is the heterogeneity variance (p=0.0654), while the only significant parameter is the clustering variance (p=0.0183). The spatially structured variability quota is equal to 47.32% (0.0247/0.0522) and the environmental risk area variability is 0.57% (0.0003/0.0522).
3
A - Model with spatial effect and ASL effect
B - Model with spatial effect and risk Area effect
Estimate St. Error Estimate St. Error
Fixed part Intercept -0.0369 0.0575 0.0826 0.0759 Random part σ2u heterogeneity 0.0402* 0.0154 0.0272 0.0147 σ2v clustering 0.2635 0.2498 0.7179* 0.3043 σ2w ASL 0.0218 0.0203
σ2w environmental risk area 0.0064 0.0085
ni 29.07 29.07 mi 43.00 19.85 σ2v/ ni 0.0091 0.0247 σ2w/ mi 0.0005 0.0003 σ2TOTALE 0.0498 0.0522 AIC 389.4 393.2 * p<0.05
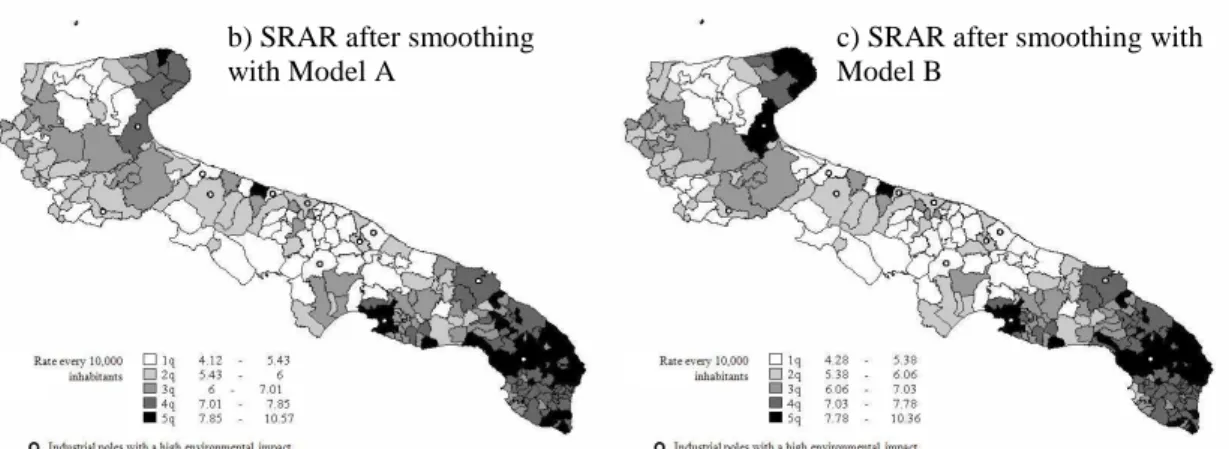
Table 1: Parameters and estimated standard errors in the rates smoothing models Three maps were built: the first one using the rates obtained at the end of the Risk Adjustment procedure before smoothing and the second and third using the smoothed rates obtained after estimating Models A and B, respectively (Figure 1).
The map in figure 1a does not offer a clear visual picture of areas with higher or lower hospitalization rates for lung cancer. In figure 1b it can be seen that there is a tendency toward clustering of municipalities with a higher admission rate for lung cancer in the Salento, the southernmost part of the Ionian curve and the Gargano. In figure 1c the introduction of the random effect of the areas at environmental risk produces little variation in the appearance of the municipalities hospitalization rate level as compared to figure 1b. The Gargano area is differently highlighted in figure 1b and figure 1c, where the latter gives the appearance of high rates for this area, probably due to the effect of environmental factors included in Model B, as compared to the municipalities aggregated in Model A.
In the maps with smoothed rates (figures 1b, 1c), the areas with higher admission rates are centered around municipalities with large industrial plants (such as Taranto in the Ionian curve) suggesting the effect of environmental risk factors and occupational exposure as determinants of higher rates of disease.
a) RAR before smoothing
4
Figure 1: Maps of the Hospitalization Rate for Lung cancer. Apulia (Italy), 2006.
4. Concluding remarks
The results of the estimated models in which the clustering and heterogeneity components were adequately specified demonstrated that both heterogeneity and spatial autocorrelation were significant parameters. The effect of the smoothing procedure was greater in smaller municipalities, and especially in those with a more unstable RAR value. When the ASL was considered as a second hierarchical level parallel to that of spatial dependency, the municipalities heterogeneity component increased markedly and a better fit of the model to the data was obtained. The map of hospitalization rates for lung cancer in the Apulian Region estimated by the SRAR revealed the areas at higher risk better than the map estimated with the RAR. The inclusion of the ASL changed the spatial distribution of the risks, demonstrating a reduced hospitalization rate in the Gargano zone. This could probably be due to the different organization in this ASL, perhaps in the sense of a lesser likelihood of admitting patients to hospital and a lower availability or accessibility of diagnostic services, as compared with other ASL. The environmental risk, considered as a hierarchical level, did not provide a better explanation of the geographic distribution. Perhaps environmental risk should be entered in the model as a covariate, because it must be considered as an attribute of the municipality itself.
References
Olsen SF, Martuzzi M, Elliott P (1996) Cluster analysis and disease mapping-why, when and how?, Br Med J, 313, 863–866.
Carrington A, Heady P, Ralphs M, et al. (2007) Smoothing of Standardised Mortality Ratios. Preliminary Investigation, National Statistics Methodological Series, 35. Fielding A, Goldstein H (2006) Cross-classified and Multiple Membership Structures in
Multilevel Models: An Introduction and Review. Research Report RR791. University
of Birmingham.
Goldstein H (2003) Multilevel Statistical Models, 3rd Edition. London, Arnold.
Goldstein H, Rasbash J, Plewis I, et al (1998) A User's Guide to MLwiN. London:
Institute of Education.
Langford IH, Leyland AH, Rasbash J, Goldstein H (1999) Multilevel modelling of the geographical distribution of diseases. J R Stat Soc Ser C Appl Stat, 48(2), 253-268. Dominici F, Peng RD, Bell ML, Pham L, McDermott A, Zeger SL, Samet JM (2006)
Fine particulate air pollution and hospital admission for cardiovascular and respiratory diseases. JAMA, 295(10), 1127-1134.
b) SRAR after smoothing with Model A
c) SRAR after smoothing with Model B

