143
Chapter 5
5. The use of indicators into the energy analysis.
Proposal of the Aggregated Coefficient Methodology.
“Science is made of data like a house is made of stones. But a faggot of data is not science as well as a pile of stones is not a house”
Jules-Henri Poincaré
5.1. Introduction
After accomplishing the review of the state of the art of the aggregated multi-criteria methodologies in chapter 4, this chapter tries to contribute towards a better understanding of the use of indicator for the analyses of energy systems.
Aspects as the selection of the suitable indicators, its aggregation, and last but not less its implication into the analysis are still unsolved questions inside the analysis. Thus,
144
further discussions of energy system assessment under a technical point of view are developed.
Different methodologies based on multi-criteria indicators have been proposed in literature for investigating energy systems. A brief outline of these methodologies has been provided already in chapter 4. Indeed, it has been examined how depending on the selected method, this has crucial effects on the results of the analysis. Considering the main methodologies available in the literature, involving technical and holistic indicators based approaches1,2,3,4,5, the idea of multi-criteria assessment appears really
interesting, but serious doubts have been raised about the selection of the indicators and also about the comparison among inhomogeneous types of power generation plants described in the cited studies.
In order to identify and evaluate energy systems we believe that the foremost methodologies for the analysis must be fulfilled under a technical point of view. This request will includes this analysis into the multidimensional approaches, since either an economic, thermodynamic and environmental criteria must be achieved. The indicators must be well defined for every technology, which imply to have technical knowledge of the different technologies involve in the analysis.
On that account, the aim of this chapter is an attempt to establish a theoretical framework for the aggregation of the different indicators for the energy systems assessments. After a review of the different indicators given by the reductionistic and non-reductionistic approaches in literature, we struggle to give a possible unified basis for the aggregation of a technical approach, providing the introduction of the aggregated coefficient of power generation (ACP). This coefficient has been already presented by us in some publications6,7, being an attempt to propose a indicator
aggregated methodology for multi-criteria analysis of energy systems.
5.2. The aggregated multi-criteria assessment methods
Usually, the aggregated multi-criteria assessment methods incorporate developments in the field of the interaction between the system and its surrounding. Some of them even
145
not solely under a technical point of view, but since every energy system has a social function in our life, links have be established including social interaction between the system and the environment aside of the traditional economic and thermodynamic aspects1,2,3,4,5,8. Accordingly, indicators represent the measure of the different interaction
between the energy systems and its surrounding, characterizing and typifying the different inputs and outputs flows of the systems. Furthermore, they can be classified in absolute or relative indicators. In general, for the analysis of energy system relative indicators are used, giving the different measure of the indicators, e.g. pro energy produced.
Consequently, the indicators involve a large and varied number of interactions with the world outside of the system’s physical boundary. The energy system designer must, therefore, face many issues, which deal primary with the energetic, economic and environmental aspects of the system. For every process with its own physical, technical and economic characteristics, aggregation required a proper “assembly” of the single indicators into a superstructure that reproduces the real complex system and its interaction with its surroundings. Although in all respects, and this is a substantial lack of this analysis, there are not unequivocal accepted links among the different dimensions involve into the analysis.
Thermodynamic indicators govern energy conversion processes being subject to physical and technical constraints. Cost indicators are involved in obtaining the final products, determining the profitability of the corresponding investments, (expenses for the purchase of the equipments and input energy resources, operation and maintenance cost, capital cost, etc.). Some limits may also exist on the resources indicator needed for plant operation and restrictions may or may not be imposed on the effect of undesired fluxed to the ambient in order to answer environmental concerns. A heterogeneous group of indicators must be selected to be able to represent and deal with all this aspects.
146
5.2.1. Some considerations about the application of the aggregated
multi-criteria methods
The aggregated multi-criteria assessment methods comprehend the different feature of energy production by means of defined indicators in a unique cumulative index indicator that will aggregate the characteristic of the analyzed system. An aggregated multi-criteria analysis of energy systems could include economic, resource, environment, social and technical indicators. A selection among the different indicators permits to include all the relevant dimensions of the system in a cumulative index. The optimal system is the one that maximize or minimize a particular utility function in the form also known as “weighting function method”.
The general indexes method comprises the formation of an aggregative function, eq. 5.1.
( )
∑
= = m 1 i i iq p w , q Q (5.1)Where Q is the cumulative index, pi is weight-coefficient elements of vector w and qi is the indicator of the specific criteria2.
The analysis is represented by means of the aggregation of the selected indicators that measure the different interactions between the system and its surroundings. It can also use technical synthesized indicators based on classical thermodynamic analyses of energy systems, or any other kind of complex indicators. A rational work with
indicators will confront us with two main problems, the aggregation problems and, the choice of a correct number of indicators. An important aspect also is the evaluation of the weighting factor. The weigh-coefficients in eq. 5.1 is a quality factor and its evaluation gives place to misleading and inaccurate analysis, where an unequivocal estimation is not possible. The estimation of this coefficient is still source of an exhaustive research, being one of the most difficult tasks of these methodologies. Likewise, a particular important aspect to consider from the different papers studied in the literature providing aggregated indicators methodologies1,2 is that those studies
147
present a selection of criteria and options for the comparison of fossil and renewable energy technologies. But serious doubts have been raised about those studies, since we believe that the comparison among inhomogeneous technologies raises to a number of questions about the reliability of the method and that the final result is strongly influenced by the priority given to a particular dimension or indicator. This is confirmed by the fact that from the variety of methods that have been proposed in literature, still none has received universal acceptance.
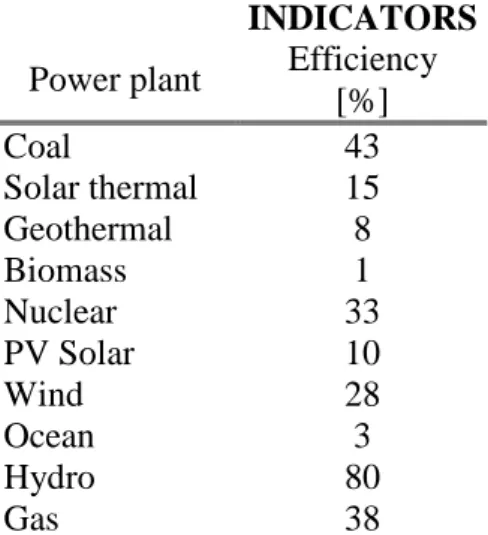
An example of this controversial argument is shown in table 5.1, where the indicator “efficiency” is taken to compare power plants as different as a pulverized coal fired power plant (300 MW) and a wind offshore power plant (1,5 MW), where the study has in our view failed, because is based on an inexistent analogy among the compared subjects.
Additionally, the problem is more complex that to compare energy systems with different sizes or technologies. The renewable energies, for instance, are restricted to the place where the resource is found. There are limits to the expansion or scale-up by the potential sites. Therefore, if for a given place in general a fossil fuel technology can be set up, the same cannot be said for the renewable resources. In this case, any comparison results to be nonsense.
Our indicators understandings are found also on the fact that the definition of the specific indicators must be very accurate. Some inaccuracies are detected in the definition of the indicator efficiency in table 5.1, where the indicator is not defined in a proper and consistent way for each technology. Namely, for the hydropower system, the efficiency is given as the machine efficiency (80%), which is to high, because it does not take into account the water stream variations in time, while for wind power plant (28%) seems that some considerations are made about the wind fluctuations during the year, since its efficiency indicator does not only reflect the machine efficiency. The description of the different types of indicators will be detailed explained in a section below.
148
INDICATORS
Power plant Efficiency [%] Coal 43 Solar thermal 15 Geothermal 8 Biomass 1 Nuclear 33 PV Solar 10 Wind 28 Ocean 3 Hydro 80 Gas 38
Table 5.1: Possible indicators for aggregation assessment2.
What we are mainly concerned with here is that a correct development of the ideas rises to compare systems of similar technologies. These analyses aim to analyze the energy conversion process characteristics, evidencing the relevance of the different plants. On the other side, a reliable method can also confront technologies structurally different but with a similar plant size, in order to justify their comparison. In this way is better evidenced the interaction between the system and the environment, and must include also an accurate indicators definition appreciating also some technical details. This method is suitable for energy policy decision makers, giving the optimal solutions to the comparison of different technologies providing the same power. It is important in order to have an accuracy analysis, to considerer in detail the type of technology that is been appraised. For example, with the intention of having a equitable analysis when renewable technologies are been compared with traditional energy systems, the relevance of the economic indicator investment cost must be relegated to a second plane, since the renewable energy systems have not yet archive economy of scale. The simplest form of aggregation, assuming that each variable is in the same unit, will be to add up the individual variables or indicators that reflect the different features acting on the system. In general considerations can include economic approaches using prices or marginal product for aggregation, the basic heat equivalent for
149
thermodynamic analysis as well as energy, emergy or exergy aggregations. The advantage of the thermal equivalent approach is that it uses a simple and well define accounting system based on the conservation of energy and the fact that thermal equivalent are easily and uncontroversially measured. But unfortunately, in the aggregation of multi-criteria indicators, in general, the indicators are not homogeneous and their aggregation to a common basis is a difficult task. A possibility of aggregating the values of non-homogeneous indicators is to refer them to a normalized basis, using linear or non-linear approaches.
5.3. Proposal of the Aggregated Coefficient Methodology for the
Analysis of Power Generation Systems (ACP)
An attempt to propose an aggregated method improving the diverse proposals found in literature has to take into account the considerations made before. It must be applied under certain limits and with particular restrictions. The Aggregated Coefficient of Power Generation (ACP) that has been developed already by the author in different publications6,7 is obtained as the sum of the singular normalized indicators implicated
in the analysis. This provides a simple method to compare different homogeneous power plants belonging to a similar category, namely, fuel used or size. For this multi-criteria analysis the ACP coefficient is defined as:
∑
∑
= = = n 1 i i n 1 i i i w NI w ACP (5.2)Where NIi is a generic normalized indicator, wi is the weight coefficient for the i-th indicator and n is the number of used indicators. Once that the indicators have been defined the best power plant results the one with the highest ACP coefficient.
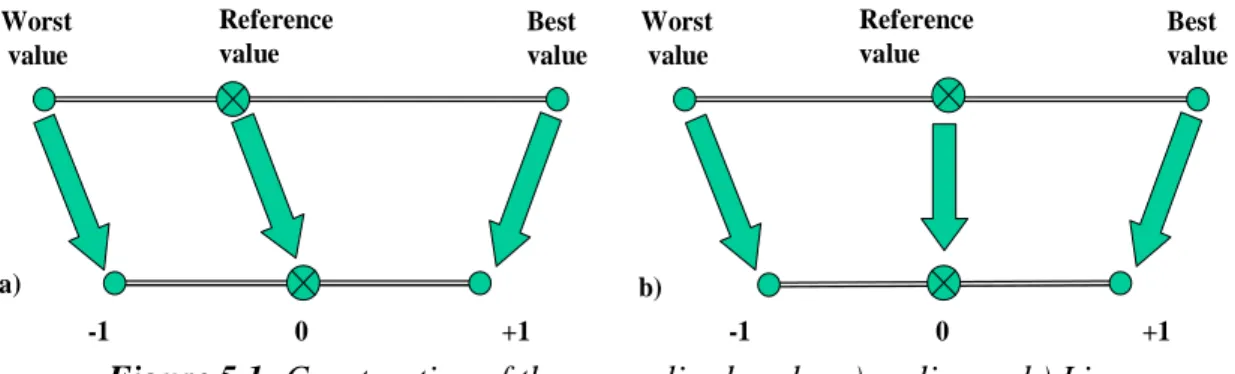
According to this method, the indicators can be normalized into a linear or no-linear scale3. A worst and a best value have to be identified for each indicator. The best
150
indicator value will be normalized to (1), while the normalization to (–1) identifies the worst indicator value, see figure 5.1. An identification of a reference value, normalized value equal to (0) is also necessary, when a non-linear scale is used.
Figure 5.1: Construction of the normalized scale, a) no linear, b) Linear
These reference values are fundamental implying a preference among the various energy policies (raising the efficiency, reducing the environmental impact or minimizing costs). In an analysis involving a lot of energy conversion systems the identification of reference values represents a key point into the analysis. The selection of the reference values can be able to unbalance the result among very opposite solutions, which on one hand makes of this analysis a very manipulable tool, but on the other hand brings out a useful tool for policy-maker, when a preference for determined criteria is to follow.
Further considerations include the selection of the reference scale, which determine in many respects the strategy followed by the analysis. An example about the influence that a determined reference scale can exert on the analysis is shown in Table 5.2, where the indicator “first-law efficiency” has been taken as a thermodynamic indicator for the analysis of different fossil fuel systems. The reference scale of the indicators can comprise the best and the worst values considering the whole spectrum of the fossil fuel technologies, namely, from pulverized coal combustion, with the lower efficiency value, till advanced natural gas cogeneration power plants, which archives the higher efficiency value. Or, it may also comprehend only a part of this spectrum,
Worst value Reference value Best value -1 0 +1 Worst value Reference value Best value -1 0 +1 a) b)
151
that is, e.g. the best and the worst values of coal fired power plants, from pulverized coal combustion till advanced gasification power plants.
first-law efficiency indicator Worst Value Reference value Best value
Fossil fuel power plants [%] 38 43 58
Coal fired power plants [%] 38 45 47
Table 5.2: Two different reference scales for the first-law efficiency indicator
The reference values shown at table 5.2 for fossil fuel power plants give preference to a large spectrum of high efficiencies, favoring the ones with higher normalized values. While the one used for coal fired power plants puts at a disadvantage the low efficiency power plants, penalizing them with low normalized values.
An exhaustive analysis can be obtained using a quite high number of indicators, causing a significant advance in the description of the systems, but also representing a risk to have a very fragmented analysis. A number of aspects related to the work with indicators requiring further researches are also the definition of the different indicators belonging to each dimension and the analysis about their meaning and application problems, extensively developed at the next section:
5.4. Description of the different type of indicators used in the analysis
Basing on the implications of the mathematical description of the ACP coefficient defined by eq. 5.2, the real key points of this method are the selection of the indicators used, (quantity, type) and the valuation of their weight coefficients.In order to obtain a multi-dimensional analysis of an energy system, the indicators must belong to, at least, one of the three main macro-dimensions, namely, the thermodynamic, economic or the environmental dimension. The indicators set cannot be general, but it must be defined for each specific field of analysis. A choice among all of the different indicators will give us the possibility to include all the relevant aspects of the power generation in a unique cumulative indicator.
152
Table 5.3 shows some possible relative indicators that can be used for the analysis of energy conversion systems. There are some typical ones, defined for each macro-aspect, but there are also important new indicators related with the new way of energy production, including the new aspects of environmental analysis.
Macro-aspects Indicators
Thermodynamic
Relative to the First law of thermodynamics Relative to the second law of thermodynamics Irreversibility of the single components of the plant Quality index of the fuel utilization
Raw energy conversion coefficient
Environmental
Emission to the atmosphere/energy produced (CO2, NOx, SOx, CH4)
Emissions to the water/energy produced (release P- and N- rich waste into water bodies)
Heat Reject to the Environment/energy produced (specially to the water bodies)
Land use/energy produced
Fuel resource used/energy produced
Stratospheric O3 depletion/energy produced
Tropospheric O3 and “Photosmog” /energy produced
Ecotoxicity (heavy metals, toxic waste etc.) /energy produced Ecological Footprint
Economic
Total Capital Costs of the plant/energy produced Operation and Maintenance Costs/energy produced Cost of Resources/energy produced
Profit index Unit energy cost Internal Rate of Return
Microeconomics analysis considering the whole plant life cycle The life-cycle costing
Internal rate of return
153
5.4.1. Thermodynamic indicators
Thermodynamic indicators must be considered, absolutely, in to the multi-criteria analysis of energy systems. For the application of the ACP method a detailed description of the main thermodynamic indicators must be performed.
If the analysis concerns fossil fuel power plants, first-law indicators (e.g. efficiency) seem to be more appropriated, especially when working with different fossil fuel. While second Law indicators (i.e. entropy generation, exergy losses, second law efficiency, or irreversibility of the single components of the plant etc.), permit to appreciate some peculiar differences among the technologies.
The first-law efficiency for fossil fuels power plants is define as the ratio between the energy output and the energy input, giving a clear idea about the efficiency of the plant.
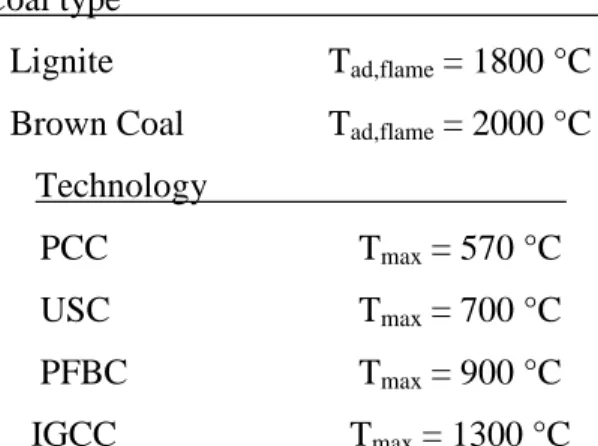
An interesting indicator that can be introduced in the analysis is the “quality index of the fuel utilization”, eq. 5.3, can capturer different meaningful interests within the energy systems analysis. This indicator uses as reference the different values of the maximum turbine inlet temperature (TITmax) of the system, which introduces technological criteria into the indicator. On the other side, such an indicator can be related to intrinsic properties of the fuel, like calorific value, exergetic value or adiabatic flame temperature, but also to different data related to the fuel and its utilization in the energy system (Tad,flame). Referring to this indicator it is possible to give a significant importance, based on a non-economic dimension, to the fuel used and the different technologies used to its conversion to energy, represented for example by the maximum turbine inlet temperature of the system.
c c flame ad, 0 max 0 η / η T T 1 TIT T 1 ε = − − = (5.3)
154
where T0 is the environmental temperature, Tmax the maximum operating temperature that can be theoretically obtained with the technology and Tad,flame the adiabatic temperature relative to the particular fuel used9.
For instance in table 5.4 are shown the values of the maximum operating temperatures and the adiabatic flame temperatures related to different fuels and coal technologies10:
Coal type
Lignite Tad,flame = 1800 °C Brown Coal Tad,flame = 2000 °C
Technology
PCC Tmax = 570 °C
USC Tmax = 700 °C
PFBC Tmax = 900 °C
IGCC Tmax = 1300 °C
Table 5.4: Maximum operating temperatures and the adiabatic flame temperatures
related to different fuels and coal technologies
These values can be referred to those relative to the best energy conversion technology at present available represented by the natural gas combined cycle (NGCC) power plants (Tad,flame = 2000 °C and Tmax = 1300 °C).
Indicators based on the second law efficiency for fossil power plants, can be also applied in order to individualize the irreversibility of the single power system components. These indicators can be based on exergy balances account of the systems, second law efficiency of the single components etc.
Special considerations deserve the thermodynamic indicators for renewable energy systems. Even though, not been part of the goals of this thesis, some preliminaries considerations are described in appendix A of this thesis, where a comprehensive description of the first and second law indicators for the most common renewable energies is accomplished.
155
5.4.2. The environmental indicators
The environmental indicators try to quantify all the “externalities” related not only to the use of the energy systems but to the construction and recycling of its components as well. In general must be included into the environmental indicators considerations about the extraction of raw material, operating environmental impacts as the resources scarcity or the environmental pollution and the recycling of materials. A more completed set will include not only the present environment but also a set of future possible environments, those which will exit or not exit depending on our present used of the environment. Some considerations about those indicators are given below.
5.4.2.1. Resources indicators
For fossil fuel energy systems, the fuel consumption indicator appears to be the most important resource indicator, but it is not the only resource utilized, directly or indirectly, by the system.
The chemicals consumption indicators are also used for treating the exhaust gases, the fuel etc, including the lubricants consumption indicator uses for components with moving parts. Indicators as water used can be also included into the analysis.
Furthermore, resources indicators for renewable energy systems are based on spaces, water and energy required to produce the inputs used in renewable energy production. Some common indicators are the amount of land required to produce electric energy output with solar energy or biomass fuel. But the actual production of solar, wind and biomass electricity may face more than land constraints.
The water availability indicator is a very significant resource indicator for renewable energies used for cooling, irrigating or make-up, since water is a scare resource in many places. In addition, the production of solar panels and the planting, fertilizing, cultivating and harvesting of biomass energy are highly energy intensive activities. As well as keeping the solar panels clean of dust, sand, dirt etc. is either energy or labor intensive.
156
Furthermore, if hydrogen is used to store solar or wind energy, large amount of fresh water are required. It is estimate that 80 billons liters of fresh water of distilled water quality is required to produce an EJ/yr of hydrogen11. Biomass is even more
water-intensive than electrolytic hydrogen. It is estimate tan 150 to 300 EJ/yr of solid biomass12, could use as much water as does all current agriculture. Large-scale biomass
would add a huge new element to future world water demand.
Depending on the physical bases selected for the indicators, the resources indicators can be expressed in quantity terms, or also in energetic (exergetic) terms, being the energy (exergy) required to produce one unit of the resource and delivered to the system.
5.4.2.2. Pollution indicators
Each individual pollutant or polluting stream emitted by a system may cause damage to society and the environment. Thus, the pollution indicators can take any number of forms. The simplest measure of pollution is the quantity of the pollutant reject to the environment, where thermal and chemical pollution can be included as environmental indicators. But also measure based on second law concepts, as exergy or entropy can be used, which will include the indicators into an energetic dimension.
The second law indicators for pollution are based on the fact the pollution causes a disturbance in the environment, i.e., a departure from its initial state of equilibrium. Exergy as a measure of departure from equilibrium appears to be a very appropriate indicator. But reliability considerations about the calculation of thermal, chemical and other forms of exergy used as pollutions indicators deserve furthers analysis, since the possible exergy indicators are subordinate to a specified standard chemical reference exergy, meaning that for any analysis involving exergy indicators, the characteristics of the reference environment must be specified completely. Indeed, the quest for the definition of the reference state, especially for what concerns chemical species is argument of a large debate. This task will be opportunely discussed in detail in the next chapter.
157
Some typical environmental indicators are the air pollution emissions (CO2, NOx, SOx, etc.), which taken directly into account the quantity of pollutant emitted to the atmosphere.
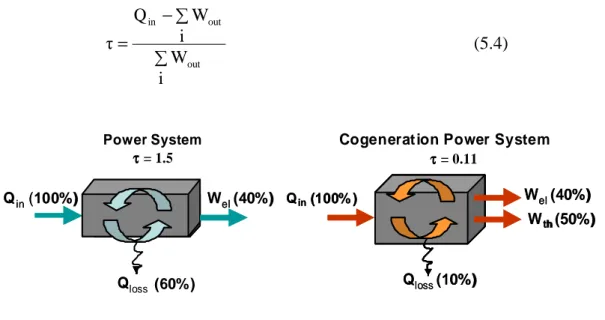
A more complex indicator for the thermal emissions is proposed. The heat rejected to the atmosphere or to the water by the power system is summarized into the indicator called the “heat reject factor”, in eq. 5.4, which considers the ratio between the energy losses to the environment and the total useful energy output, this indicator is illustrated in figure. 5.2. ∑ ∑ − = i W i W Q τ out out in (5.4) Qin(100% ) Wel(40%)
Cogeneration Power System
τ τ τ τ = 0.11 Qloss(10%) Wth (50%) Qin(100% ) Wel(40%) Qloss(10%) Wth (50%) Wel(40%) Q (10%) Wth (50%) Wel(40%) Power System τ τ τ τ = 1.5 Qin(100%) Qloss Wel(40%) Qin(100%) Q (60%)
Figure 5.2: The meaning of the heat reject factor with reference to two application
cases.
A detailed report containing a great number of environmental dimension indicators that can be considered for the analysis of energy systems can be seen in McNeil13.
5.4.3. The economic indicators
For energy system analysis the economic indicators are based on a microeconomics analysis of the system: the total capital cost of the plant for unit power, the energy unit
158
cost, the internal rate of return of the investment related to the plant, the fuel price, economic incentives etc., are possible economic indicators.
From a bigger picture the economic indicators can also include; the gross domestic product, gross national income, government expenditures, consumer confidence and price indices.
5.5 Application example for the ACP Method
The analysis of the ACP method can be applied in the framework of various fossil fuel based conversion technologies as the advanced coal conversion ones: the Ultra Super Critical (USC), the Pressurized Fluidized Bed Combined Cycle (PFBC) and the Integrated Gasification Combined Cycle (IGCC). In order to show the reliability of the ACP method for high efficiency coal power plants, the Natural Gas Combined Cycle (NGCC) power plant, which is today the most competitive energy conversion technology, and the sub-critical pulverized coal combustion plant (PCC), are used as upper and lower border reference technologies. In the definition of the ACP method, the influence of each indicator is defined by a weight wi. This underlines the relevance
of each dimension considered in the analysis and of the various indicators. Methodological issues and data limitations complicate the perspective of a non-arbitrary definition weight
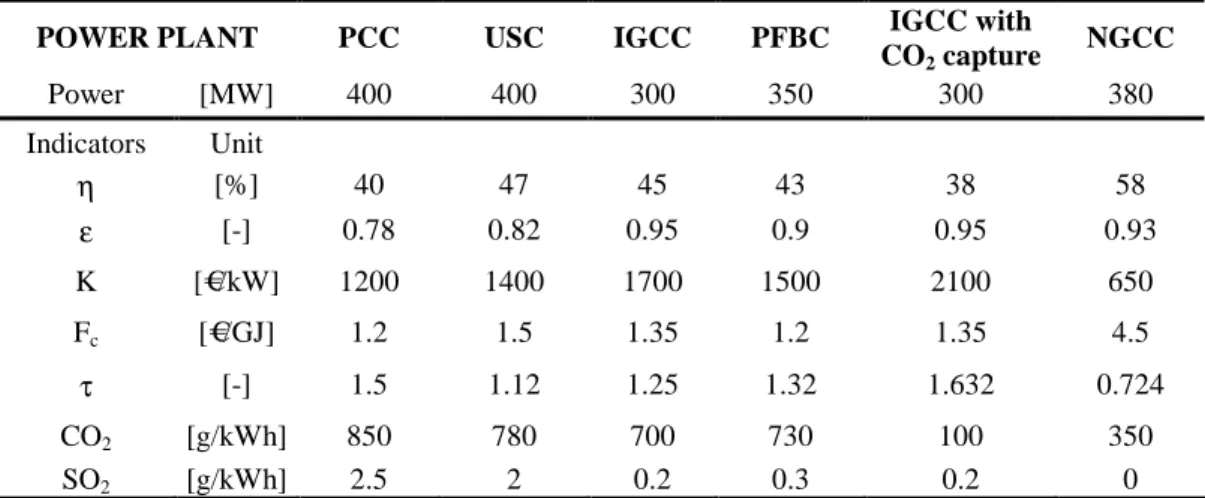
Values considered for various parameters of the analyzed plants are shown in table 5.510,14,15. The analysis is carried out considering for each dimension the various
indicators reported together in tables 5.6 and 5.7 with its reference values for it normalization. Different reference values are considered if coal generation systems are compared with technologies based on a different fuel, as natural gas, see table 5.6, or if only coal-fired technologies are compared, see in table 5.7. In the first case the reference values for adimensionalization are chosen considering a larger range of variability.
159
POWER PLANT PCC USC IGCC PFBC IGCC with CO2 capture NGCC Power [MW] 400 400 300 350 300 380 Indicators Unit η [%] 40 47 45 43 38 58 ε [-] 0.78 0.82 0.95 0.9 0.95 0.93 K [€/kW] 1200 1400 1700 1500 2100 650 Fc [€/GJ] 1.2 1.5 1.35 1.2 1.35 4.5 τ [-] 1.5 1.12 1.25 1.32 1.632 0.724 CO2 [g/kWh] 850 780 700 730 100 350 SO2 [g/kWh] 2.5 2 0.2 0.3 0.2 0
Table 5.5: Power plants and parameters used for the ACP analysis theory.
INDICATORS Symbol Unit NI=-1 NI=0 NI=1
Thermal efficiency η [%] 38 43 58
Index of fuel utilization ε [-] 0.78 0.90 0.95
Total capital cost K [€/kW] 2100 1400 650
Fuel cost Fc [€/GJ] 4.5 2.85 1.2
Heat Rejected factor τ [-] 1.632 1.247 0.724
CO2 Emission CO2 [g/kWh] 840 350 100
SO2 Emission SO2 [g/kWh] 2.5 1.25 0
Table 5.6: Indicators used for fossil fuel plants
INDICATORS Symbol Unit NI=-1 NI=0 NI=1
Thermal efficiency η [%] 38 43 47
Index of fuel utilization ε [-] 0.78 0.90 0.95
Total capital cost K [€/kW] 2100 1727 1410
Fuel cost Fc [€/GJ] 1.5 1.35 1.2
Heat Rejected factor τ [-] 1.632 1.326 1.127
CO2 Emission CO2 [g/kWh] 840 700 100
SO2 Emission SO2 [g/kWh] 2.5 1.25 0
160
5.5.1. Weight theory
In the definition of the ACP coefficient, the magnitude of each indicator is defined by a weight wi; this weight underlines the relevance of each dimension considered in the
analysis and inside each dimension the relevance of the various indicators considered. Methodological issues and data limitations complicate the application of an unequivocal weight theory. A first approach is to consider a weight distribution without further scientific considerations like for example giving an equal distribution for every macro-dimension and to each indicator inside the macro-dimension. This will give us an outcome that puts the same burden to every dimension. Furthermore, significant improvement can occur after quantifying the environmental damage or the others aspects of the process, so the approach to the weight distribution can be also based on a more scientific analysis.
5.5.2. Results and Conclusions
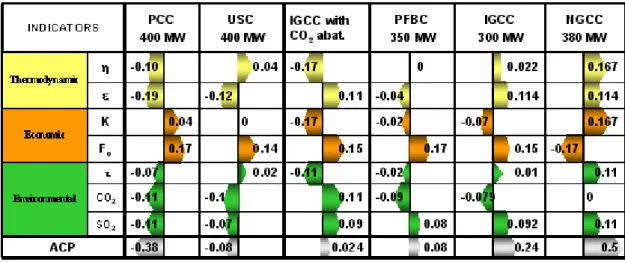
The results of the application of the ACP method to the various energy systems are reported in the figures below. In figure 5.3 the analysis of five coal-based power plants in comparison with the NGCC is outlined in term of ACP coefficient. The cumulative indicator is obtained giving an equal weight distribution to every dimension (thermodynamic, economic and environmental) and to each indicator, which characterized the dimension.
161
Figure 5.3: Comparison of fossil conversion technologies with an equal weight
distribution among the indicators. (Reference Table 5.6)
Considering the results summarized in figure 5.3, the NGCC power plant has the higher ACP coefficient, due to its lower environmental impact and its superior thermodynamic features. Naturally, it represents today the more advantageous option for power generation even if it is necessary to consider that natural gas is more expansive.
Further considerations can be carried out comparing only the coal conversion options. In general, joining the results of figure 5.4, the development of USC plant appears to
be not really convenient, even if, at present, they show the higher efficiency, around 47 %16. The increase of the efficiency and the low reduction of CO
2 emissions, with respect to a conventional PCC plant do not compensate the increase in costs suffer by the USC plants due to their high technological efforts.
162
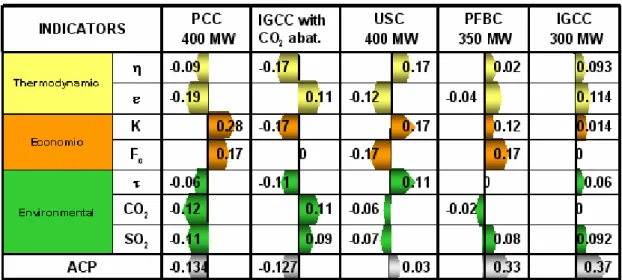
Figure 5.4: Comparison of coal technologies, with an equal weight distribution among
the indicators. (Reference Table 5.7)
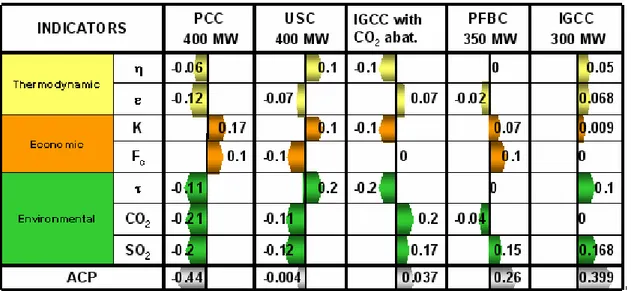
Concerning to the comparison between the various clean coal technologies, in absolute terms the IGCC technology seems to be the best one in perspective. Moreover, the use of abatement technologies, like CO2 capture, can be considered only if a great weight is attributed to the environmental dimension, like shown in figure 5.5. However, from the point of view of the ACP method it seems possible to conclude that, referring to the present technological level, CO2 capture seems not always to be a profitable option, since the reduction of CO2 emissions cannot compensate the reduction of thermodynamic efficiency and the increase of the costs.
163
Figure 5.5: Comparison of coal technologies giving a greater weight to the three
environmental indicators (reference Table 5.7)
In the view of these results, even though the conclusions should be treated with caution, some general considerations about the use of a method of multi-criteria assessment like the ACP can be formulated.
The instrument of ACP seems to really lead towards the direction of eco-efficiency, meaning the concept of making the same energetic “service” with a minor use of resources and impact on the environment. As showed in the tables above, the ACP method represents in a very clearly way, the main aspects of energy production systems. The indicators normalization helps us to easily compare the different power plants, in order to be able to select for the different scenarios the best energy production system, given by the different weight distributions. Moreover, the ACP method can be request to be use for a very different application fields.
In spite of the advantage named, the ACP method must be treated with great caution. This is supported by the fact that the ACP method is attached to a great grade of manipulation and inaccuracy. First of all, the different aggregation problems, like the selection of a correct number of indicators, or the random weight distribution, are a source of arbitrariness. Also very significant is the problem related to the indicators normalization, where the selection of the reference values can meaningfully change the
164
results obtained. Besides, the disagregation among the indicators describing the plant are cause of compromised results.
From this point of view, the ACP method can be a tool for supporting policy-maker, because is skilled to shows a picture of the energy systems, but it appears to be not particularly efficient in order to define a strategy for a correct approach to the energetic problem showing the guidelines for the development of new technologies and for the more efficient use of well known ones.
References
1 Afgan, N.H., Carvalho, M.G., Hovanov, N.V., 2000, “Energy system assessment with sustainability
indicators”, Energy policy; 28: pp. 603-612.
2 Afgan, N.H., Carvalho, M.G., 2002, “Multi-criteria assessment of new and renewable energy power
plants”, Energy; 27:pp. 739-755.
3 Giannantoni C, Mirandola A, Tonon S, Ulgiati S. 2002, “Energy-based, four sector Diagram of
Benefits as a Decision Making Tool”, In: Proc. of Advances in Energy Studies, Portovenere, pp. 575-586.
4
Tonon S, Brown MT, Luchi F, Mirandola A, Stoppato A, Ulgiati S. 2006, “An integrated assessment of energy conversion processes by means of thermodynamic, economic and environmental parameters”, Energy 31, Issue 1, pp. 149-163.
5 Munda, G., 1996, “Cost-benefit analysis in integrated environmental assessment: some methodological
issues” Ecological Economics,; 19, pp. 157-168
6 Diaz, A.R., Franco, A.R., 2004, “Consideration about the use of coal in advanced power generation
plants”, 59° Congresso ATI, Generazione di energia e conservazione dell’ambiente”, Genova, 14-17 settembre 2004
7
Franco, A,. Diaz, A.R., 2005, “Multi criteria assessment of energy conversion systems using aggregated indicators”, 18th International Conference on Efficiency, Cost, Optimization, Simulation and Environmental Impact of energy systems, Trondheim, Norway, June 20-22, 2005
8 Funtowicz, S.O., Munda, G., Paruccini, M., 1990, “The aggregation of environmental data using
multi-criteria methods“ Envirometrics, 1:pp. 353-368
165
10 Hasegawa, T., Sato M., Nakata T., 2001, “A Study of Combustion Characteristics of Gasified coal
Fuel,” Transactions of the ASME, Journal of Engineering for Gas Turbines and Power, 123, 22-32.
11 Lightfoot, H.D., Green, C., 2002, “An assessment of IPCC working group III findings of the potential
contribution of renewable energies to atmospheric carbon dioxide stabilization” Center for climate and global change research report 2002-5, McGill University.
12 Bernedes, E., 2002, “Bioenergy and water- The Implications of large scale Bioenergy production for
water use and supply” Global Environmental Change, 12, pp. 253-271
13
McNeil, J.R., 2000 “Something new under the sun – an environmental history of the twentieth century“ London: Penguins Books
14 Lako, P., 2004, “Coal-fired power technologies Coal-fired power options on the brink of climate
policies”, Rep. ECN-C-04-076, Clean coal technologies
15 Longwell, J.P., Rubint E.S., Wilson J., 1995, “Coal: energy for the future”, Prog. Energy Combust.
Science Vol. 21, pp. 269-360,.
16 Pfleger, D., 2002, “Clean Coal Technologies. Development Status”, In: Proc. of World coal institute