Università Politecnica delle Marche
Scuola di Dottorato di Ricerca in Scienze dell’Ingegneria Curriculum in Ingegneria Informatica, Gestionale e dell’Automazione
Senseable spaces: from a
theoretical perspective to the
application in augmented
environments
Ph.D. Dissertation of:
Roberto Pierdicca
Advisor:
Prof. Emanuele Frontoni
Coadvisor:
Prof. Eva Savina Malinverni
Curriculum Supervisor: Prof. Claudia Diamantini
Scuola di Dottorato di Ricerca in Scienze dell’Ingegneria Facoltá di Ingegneria
If we knew what it was we were doing,
it would not be called research, would it?
Acknowledgments
One thousand days are gone, or little more, from that day when I decided to undertake this way. Research means sacrifices, of course, but it was my only opportunity to feed my inborn need of curiosity. It was a change of habits, of friendships, of life. I’ll never be regretted of that choice of changing. I sow a ten of countries, uncovered different cultures, learned from the greatest researcher. For this, I’m glad to my supervisor, prof. Emanuele Frontoni. I want to thank him because he trusted in me. Come on, just a fullish could bet on an architect to get a Ph.D. in informatics. I thank Emanuele for being a leader, not a boss like I call him; for being straightforward when it was time to be; for being a friend, when among hundreds, he knew that his suggestion was worth. If I know my passion, now, I owe it to him.
But I had another supervisor, prof. Eva Savina Malinverni. Among several difficulties, we tried to follow a path together. And now, at the end, I’ m pretty sure that we won that bet. Sometimes, I’m sure, I disappointed her expectations. But for every mistake I did, she was there patient and wise like few others. She helped me not to loose the way, for both work and life. She was the only one that could understand when I was too busy. At the same time, she is an experienced professor and, always with patience, she gave me the knowledge to solve technical problems that emerged during our cooperation. If I know my direction, now, I owe it to her.
There are a lot of colleagues to mention: Marina, with whom I could converse for hours without never get bored. Daniele, who is always kind also if never agree. Paolo, without him, this thesis could not be written with Latex. And then Marco, Valerio, Primo, Gabriele, CAB, Annalisa, Rama, Gioele, Nora. Everyone of them added a bit more value to the passing of the meanwhile. I’m sure I’m forgetting someone. To whom I did not mention, thanks. But one, in particular, deserve my gratitude. Mirco, for being not only a colleague, for being a friend. I’ll not go in deep through the reasons, he knows that from my side, what he did, is admirable.
I also would like to express my gratitude to my parents, I’ll never forget what they did to make all my dreams real.
More than gratitude, I can just express my apologize to my family, to my wife, Mascha. I apologize for being far, for not being present like she deserves. My brother Alessio, he’s right, there is always time for a beer. I promised
have time to put remedy on it. But having the possibility, I would do it again, without regret. Because being far and busy means slavery for someone, but knowledge is freedom for someone else. Freedom is the most amazing cage that we have. The end of this Ph.D. course, is just a new beginning for us.
Ancona, November 2016
Abstract
Given the tremendous growth of ubiquitous services in our daily lives, during the last few decades we have witnessed a definitive change in the way users’ experience their surroundings. At the current state of art, devices are able to sense the environment and users’ location, enabling them to experience im-proved digital services. Along with the growing ubiquity of mobile technologies, they can be permitted to interact with the space and, which generally increases the information content of the space, creating synergistic loop between the use of the technology, and the use of the space itself.
Starting from such a premise, this thesis addresses the topic of exploring the relationship between the space, the users’ and technologies, investigating how pervasive digital tools can augment our environments and can leverage out new interactivity. Modern technological applications can dynamically deliver different kinds of data to the users, but they also allow for the extraction of data from them. We coined the term Senseable Space, to define the kinds of spaces able to provide users with contextual services, to measure and analyse their dynamics and to react accordingly, in a seamless exchange of information.
The research was performed embracing different application domains, with the main goal of understanding the dynamics of a space starting from the knowledge potentially available from users. This is for two reasons: first of all, even if the main activities have been conducted in the Cultural Heritage do-main, it is not sufficient to understand the limits and benefits of this paradigm through simple exploration of a single topic. Secondly, different domains have different needs, so that in order to understand the potential of Senseable Spaces, it has been fundamental value to compare with different scenario to outline the points of contact among these. Following the paradigm of Senseable Spaces as the main thread, we selected a set of experiences carried out in different fields; central to this investigation there is of course the user, placed in the dual roles of end-user and manager. Besides, both indoor and outdoor scenarios have been explored, since the knowledge of the operational condition of a space is a mandatory requirement for application of a particular use of the intended technology.
sciences and Retail.
For the Cultural Heritage panorama, different pilot projects have been con-structed from creating museum based installations to developing mobile appli-cations for archaeological settings. Dealing with urban areas, app-based ser-vices are designed to facilitate the route finding in a urban park and to provide contextual information in a city festival. We also outlined a novel application to facilitate the on-site inspection by risk managers thanks to the use of Aug-mented Reality services. Finally, a robust indoor localization system has been developed, designed to ease customer profiling in the retail sector. Building up such scenarios and architectures, we have attempted to address the following statement of the problem: are we able to design a space, regardless the domain, capable of bidirectional exchange of data between the space and the user? The thesis also demonstrates how Space Sensing and Geomatics are complementary to one another, given the assumption that the branches of Geomatics cover all the different scales of data collection, whilst Space Sensing gives one the possibility to provide the services at the correct location, at the correct time.
Acronyms
AI Artificial Intelligence AR Augmented Reality AH Architectural Heritage AmI Ambient Intelligence AOI Area of Interest
API Application Programming Interface AVM Automatic Vehicle Monitoring BLE Bluetooth Low Energy
BS Buffer Strips
CAD Computer Aided Design CH Cultural Heritage
DCH Digital Cultural Heritage GIS Geographical Information System GNSS Global Navigation Satellite System GPS Global Positioning System
HHD Hand Held Devices HMD Head-Mounted Devices
ICT Information and Communication Technologies LBS Location Based Services
LCLU Land Cover / Land Use LOD Level of Detail
MAR Mobile Augmented Reality
MISP Multiple Images Spherical Photogrammetry MVS Multi-View Stereo
SDK Software Development Kit TTFF Time of First Fixation TLS Terrestrial Laser Scanner
RSSI Received Signal Strength Indication SfM Structure from Motion
VR Virtual Reality
UGD Users Generated Data UUID Universally Unique Identifier WSN Wireless Sensors Network
Contents
1 Introduction. A theoretical perspective from augmented spaces to
senseable spaces 1
1.1 The relation between spaces, users and technologies . . . 3
1.2 The case of Senseable city Lab as a reference . . . 5
1.3 Geomatics: a fundamental source of data . . . 9
2 Augmented Reality tools and applications. 13 2.1 Background . . . 14
2.2 Enabling Technologies . . . 15
2.2.1 Tracking systems . . . 16
2.2.2 AR Development tools . . . 18
2.2.3 Systems and devices . . . 20
2.3 Taxonomy of applications for the Cultural Heritage domain . . 20
2.3.1 Archaeology. . . 21
2.3.2 Musealization . . . 22
2.3.3 Tourism . . . 24
2.3.4 Restoration . . . 26
2.3.5 Learning and Education . . . 26
3 Use cases and results. Applications of Senseable Spaces 29 3.1 Senseable Spaces and Digital Cultural Heritage . . . 30
3.1.1 Real case exhibitions in museums environments . . . 31
3.1.2 AR and geomatics to support Archaeology . . . 47
3.2 Senseable Public Open Spaces. . . 56
3.2.1 ICT and Public Spaces. . . 58
3.3 Senseable Spaces and Geosciences. . . 75
3.3.1 Smart maintenance of river banks with the use of Aug-mented Reality . . . 76
3.4 Senseable Spaces and Retail . . . 87
3.4.1 Intelligent Retail Environment . . . 88
4 Discussion. Limitations, challenges, lesson learnt 105 4.1 Limitations . . . 106
4.3 Lesson Learnt . . . 108
5 Conclusions and future works 111 5.1 Thesis contributions . . . 111 5.2 Future works . . . 112
List of Figures
3.1 The marker less tracking creation. . . 33
3.2 Phases and connections between elements: the production chain from the LHR acquisition to the exhibition. . . 33
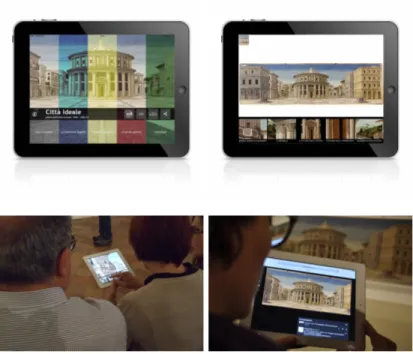
3.3 Città Ideale app. The top images show two screenshots of the mobile ap-plication, the home page and the High Resolution sections. The bottom images show visitors using the app in front of the painting . . . 35
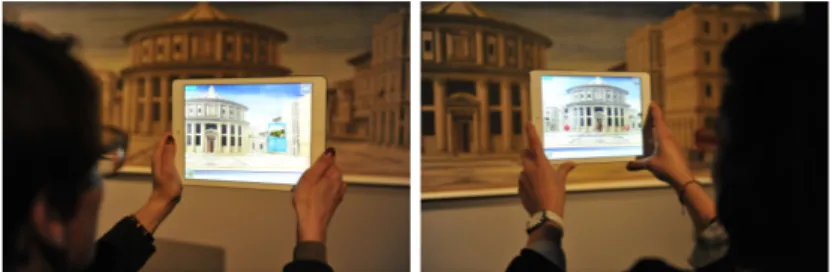
3.4 Augmented Reality application. Contents like images or videos are super-imposed over the tablet screen. . . 36
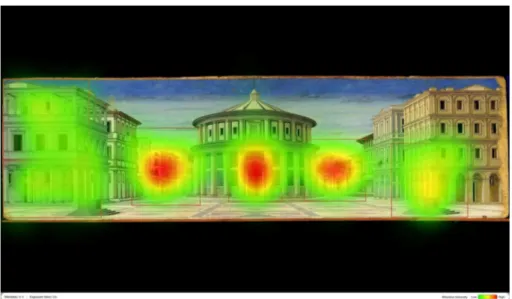
3.5 ”The Ideal City” painting (Task 2) . . . 39
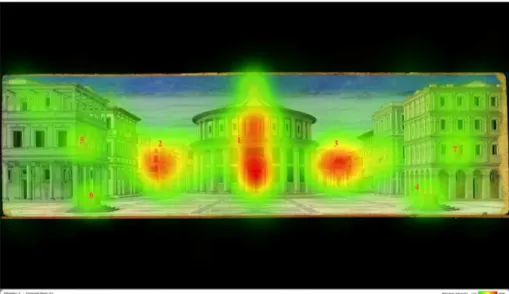
3.6 Heat map of ”The Ideal City” with free-screening . . . 40
3.7 Heat map of ”The Ideal City” with 6 areas of interest . . . 41
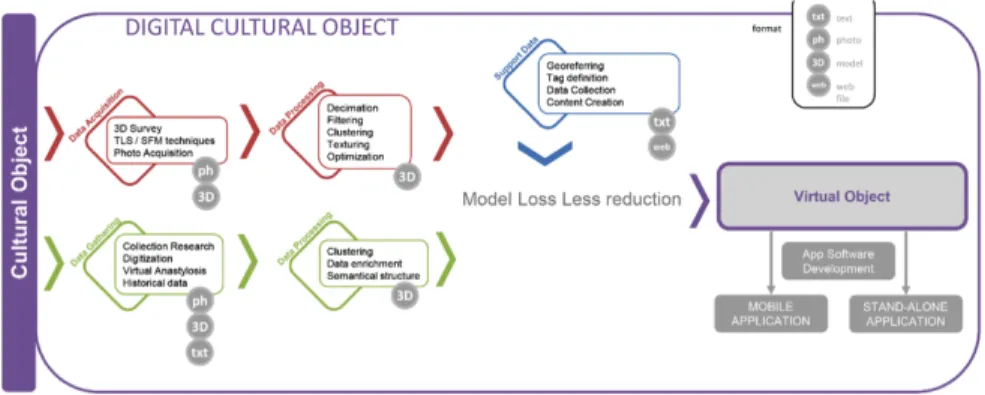
3.8 Pipeline of digital object development, management and its ex-ploitation in multimedia applications . . . 44
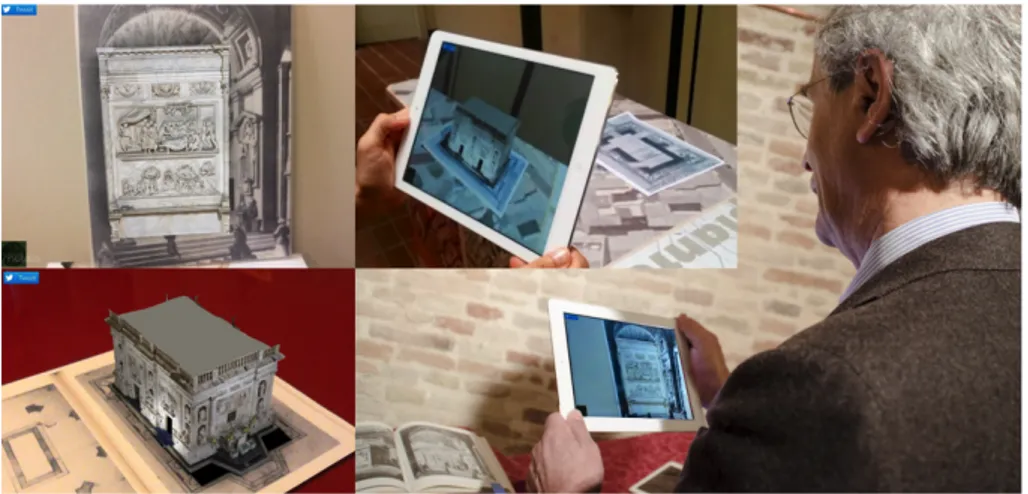
3.9 The Bramante I-Book: the application shows 3D reconstructions when the user point the related pictures and plans . . . 46
3.10 The “3D/Thirties architecture” exhibition and Ridolfi’s app . . 47
3.11 Large coverings that spoil the visual impact of the building and decorations. . . 50
3.12 Pipeline of digital object development, management and ex-ploitation in multimedia applications. Oval labels represent the problem that each technology is able to solve for a complete fruition of heritage goods. . . 51
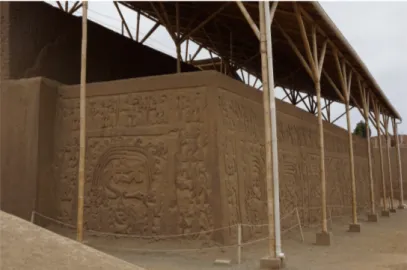
3.13 The wall-mounted poster representing the 3D virtual reconstruc-tion of Huaca Arco Iris. Decorareconstruc-tion has been labelled with E (stand for External) and I (stand for Internal) to help the user orienting during the navigation. . . 52
3.14 a) The structure when the browser is opened. The darker areas are the bas-relieves visible from the current point of view. If the mouse is above the bas-relieve (number 7 in the picture), its area is highlighted and a tip is shown. b) The sidebar is active and the user can choose the highlighted bas-relieve. . . 53
3.15 Museum installation: a: visitors looking at the web site in anagliph mode. b: the virtual tour of the Chan Chan site. c and d: visitors exploring 3D models in AR . . . 54
3.16 The workflow to create an AR visualization experience starts from the data collection, their storage and management until their visualization. Every step is mandatory, since the metadata and attributes are necessary to move on the following step. . . 55 3.17 AR visualization of the 3D model of the Roman theatre of Fano:
all images show the virtual anastylosis model, bottom on the left a screen shot of the reality-based model. . . 57 3.18 One of the main entrance of the park. The lack of care and signs
makes the park inaccessible and difficult to visit. . . 61 3.19 Map of the park with all the starting point highlighted in yellow. 62 3.20 The steps of the architecture during on site visit. . . 63 3.21 Mobile application running in the park, in way finding mode. . . 64 3.22 Steps for the implementation of the edge extraction from the real scene. . 65 3.23 Mobile application running with edge tracking enabled near the POI. . . 65 3.24 System architecture with main components and their
tions. AVM sends data to the cloud through a 3G/4G connec-tion. Mobile devices, connected to internet, access cloud services getting buses’ info and putting localization data. Localization data are obtained with beacons.. . . 68 3.25 Map of attractions and events. The map also reports the
posi-tions of bus terminal, event areas, beacons (red circles) used as monitoring tools for a specific attraction, attractions not mon-itored for the test (green circles). In the upper left corner the location of Mogliano in central Italy. . . 70 3.26 The mobile application running during the event: a) the main attractions.
b) the positions of bus stops. . . 72 3.27 Number of tracked devices over time. Tracking data start from
08:40 p.m. and end immediately after 04:00 a.m.. Data are aggregated over time every 5 minutes. Trend is represented as a black dashed line. . . 73 3.28 Heat-map of people passing. Red area around beacon indicates
a higher number of tracked devices.. . . 75 3.29 The cycle of environmental monitoring: the process starts with
the AR visualization of GIS data and can be endlessly repeated since the app is directly linked with the server. . . 78 3.30 Case study area viewed on WorldView 2. Left: assignment of
each piece of land along the water courses to a specific buffer strip typology. Center: buffer strips built by buffering parcels accord-ing to a given distance from the river streams (red). Right: de-tailed view of intersections between classified parcels and buffer strips. . . 80 3.31 System architecture diagram and test-bed.. . . 82
List of Figures 3.32 Standard data layer architecture of the main system, with the
data structure of every components. . . 83 3.33 Screenshot in landscape mode, taken during on-site inspection.
On the upper side, the radar guides the user among the coun-tryside towards the POIs. The red line is the buffer strip that appears automatically when the user gets into the radius of in-fluence. The lower side shows the strip typology, the metadata arising from the GIS database. . . 85 3.34 a: POI visualization on the map. b: Real time visualization of buffer strip
(in red) with the possibility to share information or comments.. . . 86 3.35 System architecture with main components and exchanged data. 91 3.36 Indoor localization application. On the left a picture of the showroom
with marked ground-truth points. On the right a screenshot of the mobile application, based on Estimote SDK with developed additional functions, to send raw data to the server and to visualize compass orientation and received relative coordinates. . . 92 3.37 RGB-D sensors system. On the left the top-view RGB image of
a person walking inside camera coverage area. On the right the depth image of the identified person labeled with PeopleID. . 93 3.38 “Kalman position estimator”. “Beacon position estimation” and
“RGB-D position estimation” fused together to obtain a more
accurate localization of the BLE device.n. . . 94 3.39 Showroom floor plan with positioning framework. Beacons
(B1-B6), RGB-D camera (RGB-D) with coverage area (grey dashed rectangle), electrical panel (SRC labelled hashed block), furni-ture (hashed blocks), area of interest grid (blue dashed lines). . 95 3.40 Estimated distance comparison for different real distances.
Fil-tered samples are reported as red circles and outlier samples as blue circles. . . 96 3.41 RSSI and distance relation. RSSI values of filtered samples are
represented with gray crosses at their real distances. Median value is traced as red line. . . 97 3.42 Estimation error over time for different broadcasting power. . . 98 3.43 Error-map for “Beacons position estimation”. . . 98 3.44 Comparison of mean square error between “Beacons position
es-timation” and “Kalman position estimation”. In “Beacons po-sition estimation” the maximum error is 5.2m, with an average
error of 1.9 ± 1.0m. In “Kalman position estimation” the maxi-mum error is 3.2m, with an average error 1.0 ± 0.7m.. . . 100 3.45 Error-map for “Kalman position estimation”. . . . 100
3.46 Markov chain with a posteriori probabilities. Nodes represent “area of interest” with presence probability, darker colours indi-cated high probabilities. Links represent passages between adja-cent areas with transition probability. For example, node F has the higher presence probability of 25%, while link C → B has the higher transition probability of 76%. . . 102 3.47 Heat-maps of paths. Darker colours represent visited areas with
a longer permanence time (approximately 20 seconds). . . 103 3.48 Heat-maps of paths computed by cluster. Darker colours
sent a longer permanence time. Arrows are a schematic repre-sentation of flow analysis. . . 104
List of Tables
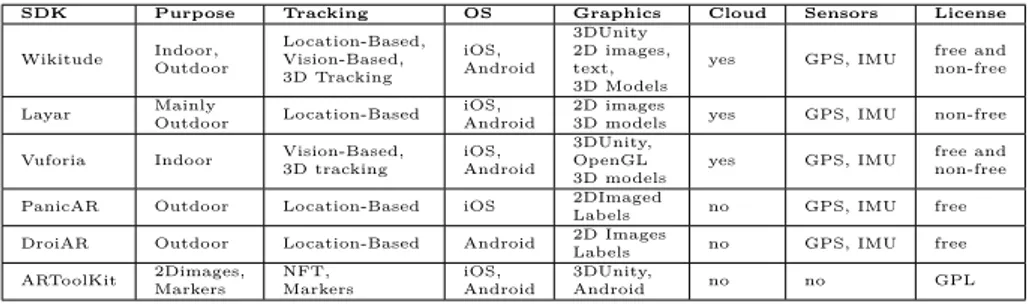
2.1 Comparison between the most commonly adopted frameworks in the field of DCH, divided in free and commercial to be adopted for both indoor and outdoor scenario . . . 19 3.1 Location names and installed beacons. For each location it is
indicated the area in square meters and the corresponding ca-pacity in number of people (considering a density of 0.4 sqm per people in a crowded event). . . 71 3.2 Sample data record for each tracked device. . . 73 3.3 Locations with installed beacons. For each point of interest
av-erage visiting time in seconds and number of people passing. . 74 3.4 Confusion matrix of classified “Kalman position estimation” per
“area of interest”. For each ground-truth area in the rows, withr,
columns report percentage of classified area, withc. Bold values
in the main diagonal (e.g., 89.9% for Br and Bc) represent
per-centage of correctly classified, while the others are misclassified. Symbol – indicates no misclassified points with the area reported in the corresponding column. First row, withb, reported results
of classified “Beacon position estimation” for area A where is installed the RGB-D camera.
. . . 101 3.5 Path clustering results compared with range of ages. Bold values
represent the correspondence between cluster and range of ages. . . . 103 4.1 Summary of challenges, limitation and issues related to the
Chapter 1
Introduction. A theoretical
perspective from augmented spaces
to senseable spaces
“Do we end up with a new experience in which the spatial and information layers are equally important?” With this question, Lev Manovic was introduc-ing, in 2006, the revolutionary concept of augmented spaces; in [1], the author synthesizes the space that we leave, made up of two layers: the physical (or tangible) dimension, and the digital (or intangible) one. The dissertation pro-vides a very simple and clear definition of this paradigm: “augmented space is the physical space overlaid with dynamically changing information. This information is likely to be in multimedia form and it is often localized for each user”. Now, ten years later, we can witness to the realization of this concept in our daily life. The two dimensions seem to mesh-up, in a seamless relation be-tween real and virtual. This is mostly because latest improvements on mobile devices capabilities are changing the way people interact with their surround-ings. Nowadays, devices are able to sense the environment and users’ location, enabling them to experience improved digital services. But this is not the only reason. In fact, mobile devices alone can just provide the users with tools (e.g applications) and services that can facilitate them in performing single tasks. Instead, along with the growing ubiquity of mobile technologies, they can be enabled to interact with the space, or better, with the objects that fit that space. And more, other data are produced from this interaction, creating a sort of loop between the use of the technology, and the use of the space itself. Starting from this assumption, this thesis addresses the topic of understanding the relation between the space, people and technologies and investigates how the ubiquity of digital tools can augment our environments and can leverage new ways of interaction. It uncovers how data from sensors can be presented to the observer in an intuitive manner, in the context of the observed environ-ment. In a focal role of this dissertation there is, of course, the user. In the first meaning of augmented spaces in fact, the stereotype imagery was a space with
digital ornament, lights, digital signage, with the idea of changing the space just with dynamic multimedia information projected on the walls. Let us say that in this kind of space, the human presence is just a passive spectator of a scene. Modern technological applications can dynamically deliver different kind of data to the users, or extract data from them, transforming the space from augmented to Senseable. In other words, the delivery of information to users in space, and the extraction of information about those users, are closely connected and pave the way towards the“ability to sense and make sense” of it. The research was experienced covering a wide spectrum of domains and topics, addressing the problem of defining new methods of observing the dynamics of a space, collecting data and using them with the twofold purpose of providing services, and enhancing the space itself.
The introduction Chapter of the present work is aimed at providing a wide overview about the concept of Senseable Space, starting from the growing con-nection between the space and the technology; afterwards, we make a focus over the most famous laboratory, taken as a reference for this work, which deal with these new concepts of Space Sensing: the Senseable City lab that Carlo Ratti founded in 2003 at the MIT in Boston, USA. As the author of this thesis, Carlo Ratti is an architect which fulfilled the cause of interweaving his back-ground of planner and designer with the usage of digital methods to uncover spaces’ dynamics, analysing them in real time and predicting their changes. The perspective of this work is provided highlighting the importance of data, regardless the type of data we are dealing with. We generally use to think that every discipline has its own kind of data, like compartments that cannot mesh up and support each other. But so often we forget that because of its nature, a data represent a measure. If we deal with spatio-temporal data, or geo-spatial data, we are measuring an event. In this, geomatics plays a pivotal role in terms of data acquisition from different data sources. For long time, geomatics has been considered the discipline to take measurement, rather then to mea-sure an event. The provisioning of affordable data, their management, their loss less simplification is essential to provide users with services that improve their experience of a Senseable Space.
The multidisciplinary nature of the presented work arose from the above mentioned assumptions.
With the second Chapter we provide a review the state of art about tech-nologies and application that, more then others, have demonstrated of being suitable for the development of new kinds of interaction and to make a space
Senseable, with low costs. Among the others, Augmented Reality (AR) is the
cutting edge technology in which we decided to investigate, since it embraces both the concepts of sensing the space and giving information. A particular focus have been devoted to the Cultural Heritage (CH) domain, one of the
1.1 The relation between spaces, users and technologies main research interest of the author, giving a wide overview about the research works conducted in the last decade around this domain. We will show how the use of AR incredibly contributed to the promotion of CH.
The use cases faced during the research activity are collected in Chapter 3. It represents the summa of different experiences, activities and best practices which can help to contribute, compared with the state of art, to better un-derstand the paradigm of a Senseable Space in different research areas. Each use case have been divided, to facilitate the reader, into a hierarchical scheme:
Scenario, System Architecture, Results. In this way we thought to better
high-light the benefits that the different approaches (in different domains), brought to the users. Chapter 4, besides arguing over the possibilities that the pro-posed paradigm opens up in different topics, summarizes also the challenges, the open issues and the limitations that require further investigations. From this, we outlined the future works, that are described in the Chapter5, together with our concluding remarks.
1.1 The relation between spaces, users and
technologies
While this new research paradigm of Senseable Spaces have been outlined, what is still missing is a description of the “components” that could make it possible. Manovic gave several examples of applications and technologies widely adopted to dynamically deliver data to, or extract data from, physical space. Video surveillance for instance have become ubiquitous. Cameras, are able to serve several purposes: real time tracking, recognition, localization. As well, even if in a completely different way, mobile phones act exactly in the same direction. Using the logs of a devices, we can understand the devices’ position (via wire-less connections in indoor, via GPS in outdoor) and from it give contextual information. It also makes sense to conceptually connect the surveillance/-monitoring of physical space and its dwellers, and the augmentation of this space with additional data, because technologically these two applications are in a symbiotic relationship. For instance, if one knows the location of a person equipped with a mobile phone, he can send his particular information relevant to that specific location via his mobile phones. Many others are the domain that converge to this problem. Ubiquitous Computing, Augmented Reality, Tangible Interfaces, Wearable Devices, Wireless Sensor Networks (WSN), Am-bient Intelligence (AmI), Internet of Things just to quote some. But while the technologies imagined by these research paradigms accomplish their intentions in a number of different ways, the end result is the same: “overlaying dynamic data over the physical space”. An old timeless quote by Mark Weiser [2]
af-firms that the most profound technologies are those that disappear. Despite it was coined more than a decade ago, this sentence is still an important guide-line for the development of smart objects. In the early nineties the idea of an environment with pervasive (but not intrusive) computing laid the foun-dations for Ubiquitous Computing. No revolution in artificial intelligence is needed, just the proper embedding of computers into the everyday world. All the above culminated in the so called (AmI ), that has definitively changed the way in which visitors interact with the space. We can define AmI a quite new archetype of information technology, designed to allow spaces of any kind to become sensitive, adaptive, and responsive to the needs of the people who live. One of its sub-domain is the Artificial Intelligence (AI ), which contribu-tion was to support people in their lives, becoming essential for almost every ambit. One of the main objectives of AI is to pervade our daily life environ-ments with non-invasive (and conceived) technologies able to supply humans with supplementary knowledge for making better decisions [3]. Towards this direction, research aims to include more intelligence into surroundings, trans-forming them into digital ambient aware and Senseable of human presence. A large number of embedded systems becomes the bridge between humans and computing. Computer-based artefacts are programmed in order to interact, analyse and cooperate with humans (human computation). In this field, future research will be carried on to use as much as possible of the human minds in every kind of environment. It is very important to gain users’ opinions, asking them to give a feedback. All this data can be coupled together to understand users’ needs
Given the above, it is particularly important to underline the crucial role of smart objects for the spreading of AmI. In addition to their increasing minia-turization, sensors, actuators, and processing units, they can be purchased at very inexpensive prices.
In the recent years, we witnessed to an improvement in the use of handy smart devices (e.g. mobile phones), insomuch that they are naturally extended to all areas of science like education, health, cultural heritage, entertainment, sports, transportation and many more, into a collaborative way of interaction. However, Pervasive Computing and Artificial Intelligence cannot embrace AmI themselves. Indeed, only AmI can brings together all these resources as well as many other areas to provide flexible and intelligent services to users acting in their environments [4,5].
AmI involves several areas: Ambient Assisted Living (AAL), video
surveil-lance, group interactions analysis, health care, collaborative context recognition for mobile devices and many others [6, 7,8]. Generally, vision and image pro-cessing are largely used to solve common aspects for the aforementioned fields. The key aspect for AmI lays in the possibility to provide services not for user
1.2 The case of Senseable city Lab as a reference request, but based over the intelligence of the system; this will allow the au-tomatic provision of services depending of the profile and the position of the user experiencing a task. Consequently, the interaction between spaces and users should be done through natural interfaces adapting to them habits and behaviours. To allow this interaction, it is enough to pair with their mobile devices. A network of sensor allows processing the context through the user interaction in real time [9], [10]. Anyway, the development and standardiza-tion of new low power consumpstandardiza-tion and short range wireless technologies have enabled the WSN concept. They present many advantages such as flexibility, adaptability and they are more rigid and consume less power [11]. Today, there are several options for the development of WSN and a wide range of scenarios between standards and technologies can be found [12].
Technology provides analytics taken from users’ interaction with spaces; in the retail sector for instance, it can give many information about customers, allowing the retailer to customize the shop to their needs and adapting prod-uct arrangements, expositions, design according to their behaviours. Data extracted in this way are objective; indeed, this kind of decision-making pro-cess is lead to an objective and reliable data collection. Intellectual approaches are not able to explain the complexity of consumer behaviours, because they arise from many aspects such as cultural context, habits and so on. Several aspects of these problems are currently solved using artificial intelligence and, in particular, vision [13]. Though retail is a suitable example, it is not the only domain exploiting this scenario. In the next paragraph some researches that embody the above are shown.
1.2 The case of Senseable city Lab as a reference
Summarizing all the abovementioned topics, researches and technologies into one laboratory, in 2003 Carlo Ratti founded the Senseable city lab at the MIT of Boston, USA. The core activities of the lab are oriented towards a pervasive data collection from users, from different data sources, to uncover humans dynamics and to support planners. In fact, since the spaces are generally designed for humans activities, the planning community should be interested from this gathering of information. As stated by Carlo Ratti “the way we describe and understand cities is being radically transformed, alongside the tools we use to design them and impact on their physical structure”. Human activities, nowadays, are strictly related to the use of their mobile phones. From them it is possible for instance, in different way that we will describe in the following, to extract data about vehicles. By tracking the single identifier (ID) of each device, or just analysing the phone calls by cells, we can monitor vehicle origins and destinations that is fundamental for the planning process of
the infrastructures of a city. Several critical issues, like for instance patterns of congestion, can be derived. Moreover, to understand the benefits from a new area, will be useful to get the pedestrian flows [14] for inferring patterns from humans tracking (e.g. via GPS positioning services).
One of the major works by the lab, is described in [15]. It was conducted in Rome to outline the basis of urban planning using mobile phones and Lo-cation Based Services (LBS); exploiting utilities embedded in users’ personal devices, a set of applications can be built that exploit the knowledge of the geographical position of a mobile device in order to provide services based on that information. The main assumption from this work was that, if deployed to retrieve aggregated data in cities, LBS could become a powerful tool for urban analysis. But the benefits are not just for the urban planning itself, but also for the whole community living the urban environment. The beneficiaries can be different: single users, (it is now a well established technology the one that allow providing weather forecasts in case of a possible emergency like a flood), group of users (it is recent the success of Pokemon Go application, a game that exploits users’ location and AR to discover virtual objects in the real scene, in a sort of collaborative game) and providers (just think to the improvement that can be given to the network’s performances whether the provider could know in real time traffic overflows).
The aim of the project “Mobile Landscapes” was to review and introduce the potential of this technology to the urban planning community. In addition, it presents an application in the metropolitan area of Milan, in Italy, based on the geographical mapping of mobile phones usage at different times of the day. In a predefined temporal range, information from mobile phones activities were acquired and analysed with the specific task of urban dynamics understanding. Results seemed to open a new promising line of urban research. Making sense of the unlimited flow of data from the mobile phones infrastructure in the urban context is still unexplored territory. Through the analysis of data coming from base stations, urban planners can gain the ability to monitor rapidly changing urban dynamics, which are difficult to capture by traditional surveys. With the massive spread of hand held devices in the past years, the mobile phones infrastructure could provide an unlimited source of information about the city in ever finer detail. The challenge for urban researchers is to learn how to exploit this information to gain a better understanding of the city.
It is also the case of the study conducted by the Lab to investigate mobile phones traffic records in different cities [16]. From the analysis emerge that it is possible to outline and predict future trends in the way the expansion of the city is going, and it is also possible to infer statistical patterns which have great potential in terms of economics growth. Monitoring and tracking the so-called User Generated Data (UGDs) represent the future pathway for
ob-1.2 The case of Senseable city Lab as a reference serving, recording, and analysing the dynamics of our environments (i.e. cities, Urban Open Spaces, rural areas, etc.) and, more in general, the behaviour of people who live these spaces. This is the era of Digital Footprints, left by indi-viduals in their daily activities, which can be used as data to make statistics and to extract metrics about our spaces, directly from the users [17]. These infor-mation sources are geo-located and embody numerous opportunities, as they offer the possibility of working with high spatial and temporal data, always available and always updated. The advantage of collecting Digital Footprints ranges among different domains, for example security, cities management, retail and cultural heritage. Also in tourism, collecting and analysing Digital Foot-prints can be useful from the perspective of understanding the tourists’ point of view and behaviour in relation to a destination. The tourism experience is nowadays strictly related to the digital approach. In fact, people visiting a new place start their planning from the web, which offers the broader set of oppor-tunity and makes the users’ feedback the major criteria of decision. The stage of preparation of the trip is generally followed by the visiting experience, when tourists collect pictures and share insights. Furthermore, it concludes at home, when photographs and experiences are made available to networks of friends or other potential tourists. The tracking, collection and analysis of these Digital Footprints can be a valuable source of information for both tourists and stake-holders. Tourists can take their decisions with more awareness about the place they are going to visit. Digitally active stakeholders, in particular tourism and hospitality operators can easily obtain the users’ feedback to evaluate the per-formances of their offers, and also reach a worldwide public. Tourism data are important for destinations, especially for planning, forecasting tourism demand, marketing, measuring economic impacts and benchmarking. Digital Footprints can be classified as passive and active. Passive tracks are left through inter-action with an infrastructure, such as a mobile phone network, that produces entries in locational logs. Active prints come from the users themselves when they expose locational data in photos, messages, and sensor measurements. In [18] for example, geo-tagged crowd-sourced pictures where used to understand the dynamics of flows of tourists in Rome. Another example can be found in [19].
Dealing with cities’ dynamics, it is also fundamental to discuss about the City Guide to Copenhagen project [20] which has the aim of designing, visualizing, and presenting innovative applications for mobility, with particular emphasis on parking infrastructure, multimodal transportation solutions, and methods to enhance the experience of using public transport in Copenhagen. Another important aspect could be to change human habits by improving alternative services (bike, trains, etc) thanks to the use of data. Sensors for real time parking availability are in a real time contact with a mobile application to give
information to the bikers like health, suggested path to reach the place and other tools. The advantage: providing services to the users, and get information from them.
Related to the city space, not only the human activity is important, but also the quality of life and the conditions of air pollution, recognized as the world’ s largest environmental and human health threat[21]. By merging different data, from air pollution data and UGDs, it was possible to quantify the exposure of people to the most polluted areas. Evaluating population’s exposure to air pollution using spatiotemporal mobility patterns, warrants consideration in future environmental epidemiological studies linking air quality and human health.
From the above emerged that the use of data collected from humans’ activity, monitored through different kinds of connections and technologies, is possible to embrace an incredible number of domains (tourism, urban planning, en-vironmental monitoring) and to address different needs (contextual services, planning criterion establishment, hazards identification). Until now, only the outdoor settings have been discussed. But of course, also an indoor scenario is able to become Senseable, likewise analyzing similar dynamics, with similar solution but with a different architecture. While in outdoor the amount of data is at a global scale, and it can reach almost every user with global positioning services, dealing with indoor cases means to built up ad-hoc solutions, even if standardized, to address the task of providing and collecting data from the users. Like in the case of Louvre museum [22] , where an ad-hoc WSN based on Bluetooth radio signal was installed for the monitoring of visitors inside the museum. The main reason of this study was the so-called “hypercongestion”, wherein the number of visitors exceeds the capacity of the physical space of the museum. This can potentially be detrimental to the quality of visitors’ ex-periences, through disturbance by the behavior and presence of other visitors. Although this situation can be mitigated by managing visitors’ flow between spaces, a detailed analysis of visitor movement is required to realize fully and apply a proper solution to the problem. This problem of movement and cir-culation patterns in museums was already recognized in the literature as an important topic for research [23]. The use of large-scale datasets enables mu-seums managers to discover and analyze frequent patterns in human activities. Such analyses have been conducted in the specific spatio-temporal range. A Bluetooth proximity-detection approach to the analysis of visitor behavior in museums has many advantages. Contrary to the granular mobile-phone track-ing, the detecting scale using Bluetooth is much more fine grained. In addition, in contrast to RFID tags and active mobile-phone tracking with or without, with Bluetooth previous registration is not required and it is not necessary to attach any devices or tags. Moreover, also other features of the behavior of
1.3 Geomatics: a fundamental source of data the long-stay and short-stay visitors, including the path sequence length and the unique nodes visited were derived. Visitors’ paths and their variations are quite selective, with visitors mostly choosing the same paths in terms of se-quence, length and sequential order. Although many other options exist, all these information are needful to improve the museum layout and eventually intervene in a more reliable and efficient way.
The analysis of the works by the Senseable City lab demonstrates that this research topic is emerging and could bring its benefits in almost every domain in which the planning process is required. Notwithstanding, the efforts backed to provide and obtain data, are joint by a fundamental action: to measure. We witnessed to the tremendous growth of localization, even thought with different methods and aims. But localize means measure. Moreover, the main task demanded to a Senseable Space, is to measure a certain event and, if possible, to react on it through the provisioning of services to the user. Obviously, those actions are possible just with the use of data, measured data. And it is exactly in this dichotomy that geomatics plays a pivotal role, the science of collecting and providing data, that, in turns, have been measured as well. In the following, a brief dissertation about the “new” meaning of geomatics will be given: geomatics as a fundamental source of data.
1.3 Geomatics: a fundamental source of data
We have described, up to know, the new possibilities offered by devices, sen-sors and technologies to sense the environment; the data exchange among the user and the space proved to be a winning solution for several domains: urban planning, indoor spaces (e.g. museums), geography, retail and many more. We also described some of the services that can be provided to the user accord-ing to their location. However, the service for the users cannot be seen just like a notification in a phone or just the number of visitor of a space. The services for the users come from data that they can: interact with, manage and that can improve their knowledge about that specific space. To provide users with contents, there is the need to collect information, from different data sources, and to present them in the right form to be managed. Taking into account the introductory statement that a Senseable Space is such, just if we are able to measure it, alongwith the changing dynamics in it, the applied science which brings a strong contribution in this direction is geomatics. A revolutionary turning point about the concept of geomatics was brought by the research paper titled “Geomatics and the new Cyber-Infrastructure” [24]. Authors state that geomatics deals with multi-resolution geospatial and spatio-temporal information for all kinds of scientific, engineering and administrative applications.
This sentence can be summarized as follows: geomatics is far from the con-cept of simply measuring distances and angles. A few decades ago, surveying technology and engineering involved only distance and angle measurements and their reduction to geodetic networks for cadastral and topographical mapping applications. Survey triangulation, trilateration and even precise levelling have now largely been replaced by Global Positioning System (GPS) applications for positioning and navigation in various modes of implementation. Satellite imagery of various types and specifications are becoming available globally in near real-time for environmental and related applications. Multi-resolution geospatial data (and metadata) refer to the observations and/or measurements at multiple scalar, spectral and temporal resolutions, such as digital imagery at various pixel sizes and spectral bands which can provide different seasonal coverages. Surveying still plays a leading technological role, but it has evolved in new forms: positioning and navigation can be obtained with several de-vices that were not properly conceived to accomplish these tasks; topographical mapping, one time conducted with bulky instruments requiring complex com-putation made by the workers, has now become a byproduct of Geospatial or Geographical Information Systems (GIS); digital images, obtained with differ-ent sensors (from satellite images to smartphones), can be used to accomplish both the tasks of classifying the environment or make a virtual reconstruction. Survey networks and photogrammetric adjustment computations have largely been replaced by more sophisticated digital processing with adaptive designs and implementations, or ready to use equipments like Terrestrial Laser Scan-ners (TLS). The transition from analogue to digital methodologies, moreover, has not only resulted from the availability of ubiquitous computers, but has shown to be superior in just about every aspect of data processing and infor-mation extraction and identification. Furthermore, as in many other fields of endeavour, computation is now regarded as a primary driver of innovation.
This scenario makes it clear that the digitalization of information enables a rapid and wide dissemination of knowledge, increasing the number of people that can have access to data, improving the sharing and enhancing the quality and the accuracy of the knowledge itself [25]. Moreover, the actual amount of sensors and measuring systems of physical and environmental phenomena allows us to talk easily about “Space Sensing” as a widespread and pervasive approach to understanding the dynamics of the contemporary environments (both indoor and outdoor). What is still missing is the possibility to provide the user with these data in a complete form, and more, how the physical con-formation of the space can be changed from the incon-formation extracted from it.
A huge help can be exploited from geomatics applications, which are able to cover different working scales [26], as well as to produce different outcomes that
1.3 Geomatics: a fundamental source of data are useful for the whole meaning of a Senseable Space. Analysis tasks can be performed at a regional level thanks to the use of high resolution images from satellite or aerial images; inferring information is possible thanks to land usage classification [27], as well describing the shape thanks to ranging techniques like LiDAR and Radar pulse. Dealing with architectural scale complex objects, the possibilities offered by new acquisition devices are wide. Low cost equipments (i.e. cameras, small drones, depth sensors, and so on) are capable to accomplish reconstructions tasks. Of course, there is also the accuracy issue to take into account; in fact, geo-referencing complex models requires more sophisticate and accurate data sources like GNSS (Global Navigation Satellite System) receiver or TLS. In the case of small objects or artefacts, terrestrial imagery and close range data are the best solution to obtain detailed information about them. Thus, since we live in an almost well connected digital world, geomatics can play a new role in research and development involving geospatial and related information, as well as creating entrepreneurial opportunities.
The following are listed some potential areas of application that are closely related to geomatics, emerged from the previous analysis: natural environment, quality of life in rural and urban environments, predicting, protecting against and recovering from natural and human disasters, archaeological sites docu-mentation and preservation, just to mention some. We can summarize that geomatics is able to cover the spectrum of almost every scale; even though there is no panacea, the integration of all these data and techniques is defi-nitely the best solution for 3D surveying, positioning and feature extraction. This concept will become more clear in the Chapter3, where the set of scenar-ios described demonstrates that the winning solution for the different domain is the merging of data from different sources. Data fusion, or data integration, refers to the process of merging data (and knowledge) coming from different sources (or sensors) - and, generally, at different geometric resolution - but rep-resenting the same real-world object in order to produce a consistent, accurate and useful representation. Data fusion processes are often categorized as low, intermediate or high, depending on the processing stage at which fusion takes place. Low level data fusion combines several sources of raw data to produce new raw data. The expectation is that fused data is more informative and synthetic than the original inputs [28].
As well, data visualization has to be considered a core step of the system. If, for example, we are dealing with environmental monitoring tasks, the starting point is a map, obtained with well established processes. From it, it is possible to infer information and extract knowledge of a large scale territory. And, it can also be managed into a GIS environment to add (meta)data to it. However, the map can be fully exploited directly on site, where the operator have the possibility to perform his task with the help of the real environment. The
task of the Senseable Space is to provide this information to the operator in real time, for instance with his own mobile device. But it is not enough; for completing the system, it is necessary that the user is able to visualize the map, to update its own information, and in the meanwhile to be monitored in his task (for instance by using his Digital Footprints), so that the bidirectional process of providing/getting information can be accomplished. The same example can be done for indoor spaces. If we imagine a space where some sensors (e.g. beacons) are able to track people movement, one of the main task delegated to geomatics is to perform his/her geo-location into the WSN built. If we know the position of this user (e.g. visitor in the case of a museum, a customer in the case of a retail mall), we can provide him with contextual information. These information are always asked to be produced with geomatics techniques (3D reconstructions for instance), that need both acquisition and computation tasks to be visualized in the proper way. Finally, the knowledge of the visitor path provides useful insights to re-arrange the space, if, for instance, some of these data are not visualized or some areas are not visited.
The ones given above are just few examples of how spatial data are a funda-mental component of a Senseable Space. All the scenarios that will be detailed in Chapter 3 move in this direction; a multidisciplinary work, experienced in different domains, with the main thread of providing/extracting data, with the user at the center, computer science as the link, and geomatics as the mean.
Chapter 2
Augmented Reality tools and
applications.
The concept of “augmentation” outlined in Chapter 1 put in evidence the need to mesh-up two dimensional layers (the physical and the virtual) into a single one. It was also described how an augmented space can become a
Senseable Space, thanks to the use of sensors and services which make our
devices able to sense the environment, to get information from the users and give back them services accordingly. We can sum up the above into 3 steps: sense, get and give. Augmented Reality, briefly known as AR, provides these three services. Mainly in the last years has had an increasing importance as growing technology in the field of Computer Vision and Mobile Computing. The main ability of AR is to add virtual objects in real world, enhancing the experience of the users with the reality. According to [29], AR completes reality without completely replacing it. So, it helps users to feel, see and hear better, increasing their perception [30], through the addition of virtual objects and images. Consequently, AR can be potentially applied to all senses (hearing, touch and smell), enhancing sensory experiences through computer-generated contents and eventually other sensory digital inputs with the purpose of increasing knowledge about our surroundings. Taking into account the work of [31], an AR system has the following characteristics: i) to combine real world and virtual objects, ii) to run in real-time, and iii) to allow the interaction between the users and virtual objects [32]. Given these definitions, it is simple to deduce that AR can be used (and useful) for almost every domain of research. Medicine [33], maintenance [34]), environmental monitoring [35], retail are just few examples of topics where AR has been largely adopted [36].
AR have been the main focus of this research; the main purpose, was pro-viding contextual information to the user with a technology that is not well established at all so far. Among the others, CH is probably the one who mostly benefits from the use of this technology. In fact, thanks to the use of AR, users are enabled for a completely new way of experiencing cultural goods. However, even if the literature provides a plethora of new application grown in the last
decade with the purpose of enhancing the perception of artworks with digital contents and new way of interaction, up to now there is not an available lit-erature review collecting the main novelties in this field. During the studies conducted by he authors, emerges a lack of a survey able to summarize the main works of AR in the CH domain and demonstrating important research problems or future directions.
Although the multidisciplinary nature of this work brought to uncover the potential of this technology among different domains, as stated in the intro-duction section, the major efforts were undertaken towards the CH domain. A systematic literature review (SLR) was performed in order to understand the research issues related to the use of AR for CH, and more, to understand if and how this technology could help the creation of a Senseable Space in the CH panorama. That is to say, how AR can improve the fruition of the CH sites like museums, archaeological sites and so on?
In the following, besides a brief overview about AR definitions and enabling technologies, a specific focus on the CH panorama is presented, with the defi-nition of a taxonomy created according to the SLR performed.
2.1 Background
Mainly since 2001, AR became an important area of research for CH when it was for the first time applied [37]. CH domain witnessed to a crucial turn-ing point in the way in which art is experienced by the users. Research has increasingly focused on emergent technologies and mediums to improve the digitization of CH. Speed up in innovation is strictly related to several aspects, being technological and anthropological. Mobile devices are increasing their popularity among people as well as the significant development of user mod-elling and personalization processes which places the user at the center of the learning process. AR is a valid technology able to virtually reconstruct de-stroyed monument and historical building, enhancing the experience of users when they visit ruined cultural heritage sites [38]. In education, AR systems represent a platform of learning, motivating and understanding of events and historical elements for the students and researchers. The importance of virtual restitution of historical sites is to preserve, protect and interpret our culture and history. In [39], the authors indicated in seven points the importance of AR applications applied to CH.
In recent years, CH domain witnessed to a crucial turning point in the way in which art is experienced by the users. Research has increasingly focused on emergent technologies and innovations (e.g. virtual learning environments) to improve the digitization of CH. Devices can sense the environment (and the user location) thanks to the growing enhancement of built-in sensors. The
2.2 Enabling Technologies ability to provide visitors with digital services is a key aspect to make spaces more accessible [40], interactive and enjoyable. AR is able to deliver these ser-vices, since it gives the possibility to overlay virtual information about physical objects directly above the device’ s screen. AR browsers have great potential to improve way-finding and context-awareness services for users. This aspect is taking a strong impact even in the world of CH. Insiders, archaeologists, scientists, researchers wonder how to make more appealing museums, their ex-hibition areas, their heritage and so on. In [41], the authors propose an efficient system able to guide visitors using informative contents related to the exhibi-tion. The major contribution of their proposal is the ability to integrate a standard solution with multimedia services. Moreover, to create a narrative process enhanced by multimedia cultural resources, digital storytelling has an important role since exploits these digital tools for editing and increasing the diffusion of contents [42].
This was made possible thanks to the enhancement by [43], [44], because they increase computational capabilities, sensor equipment and the advancement of 3D accelerated graphics technologies for hand-held devices. For these reasons, they are relevant example to be mentioned. In general, AR applications have been also developed for archaeological settings. For example, considering re-cent works [45], historical and archaeological aspects are combined to obtain a most real environment where the archaeological ruins are arranged with the ancient landscape. Another recent AR application for archaeological sites is known as ARAC Maps Eggert [46], where the aim is to enhance archaeological maps combining 3D models with other possible interactive approaches. There are other approaches, much more simple, that do not use particular hardware devices. In these kind of applications, where an example is described in [47], the innovative aspect is the ability to show the virtual reconstruction on a real context with an immediate dimensional and spatial feedback.
In general, the projects that involve AR applied to architecture, landscape and archaeology (and more in general to CH) are developed by a team of specialists in different disciplines that allows a responsible and efficient use of Informa-tion and CommunicaInforma-tion Technologies (ICT) and computer-mediated reality in knowledge-based experiences [48]. The introduction of innovative digital tools has the aim to provide users, with different skills, with useful instruments for the knowledge and dissemination of artistic and architectural heritage.
2.2 Enabling Technologies
Experiencing AR application is related to a set of choices that, during the de-sign phase, one has to take into account, in order to provide the user with the best solution. There are several important aspects for creating appropriate
experiences, allowing the end users to interact with virtual contents in an intu-itive way. These aspects can be summarized in three main components: first of all, the tracking system, which represents the core aspect in order to make the device able to interpret the environment. Secondly, the choice of the develop-ment framework, whose choice is generally oriented among free or commercial platforms, besides the tracking technology they are able to provide. Last but not least, the system and devices that are chosen for the experience; hand held or head mounted devices implies several decisions to undertake. Even if this dissertation is more oriented towards the Cultural Heritage panorama, it is worthwhile to give the reader an overview of the state of art systems and enabling technologies. Referring to the considered period of this study, the first important review about AR system can be dated back to 2008 [49]; in order to establish the geometrical relationship between the user’s viewpoint, the display, and the environment many technologies can be used. Widely used in the CH frame are based on vision [50] and sensors [51] tracking. These approaches are used to display virtual contents properly registered within the environment. To maintain frame coherency between the content and the camera, there is a need of continuous tracking. In the following, these aspects are showed in detail with different use cases.
2.2.1 Tracking systems
Detection, tracking and pose estimation. These are the main steps that a device performs in order to superimpose the virtual object co-existing with the real scene. Tracking, or camera pose determination, is the main technical challenge in creating AR experiences. As discussed in the following section, the main purpose of using AR in CH is to communicate a cultural good, or a cultural place, through the use of a device. The augmentation of them is related to the way in which programmers enable the device to recognize the scene, hence, the proper tracking system is required. For instance, if we move in outdoor environment and we want to drive the user into an unfamiliar environment like an archaeological site, the use of the GPS, compass and gyroscope is necessary to retrieve his/her location. See [52] for a good explanation on how the regis-tration step can be achieved. On the contrary, when we are inside a museum, there are countless features that can be recognized by a camera but a lack of connectivity, so that the use of vision approaches is preferred. Camera-based techniques, have become increasingly popular due to their cost-effectiveness and availability in commercial products (such as portable computers and mo-bile phones), that can serve as video see-through display.
2.2 Enabling Technologies 2.2.1.1 Vision-Based tracking systems
Vision-based tracking (also called marker-less) techniques make use of image
processing methods to calculate the camera pose relative to real world objects. In computer vision, most of the available tracking techniques can be divided into two classes: feature-based [53] and model-based [54]. The underlying con-cept of feature-based methods is to find a correspondence between 2D image features and their 3D world frame coordinates. The camera pose can then be found from projecting the 3D coordinates of the feature into the observed 2D image coordinates and minimizing the distance to their corresponding 2D features [55], [56]. Model-based techniques, instead, explicitly use a model of the features of tracked objects such as a CAD model or 2D template of the object based on the distinguishable features. The tracking phase is based on lines, edges or shapes present in the model. Edges are the most frequently used features as they are computationally efficient to find and robust to changes of lighting. A popular approach is to look for strong gradients in the image around a first estimation of the object pose, without explicitly extracting the contours [57]. Given the analysis of works related to the CH domain, vision-based so-lutions are the most used. For indoor environment in-fact, the use of GPS solutions is not allowed, and the ability of a device to sense the environment is limited to the built-in camera. The use of wireless connectivity is typically required for outdoor situations.
2.2.1.2 Sensor-Based tracking systems
Performing AR in outdoor scenarios, where lighting condition and the variety of landscape hamper an affordable use of marker-less solutions based on image matching, requires the use of the so called sensor-based tracking. These tech-niques deal with the registration of virtual objects in the camera scene, based on the user’s location and orientation. To determine this, the device makes use of GPS receiver to retrieve the user’s location in the real world, and of gyro-scope and compass to get the user’s orientation. Hints about this techniques are reported in [51]. In other words, the system rely on (geo)location services to determine the distance between the user and the Points of Interest (POIs) that are present on the surroundings. As discussed in [58], Public Open Spaces (POS) like parks or archaeological areas might have countless objects to be highlighted. And the closer the user is, the higher will be the error, caused by a deficiency of the receiver in terms of accuracy. This aspect will be emphasized in the Chapter4, but it is demonstrated by several works that the possibilities offered by this system are enormous, especially for tourism and business pur-poses [59]. Up to now, there are not robust and affordable solutions for indoor localization able to provide a stable definition of POIs to be showed in AR.
2.2.1.3 Hybrid tracking systems
From the above emerges that there is not an existing solution able to embrace all the needs in every conditions. In fact, depending on the needs, for some AR applications, computer vision alone cannot provide a robust tracking solution. That is the reason why during the years hybrid methods have been developed combining several sensing technologies (namely hybrid). Very interesting is the work proposed by [60]. In their work, authors propose the use of Kinect to establish 3D world and 2D image correspondences and, from them, determine camera pose. It is known that by introducing the depth contribution to track the scene, the registration of the object can be improved in terms of accuracy and occlusions can be managed. Most in general, the trend is to combine simultaneously GPS and optical tracking, which is a really good solution in those cases where the POIs are very close to each other (e.g. in a big city). With the help of the picture taken by the camera and the GPS coordinates, the device could recognize the attractions in a more simple and reliable way [61]. Despite the current weakness of the technology, the rapid development of mobile technology anticipates that hybrid technology is the future of AR.
2.2.2 AR Development tools
The current status of available development tools depict an emerging growth area. There have been a number of software frameworks created to support AR development. This section provides an overview of some of the more suitable ones to be used for the CH domain, tested and verified by the authors during their research work. The first discriminant is the choice of the Operative Sys-tem (OS). This is not trivial, since not all the available frameworks are suitable for the most widely adopted OS (Android and iOS); however, to reach the ma-jority of the users, the platform has to be taken into account in advance. Even if the number of tools is day by day increasing according to the literature review performed, the following are the most commonly used frameworks: Wikitude
1, Layar2and Vuforia3 are commercial, PanicAR4, DroidAR5 and ARToolkit6
are free. Wikitude is a commercial framework released in 2008 which exploits both location-based and vision-based tracking. For the description of the use of this framework in a museum environment see [62]. Layar is the most widely solution for location-based services. The possibility to store the POIs in a re-mote Data Base (DB) and to retrieve their information according to the user
1http://www.wikitude.com 2https://www.layar.com 3https://www.vuforia.com 4http://www.panicar.dopanic.com 5https://bitstars.github.io/droidar/ 6https://artoolkit.org