Chapter 3
Experimental Techniques
In the liquid state, a sample containing NMR active nuclei with exactly the same chemical environment gives rise to an NMR spectrum consisting in a single sharp line, which is the result of the average operated by the fast tumbling motions ex-perienced by the molecules in this physical state. These isotropic motions average out the anisotropic parts of all the nuclear interactions. When the reorientational motions of the molecules are absent or slow, the interactions are not completely averaged to their isotropic values, which lead to broad NMR lines.
High resolution spectra can be obtained on solid samples by applying dedi-cated techniques, devised in order to increase both resolution and sensitivity. The magic-angle spinning (MAS) [36] technique consists in the rapid rotation of the sample about an axis forming an angle of 54.74◦ with the direction of the static
magnetic field. The high power decoupling sequences allow the heteronucuelar and homonuclear dipolar coupling to be eliminated from the spectra. At last the Cross-Polarization (CP) [37, 38] technique is a valid tool for increasing the sensi-tivity of dilute spins. Since these techniques are very well known and widely used in SSNMR experiments, they are not discussed in this thesis but they are used in all the experimental methods presented in the following.
attention on the equipment used for low temperature measurements.
3.1
NMR spectrometers
3.1.1
Varian 400 at Universit`
a di Pisa
All the high-resolution measurements performed at the Dipartimento di Chimica e Chimica Industriale of the Universit`a di Pisa have been done using a Varian Infinity Plus 400 double-channel spectrometer with a 9.4 T magnet. The spectrometer is equipped with three multinuclear probes:
• CP-MAS 7.5 mm HX probe: the sample volume is 240 µL and the maximum spinning speed achievable is 7 kHz.
• CP-MAS 3.2 mm HX probe: the sample volume is 11-22 µL and the maxi-mum spinning speed achievable is 25 kHz.
• Goniometric HX probe for static measurements. The probe is equipped with two different coils whose diameters are 5 and 10 mm.
3.1.2
Bruker 500 at University of Warwick
A Bruker Avance III 500 triple-channel spectrometer with a 11.75 T magnet, based at the Department of Physics of the University of Warwick, was used for some of the measurements reported in chapter 6. On this spectrometer two different CP-MAS probes were used:
• CP-MAS 4 mm HX probe: the sample volume is 80 µL and the maximum spinning speed achievable is 15 kHz.
• CP-MAS 2.5 mm HXY probe (used in double-resonance mode): the sample volume is 15 µL and the maximum spinning speed achievable is 35 kHz.
3.1 NMR spectrometers 51
3.1.3
Varian 400 at University of Southampton
Some low temperature measurements presented in chapter 4 and 5, were performed on a triple-channel Varian Infinity Plus 400 spectrometer with a 9.4 T magnet, based at the School of Chemistry of the University of Southampton. With this spectrometer a custom-made double channel CP-MAS 4 mm probe was used. The probe had been previously developed in Prof. M. H. Levitt’s group in order to reach lower temperature with respect to commercial probes. The probe and the custom-modified VT stack used will be described in the next section together with the other equipments used for cooling purposes.
3.1.4
Bruker 600 at University of Southampton
The cryogenic measurements presented in chapter 4 were performed on a triple-channel Bruker Avance II 600 with a 14.1 T magnet, based at the School of Chem-istry of the University of Southampton. Two laboratory-built probes were used for static and MAS experiments: in the first case the sample is contained in a 4 mm sapphire tube, while for MAS experiments a zirconia rotor with an outer diameter of 2 mm and a set of modified caps and spacer is used. The issue of reaching very low temperatures is more than challenging and it had been faced in Prof. M. H. Levitt’s group during a six year project, which led to the construction of a unique system able to reach temperatures of 1.8 and 9.6 K for static and MAS experiments, respectively. The main features of the cryogenic equipment will be described in the next section.
3.1.5
Stelar relaxometer at Universit`
a di Pisa
For low-resolution experiments, a single channel Varian XL-100 magnet interfaced with a PC-NMR Stelar console has been used. The electro-magnet allows a variable magnetic field to be obtained with a maximum value corresponding to a proton Larmor frequency of 100 MHz. The spectrometer is equipped with a 5 mm static
tuned between 18 and 30 MHz.
3.2
Equipments for low temperature
measure-ments
The possibility of performing variable temperature experiments is essential for the study of dynamics. Some motions can be slowed down or frozen at the moderately low temperatures achievable by conventional low-temperature NMR probes (usu-ally working in the range 150-350 K), but, many interesting motions, especi(usu-ally involving light-weight molecular fragments, like CH3 groups, persist even at very
low temperature (much below 150 K).
The technical challenges in performing low temperature experiments on rotat-ing solids are several. An important point of the temperature issue is the gap between the readout temperature and the real temperature of the sample. In fact, in an ordinary NMR cooling equipment the temperature inside the NMR rotor is a function of the cooling gas flow temperature (usually slightly higher than 77 K -the liquid nitrogen temperature) and -the bearing and drive gas flows temperature (typically about 293 K-room temperature). The mixing of the three gas flows causes a local (in the very proximity of the sample) difference in temperature be-tween the one read by the digital thermometer, usually placed at the end of the VT stack and strongly affected by the temperature of the cooled nitrogen gas, and the one inside the sample which is increased by the thermal mixing of the cool nitrogen gas coming out from the VT and the warmer spinning gases (drive and bearing) used to spin the sample itself. Moreover, when the temperature we want to reach is very low, many other problems, concerning for example the materials of all the probe components, the rotor itself, and the precise control of the temperature and the MAS frequency, have to be faced.
3.2 Equipments for low temperature measurements 53
systems have been used in the thesis, both developed by an equipe of engineers and chemists at University of Southampton, under the supervision of Prof. M. H. Levitt and with the fundamental contribution of Eng. O. G. Johannessen. The first system presented in the next paragraph allows measurements at temperatures from 240 to 120 K, while the second one is a newly developed system reaching cryogenic temperatures: 1.8 K and 9.6 K for static and MAS experiments, respectively.
3.2.1
A system for measurements down to 120 K
For temperatures down to 120 K a custom made 4 mm NMR probe, previously designed and built [39], was used. This probe is coupled to a modified VT stack that allows the thermal contact of bearing and drive with the pre-cooled nitrogen gas flow used to cool the sample to the desired temperature. The VT stack and an exchange dewar are the core of the low-temperature set up in this design. The VT stack has a built-in heat exchanger that uses the cold exhaust gas to cool the bearing and the drive gases. This effectively reduces the temperature gradient in the proximity of the sample. The exchange Dewar (capacity 160 L) is used to cool down the nitrogen gas flow below 120 K by thermal exchange with the liquid nitrogen inside the Dewar itself.
The temperature calibration was performed following the 207Pb resonance of
lead nitrate Pb(NO3)2. The207Pb resonance in lead nitrate is very narrow, and its
chemical shift has a strong temperature dependence that is fairly linear over the range 340 - 130 K [40, 41]. For temperatures lower than 140 K, the calibration is based on data previously obtained with the same system [39].
3.2.2
A system for measurements at cryogenic
tempera-tures
For temperatures below 120 K, a new and custom-made cryogenic-NMR instru-ment was used [42, 43], which allows static and MAS NMR experiinstru-ments to be
adjusted independently, since bearing, turbine and sample cooling lines are well separated and mutually insulated. Cooling is done using cold helium gas produced in a custom-made helium boiler that works by evaporating liquid-helium in the supercritical regime.
Cryo-Static
Static measurements were done using a laboratory built NMR probe placed in an Oxford Instruments continuous-flow cryostat. This probe was designed to work at cryogenic temperatures, using helium gas to cool the non-rotating sample. A calibrated sensor is placed near to the pyrex sample container to ensure good thermal contact with the NMR sample and minimization of temperature gradients.
Cryo-MAS
The equipment for cryogenic magic-angle spinning NMR is the most innovative and sophisticated system used [43]. It differs from other equipment previously designed [44, 45, 46, 47, 48] since three separate helium gas streams are used: one for sample cooling and the other two for bearing and turbine. This design allows MAS experiments to be done at temperatures as low as 9.6 K, with a stability of 1 K. The spinning frequency can reach 20 kHz with a stability of ± 50 Hz. Moreover, a continuous session of measurements can last up to 12 h. Concerning the NMR performances, double resonance experiments can be carried out and the probe provides a nutation field frequency up to 100 kHz on 1H and 13C nuclei.
The spinner module require three independent streams of gas to perform sam-ple rotation; Turbine gas, Bearing gas and samsam-ple cooling gas. The flow of these three gases is controlled by a set of three superfine needel valves, placed in the the cryostat with the supercritical Helium. The gas is transferred to the spinner mod-ule using a super insulated triple transfer line,where the turbine gas and bearing gas is used as a thermal radiation shield for the sample gas to minimize the heat
3.3 Decoupling pulse sequences 55
leak of the sample gas. The cryogenic spinning system uses a zirconia rotor with an outer diameter of 2 mm. Optical fibers are used to measure the spinning speed. The sample temperature was calibrated by the developer of the system through relaxation measurements of 127I nucleus in cesium iodide [42].
3.3
Decoupling pulse sequences
3.3.1
Heteronuclear decoupling schemes
Heteronuclear dipolar decoupling pulse sequences are used in high resolution solid-state NMR experiments aimed at the observation of rare nuclei in order to remove the heteronuclear dipolar coupling between abundant and rare nuclear spins. Af-ter the continuos wave (CW) high power decoupling, many different decoupling schemes were developed for improving the decoupling efficiency. Here the two pulse sequences used in the thesis work are presented [49].
TPPM
The Two-Pulse-Phase-Modulation (TPPM) decoupling sequence [50] consists in a train of two pulses, each giving rise to a flip angle of the magnetization of about 165◦ and having a phase alternating between +φ/2 and−φ/2, where the optimum value for φ is usually between 10◦ and 50◦. This pulse sequence is very sensitive to the precise experimental setting of both the duration and phase angle of the pulses, which are usually determined empirically after any change of external parameters. In many cases TPPM decoupling schemes show less dependence on the frequency offset with respect to CW: for this reason it is frequently used in 2D experiments, which often require to irradiate far form the proton resonance frequency.
The SPINAL-64 decoupling sequence [51] performs supercycles of a TPPM pulse sequence. Also in this case, the pulses produce a 165◦-flip but the phase is slightly more complicated, being alternated between different values, typically±10◦,±15◦
and ±20◦. This decoupling scheme was first applied to liquid crystals and then to
solid systems: in many cases for both the solid and semi-solid phases it showed a considerable improvement in the efficiency of the broadband decoupling with respect to TPPM sequence and other schemes. Usually, both the pulse duration and phases are optimized empirically, together with the offset frequency.
3.3.2
Homonuclear decoupling schemes
For non abundant nuclei, the sole MAS rotation can often remove the homonuclear dipolar coupling, since the values of the couplings are generally small. The situ-ation is very different in systems of abundant high-γ nuclei, like protons, whose homonuclear coupling can reach 100 kHz. Moreover the high natural abundance favors the formation of a tightly coupled network of spins, which results even more difficult to decouple. These are the reasons of the scarce resolution commonly achievable in1H solid state NMR spectra, where the linewidth can be of the order
of 50 kHz, even under fast-MAS.
Two approaches have been developed in order to improve the proton spec-tral resolution: increasing MAS frequency and designing more effective multiple pulse techniques. The first approach achieved noticeable results considering that ultra-fast MAS probes, able to spin at frequency of 70 kHz are now commercially available and very recently the frequency of 110 kHz was achieved. On the other hand, spinning at such high frequencies leads to some big limitations, such as having a very small amount of sample in the rotor and big effects of frictional heating on the sample temperature. For these reasons the development of efficient homonuclear decoupling pulse sequences played a fundamental role in the current advances of proton solid state NMR. The methods called Combined Rotation And
3.3 Decoupling pulse sequences 57
Multiple Pulse Spectroscopy (CRAMPS) are aimed at producing an average of the coupling by rotating the direction of the local field exerted by the spins to each other about three axes [52]. There is a large variety of homonuclear decoupling sequences [53], in the following the two techniques used in the thesis work will be described.
FSLG
The Lee Goldburg (LG) decoupling was the first multiple pulse homonuclear decou-pling scheme to be developed (1975) [54]. In its basic version, the magnetization is rotated about an effective field in the rotating frame produced by an off-resonance field. By adjusting the frequency of the rf field, an effective field in the rotating frame is produced, which is oriented at the magic angle. The resulting effect is sim-ilar to that obtained in the presence of MAS, but while MAS averages the spatial part of the Hamiltonian, in this case an average of the spin part is operated.
The variant used in this work is the FSLG (Frequency- Switched Lee-Goldburg) [55]. This operates a cycle based on 2π rotations around a tilted effective field (at the magic angle tan−1(√2) with respect to the static field). The tilted field
is produced by rf irradiation at a frequency with an offset from the resonance according to one of the Lee-Goldburg conditions [54], ∆LG/ω1 =±2−1/2, where ω1
is the frequency of the rf field. The pulse sequence consists of irradiation periods of duration τ = 2π�2/3/ω1, with the rf carrier jumping between the two
Lee-Goldburg frequencies; the phase of the rf carrier is simultaneously changed by π. In a frame that rotates around the z axis at the instantaneous carrier frequency, this induces alternated 2π rotations in opposite senses around the same magic-angle axis, tilted by tan−1(√2) with respect to the z axis in the spin space, allowing the frequency jumps to take place without loss of phase coherence. This sequence, as many homonuclear decoupling schemes, induces the proton chemical shifts to be scaled by a factor which usually must be experimentally determined. For this reason at least two of the true proton chemical shifts has to be known from other experiments.
The general DUMBO (Decoupling Using Mind Boggling Optimisation) [56] homonu-clear decoupling scheme consists of a continuous phase modulated radio-frequency irradiation. The approach is based on computer modeling which was used to find some optimized decoupling conditions. The approach comprises four distinct steps: (i) a radio-frequency irradiation scheme is chosen which includes a vari-able parameter space, (ii) the model spin system for the problem is chosen, (iii) a target function for ideal behavior is defined, and (iv) the response of the spin system is optimized with respect to the target function by least squares fitting of the irradiation function variables.
Figure 3.1: Time-dependent phase modulation scheme for the eDUMBO-122 decoupling
se-quence. One cycle of the τc periodic modulation is represented, divided into 64 steps of equal
duration. Note that the modulation is centred around φ = 0◦ between 0 and τ
c/2, and centered
around φ = 180◦ between τ
c/2 and τc.
The first sequence developed with this approach is the DUMBO-1 [56, 57]. Later some other DUMBO sequences were developed following an experimental approach, called eDUMBO, which directly optimizes the spectral response of a real spin system. The two sequences used in the thesis are the DUMBO-1 and the eDUMBO-122 [58], whose phase diagram is reported in figure 3.1.
3.4 Recoupling sequences 59
3.4
Recoupling sequences
The application of either MAS or dipolar decoupling is crucial for the achievement of high spectral resolution in solid state NMR. However, the averaging of the anisotropic part of the spin interactions causes the loss of all the information contained therein. For this reason many solid state NMR experiments have been developed that allow the recoupling of specific spin interactions in rotating solid samples. The pulse sequences are designed in order to temporary suspend, by the application of a resonant rf field, the averaging effect of MAS only on certain anisotropic interactions. This purpose is achieved by combining the spin evolution under the recoupling pulse sequence and the rotation of the spatial part of the Hamiltonian; in other words the pulse sequence must be rotor-syncronized.
Here, the recoupling sequences used in the thesis work, dealing with the recou-pling of chemical shift anisotropy, scalar courecou-pling, heteronuclear and homonuclear dipolar coupling, will be presented.
3.4.1
Chemical shift anisotropy
The principal values of the chemical shift tensors can be obtained by the analysis of the static powder spectrum (section 1.4.1) only in the very rare case that the static lines of non-equivalent nuclei do not present superpositions. Applying the Magic Angle Spinning the spectral resolution noticeably increases: the anisotropic part of the interaction is averaged to zero if the spinning rate is much higher than the static linewidth, while for lower values of the spinning speed the spinning sidebands appear in the spectrum. Principal values of the chemical shift tensor can be calculated also from the analysis of spinning sidebands intensity [59, 60]. However, in the large majority of the cases the presence of a large number of signals makes the assignment of spinning sideband difficult, and hence a bidimensional experiment is needed.
separated by the isotropic chemical shift in the first dimension. The first of these techniques was introduced by Tycko et al. [61], then modified in the sequence called SUPER by Schmidt-Rohr et al. [62]. The principal problem of this kind of techniques is the scarce sensitivity, often leading to an insufficient signal-to-noise ratio. In order to overcome this problem, a different series of experiments, aimed at measuring the spinning sideband intensity, were developed. The sequence 2D-PASS (Phase-Adjusted Spinning Sideband) belongs to this family.
2D-PASS
The sequence developed by Antzutkin et al. [63, 64], shown in figure 3.2, is com-posed by a first part in which the magnetization of the observed nuclei (in the thesis work always 13C nuclei) is excited by cross polarization (CP). Then five π
pulses are applied to the transverse magnetization obtained, spaced by different time intervals (τ1-τ6), during which decoupling on proton channel is applied. After
τ6 the 13C FID is acquired under decoupling from 1H. The time between the end
of the CP contact pulse and the beginning of the acquisition must be equal to a MAS period (τr).
The sequence is repeated N times, where N is the number of rows in the second dimension (N = 16 in figure 3.2). The intervals τ1-τ6 have different values
for each row, but their sum is constant. The time intervals between the π pulses are calculated in order to modulate, in the second dimension (t1), the intensity of
the signal relative to the different order of sideband at a different frequency with respect to all the others. After the processing, a 2D spectrum is obtained where the n-th row corresponds to the order of sideband k = n for all the signals. The central row contains the isotropic spectrum (k = 0), and the spinning sidebands of each isotropic peak are in the other rows, placed in diagonal with respect to the isotropic signal. The principal values of the shielding tensor are obtained by analyzing the sidebands intensity of each signal.
3.4 Recoupling sequences 61
!
O. N. Antzutkin, S. C. Shekar, and M. H. Levitt,J. Magn. Reson. A 115,7 (1995).!
principal values of most of the13C chemical sites. These results
suggest that the 2�-methyl and 2�-methyl13C sites in
ampi-cillin anhydrate powder may have been incorrectly assigned in the literature (3). We also performed conventional CP/MAS experiments on15
N sites of these two antibiotics. We speculate on the existence of a correlation between the CSA principal values and the conformation of the five-membered thiazolidine ring.
EXPERIMENTAL SCHEME
The 2D-PASS experimental scheme has been described in Ref. (29). It allows the separation of spinning sidebands by order in the �1dimension. The separated spinning sideband
patterns may be analyzed by standard numerical procedures to obtain the chemical shift anisotropy parameters.
The 2D-PASS pulse sequence is shown in Fig. 1. Conven-tional cross polarization from the protons (I-channel) to the carbons (S-channel) (32) establishes enhanced13C transverse
magnetization. The PASS sequence of five strong � pulses at specified time delays is then applied under one rotor period. The MAS signal is observed during the time t2in the presence
of1H decoupling.
The t1incrementation of the 2D scheme is implemented by
varying the positions of the � pulses according to numerical solutions of the PASS equations (29). Since spinning sidebands are separated by order in �1, the number of t1 increments
should exceed the maximum number of sidebands in the MAS spectrum. The � pulse timings for 16 t1increments are
tabu-lated in Table 1 of Ref. (29). The 2D time domain data matrix is subjected to two complex Fourier transforms to obtain the 2D spectrum. Since the signal is completely cyclic along the t1
dimension, no special precautions are needed to obtain pure
absorption 2D spectra. In particular, hypercomplex data pro-cessing, or time-proportional phase incrementation, should not be used. When a large number of sidebands is present, a Mathematica program given in Ref. (29) calculates the re-quired time-delays enabling an arbitrary fine digitization of the
t1dimension. Note that the number of t1increments does not
depend on the desired isotropic shift resolution, in contrast to the related MAT technique (23–26).
EXPERIMENTAL
13C CP/MAS and 2D-PASS experiments were performed at
a magnetic field of 4.7 T using a Bruker MSL 200 spectrom-eter. The13
C operating frequency was 50.323 MHz. An exter-nal ENI LPI-10H amplifier was employed in the13
C channel of the spectrometer. The RF field corresponded to a13C nutation
frequency of |�nutS /2�| � 116 kHz. The decoupling power
provided a1H nutation frequency of |� nut
I /2�| � 83 kHz. A
FIG. 1. Pulse sequence for the two-dimensional PASS experiment. The horizontal axis is time in fractions of a rotational period |2�/�r|. The � pulse
timings for the PASS sequences are given in Table 1 of Ref. (29). The horizontal cross sections in the insert represent the 16 pulse sequences used in the 2D-PASS experiment.
SCHEME 1
145
CHEMICAL SHIFT ANISOTROPY OF ANTIBIOTICS
HPD 90° !H !"C 180° !! !" !# !$ !% !& 180° 180° 180° 180° t2 "t1"
Figure 3.2: 2D-PASS pulse sequence scheme. The intervals between the π pulses, relative to each row of the experiment, are represented below the pulses scheme.
3.4.2
Homonuclear dipolar coupling
“Dipolar recovery” methods, which reintroduce the dipole–dipole coupling in the presence of MAS, are particularly important. The magnitude of the through-space coupling is related to the internuclear distance, and the direction of the coupling tensor coincides with the internuclear vector. For these reasons, dipolar recovery provides a route to molecular structure information under high-resolution and high-sensitivity conditions. The double-quantum (DQ) HORROR and C7 methods are particularly efficient for homonuclear dipolar recovery in powders. In the thesis work the Permutationally Offset STabilized C7 (POST-C7) [65] was used in combination with DUMBO homonuclar decoupling. These sequences firstly proposed by Brown et al. [66] are named DQ-CRAMPS.
Figure 3.3 shows the pulse sequence for the1H DQ-CRAMPS experiment employed
in this work [66]. Two DUMBO homonuclear decoupling schemes are applied in the t1 and t2 dimensions: the windowless eDUMBO-122 [58], and the
windowed-DUMBO-1 [56, 57], respectively. The duration, together with the phases (related to that of the eDUMBO scheme) of the pulses θ1, has to be calibrated to minimize
axial peaks and quadrature images in F1 dimension. In the same way, the
orien-tation of the effective field of the DUMBO-1 sequence is adjusted to suppress zero frequency peaks in F2. In addition, the pulses θ2 have the purpose to minimize
quadrature images in the direct dimension.
Figure 3.3: Pulse sequence corresponding to the DQ-CRAMPS experiments. The eDUMBO-122 homonuclear decoupling is used during t1, while the windowed DUMBO-1 is used during t2.
The POST-C7 element is represented in the second line.
The POST-C7 scheme [65] operates the excitation and reconversion of DQ coherences. The original C7 sequence exploited a sequence of two pulses of flip angle 2π, with opposite phase, i.e. (2π)φ(2π)φ+π. The robustness of C7 with
respect to chemical shift offsets and rf inhomogeneity can be significantly improved by permutation of pulses within the basic sequence element, leading to the element (π/2)φ(2π)φ+π(3π/2)φ (Fig. 3.3). These pulses have to be calibrated so that the
duration of one element is 2τR/7, where τR is a rotor period. The intensities of
3.4 Recoupling sequences 63
3.4.3
Heteronuclear dipolar coupling
The carbon-proton correlation experiments most used in the solid state are based on a dipolar coupling driven magnetization transfer. Since the dipolar coupling acts through space, these experiments provide valuable information on the con-formational properties of the sample. Among these experiments the HETCOR sequence has been used in the thesis work.
HETCOR
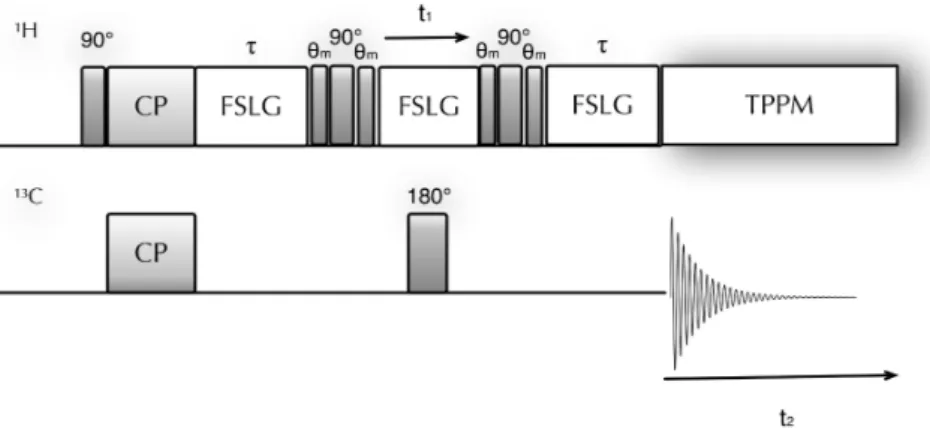
The pulse sequence for HETeronuclear CORrelation (HETCOR) [67] experiment is shown if figure 3.4. This sequence allows the chemical shift of diporarly coupled
1H and 13C nuclei to be correlated.
Figure 3.4: Pulse sequence corresponding to the 2D heteronuclear correlation experiment HETCOR.
First a 90◦pulse is applied on the1H channel to generate transverse
magnetiza-tion, then, during t1 evolution, the FSLG pulse sequence (section 3.3.2) is applied
on the 1H channel in order to eliminate the homonuclear dipolar couplings among
protons, allowing 1H magnetization to evolve under the unique effect of chemical
shift interaction. The evolution time t1 is increased in the second dimension from
mag-CP time should be kept as shortest as possible in order to limit the redistribution of 1H magnetization due to spin diffusion. The 13C FID is finally acquired during
t2 under TPPM hetoronuclear decoupling. The 2D map is obtained after a double
Fourier transform with respect to both t1 and t2. On the first and second
dimen-sion of the map the isotropic 1H and 13C spectra are present. Correlation peaks
appear in correspondence of the isotropic chemical shifts of the coupled 1H−13C.
3.4.4
Scalar coupling
The information obtainable by the scalar couplings are complementary with re-spect to those from dipolar couplings. Indeed the through-bond scalar couplings are extremely valuable probes of direct proximities in the chemical structure, and their use is an essential component in the assignment of the spectra of powdered solids. Moreover, the experiments exploiting scalar couplings are generally much more selective in obtaining correlations than those based on dipolar couplings.
MAS-J-HMQC
MAS-J-HMQC [68] is a two-dimensional proton-carbon correlation experiment which relies on a polarization transfer using heteronuclear JCH. In analogy to
liquid-state HMQC experiments, the sequence uses heteronuclear multiple quan-tum coherences to provide correlation between pairs of directly bonded nuclei.
After cross-polarization from 1H, the magnetization of carbons evolves during
the delay τ under only an isotropic scaled heteronuclear JCH coupling
Hamilto-nian. During this period the proton-proton dipolar couplings are removed by using FSLG [55] whereas the remaining inhomogeneous interactions are averaged by rapid magic angle spinning to their isotropic components, leaving only the isotropic chemical shift and the heteronuclear scalar coupling. For a pair of co-valently bonded 1H−13C spins, the carbon magnetization evolves from in-phase
3.4 Recoupling sequences 65
Figure 3.5: Pulse sequence scheme corresponding to the MAS-J-HMQC correlation experiment.
pulse applied on protons transforms the antiphase carbon coherence into a double-quantum heteronuclear coherence which evolves during t1 only under the effect of
the proton chemical shift. Carbon chemical shift evolution during t1 (and during
the periods τ ) is refocused by the 180◦ pulse applied in the middle of the pulse sequence. Heteronuclear multiple-quantum (MQ) coherences are insensitive to heteronuclear couplings between the two spins involved in the coherence; proton-proton dipolar couplings are removed during t1 by the FSLG decoupling and the
residual heteronuclear dipolar couplings to other spins by MAS and the 180◦ pulse.
At the end of the t1 evolution period, the MQ coherence is converted back into an
antiphase carbon coherence by the second 90◦ proton pulse. During the second τ period this coherence evolves to become an in-phase observable carbon coherence.
Under FSLG decoupling, the effective field is oriented at the magic angle with respect to the B0 field. The first 54.7◦ “magic angle pulse” applied on protons at
the end of the first τ period compensates for the tilted precession around this axis by rotating the proton longitudinal magnetization into the z axis of the rotating frame. In the same way, the second and third magic angle pulses applied on both sides of the t1 evolution period bring the proton transverse magnetization
perpendicular to the effective field and back to the (x,y) plane, respectively. The fourth magic angle pulse rotates the proton longitudinal magnetization from the
second τ delay. The magic angle pulses associated with the τ periods increase the sensitivity of the experiment, while those associated with t1 also have the function
to minimize axial peaks and quadrature images.
During the acquisition period, TPPM [50] heteronuclear decoupling is applied. A two-dimensional Fourier transform provides pure in-phase chemical shift corre-lations between pairs of bonded protons and carbons in the two dimensions. Due to the FSLG sequence, the heteronuclear couplings as well as the proton chemi-cal shift in the first dimension are schemi-caled by a factor which has to be determined experimentally.
Refocussed INEPT
The use of efficient proton-proton decoupling techniques, as the DUMBO se-quences, allowed in the last few years the direct implementation of a solid-state version of refocused INEPT experiments for solids [69]. It has been shown [69] that this sequence provides considerable improvement (up to a factor 3) with respect to other through-bond heteronuclear correlation methods at high MAS frequencies.
Figure 3.6: Pulse sequence scheme corresponding to the refocussed INEPT experiment.
The pulse sequence is shown in Figure 3.6. The original liquid-state technique [70] was adapted for rotating solids by adding proton homonuclear decoupling
3.5 Pulse sequences for relaxation time measurements 67
during τ and τ� transfer periods, to remove proton-proton dipolar couplings. If the homonuclear decoupling is sufficiently efficient during those delays, fast magic-angle spinning then averages chemical shift anisotropy and heteronuclear dipolar couplings to zero, so that only the scalar couplings are preserved together with isotropic chemical shifts. The simultaneous 180◦ pulses on proton and carbon
induce refocusing of isotropic chemical shifts after 2 τ and 2 τ�, such that during these delays only JCH couplings affect coherence transfer and evolution. For a
pair of bonded (1H,13C) nuclei, after the first τ − π − τ period, antiphase proton
coherence with respect to the attached carbon is created, which is converted by the two simultaneous 90◦ pulses into antiphase carbon coherence. This antiphase 13C coherence is then refocused during the second τ�−π −τ� period into observable
carbon-13 magnetization. In this version of the sequence, decoupling of proton-proton dipolar interactions was achieved using the eDUMBO continuous phase modulation scheme. The SPINAL-64 heteronuclear decoupling scheme is used during the acquisition.
3.5
Pulse sequences for relaxation time
measure-ments
3.5.1
13C spin-lattice relaxation measurements
In order to measure 13C relaxation times high resolution techniques are needed.
Indeed, contrary to abundant nuclei, for rare nuclei the spin diffusion effects are negligible and therefore it is possible to measure the intrinsic spin-lattice relaxation times.
Torchia sequence
The sequence proposed by Torchia [71] is composed by the CP excitation of 13C
1
the remaining magnetization in the x-y plane, and the signal is acquired under High Power Decoupling (HPD) conditions.
HPD
90°
!H
!"C 90° 90°
!
Figure 3.7: Torchia pulse sequence for T1(13C) relaxation time measurements.
This sequence is particularly useful for the measurements of T1(13C) in rigid
solids, where they are generally long. Indeed, with a direct excitation technique the recycle delay should be equal to 5 times the T1(13C) value, while with this
technique a relaxation delay equal to 5 T1(1H) is sufficient, implying a noticeable
saving of time.
The magnetization intensity (I) decays with increasing τ and the T1 value for
each signal is determined by fitting the trend with the following equation:
I = M (0) e−T1τ (3.1)
where M (0) is the magnetization value after the CP pulse.
3.5.2
1H spin-lattice relaxation measurements
1H T
1 and T1ρ values can be measured with different experiments. It is worth
to distinguish between direct and indirect measurements: in the first the proton signal is observed, while in the second the CP is applied to transfer the proton magnetization to carbon nuclei, and proton relaxation parameters are observed
3.5 Pulse sequences for relaxation time measurements 69
through observation of 13C nuclei coupled with the protons. During the thesis
work only direct sequences have been used for measuring proton relaxation times.
Inversion recovery
The Inversion Recovery sequence [72] (figura 3.8) is one of the most used experi-ments for 1H T
1 determination.
180°
!
90°
Figure 3.8: Inversion Recovery pulse sequence for the direct measurements of T1(1H).
A 180◦ pulse inverts the populations of the spin system, which evolves in the
variable time τ under T1relaxation that tends to restore the equilibrium conditions.
By acquiring the FID at variable τ values, the recovery curve of the magnetization is obtained.
Saturation recovey
The Saturation Recovery sequence (figure 3.9) consists of a train of 90◦ pulses on
the proton channel, which saturates the energy levels of the spin system. Indeed the saturation is achieved with the repetitive application of 90◦ pulses if T
1 � T2,
which is generally true for rigid solids, and the intervals between the 90◦ pulses
must be longer than T2 but much shorter than T1.
During the time τ , the spin system evolves according to the longitudinal relax-ation mechanism and the value of T1 is determined by sampling the magnetization
!
Figure 3.9: Saturation Recovery pulse sequence, for the direct measurements of T1(1H).
it is not necessary that the magnetization reaches the equilibrium condition after each scan. This characteristic involves a drastic shortening of the measuring time.
Both saturation and inversion recovery experiments provide a recovery curve of the magnetization (I) as a function of τ . The value of T1 is determined by fitting
the trend to the following equation:
I = M0
�
1− a e−T1τ
�
(3.2)
where M0 is the equilibrium value of the longitudinal magnetization and a is a
parameter that takes into account possible pulse imperfections. The ideal value of a is 2 and 1 for inversion and saturation recovery, respectively.
Variable spin lock time for T1ρ measurement
Spin-lattice relaxation times in the rotating frame, T1ρ, can be measured by
ap-plying a Spin Lock pulse of variable duration to the transverse magnetization. The intensity of the magnetization as a function of the spin lock time can be de-scribed with an exponential decaying function, whose time constant is T1ρ. Since
in the majority of the cases the decay is not mono-exponential a multicomponent equation is needed for the fitting. As an example, for bi-exponential decay a two components function is needed:
3.5 Pulse sequences for relaxation time measurements 71 I = M (0) � wa e − τ T a1ρ + (1− wa)e − τ T b1ρ � (3.3)
where M0 is the value of I at τ = 0, T1ρa and T1ρb are the two components and wa
is the weight of the first component.
The sequence is represented in figure 3.10:
90°x
! spin lock
Figure 3.10: Single pulse excitation followed by a variable Spin Lock pulse, for T1ρ(1H)
mea-surement.
Solid echo
In rigid solid samples the FID decays very rapidly. Since NMR spectrometers use the same coil as transmitter and receiver, it is alway necessary to wait at least a few microseconds before starting the acquisition. This waiting time is called dead time. When T2 is very short the signal can completely or partially decay during
the dead time: in this case echo pulse sequences are needed.
In particular, for solid samples the solid echo sequence is used (Figure 3.11) [73]: the excitation 90◦ pulse is followed, after a time τ , by a second 90◦ pulse with
a phase shift of π/2 with respect to the first pulse, thus producing a refocusing of the FID, which reaches the initial intensity again at a time equal to τ after the second 90◦ pulse. By choosing τ larger than the dead time it is possible to acquire
the entire FID without cutting the first points.
The echo sequences can be included in other experiments, simply applying the echo pulses before the acquisition. This is particularly useful for proton detection in rigid solids and for the observation of quadrupolar nuclei. Indeed all the sequences
! !
Figure 3.11: Solid Echo pulse sequence.
involving direct 1H or 2H observation were actually applied in combination with
solid echo.
3.5.3
1H FID analysis
For proton solid-state NMR, an alternative approach to the conventional NMR spectrum in the frequency domain is represented by the analysis of the time-domain proton FID. In fact, using a magnetic field relatively low, corresponding to Larmor frequency of proton lower than 100 MHz, it is usually possible to ob-tain the on-resonance condition for all the protons of a rigid solid sample. The oscillations of the FID, which would arise from the differences in the resonance fre-quencies of protons with different chemical shifts, are here negligible with respect to the linewidth, mainly generated by the strong homonuclear dipolar couplings. In these conditions, the proton FID is determined only by the homonuclear dipolar interactions, which also determines the transverse relaxation time T2 or, typically
in real samples, a distribution of T2 values.
In solid samples proton T2values can be extremely short (few µs), and therefore
the detection of proton FIDs requires the employment of echo sequences, and in particular the solid echo is generally used (paragraph 3.5.2).
If the on resonance condition is verified, it is possible to quantitatively analyze the FID as a linear combination of analytical functions, each of them representing a protons fraction characterized by a T2 value. T2 values can provide useful
3.5 Pulse sequences for relaxation time measurements 73
values are characteristic of rigid fragments or domains, while long values of T2
characterize mobile fragments or domains. Due to this close relationship between proton T2 and molecular mobility of the proton environments, by choosing the
kind of functions suitable for the fitting, this analysis allows motionally distinct domains of the sample to be identified and characterized.
Many different functions can be potentially employed in FID analysis [74]. The ones used in the thesis work are reported below.
• Exponential E(t) = e−T2t (3.4) • Gaussian G(t) = e− “ t T2 ”2 (3.5) • Pake [75] P (t) = � π 6 e −β2t22 � cos αt √ αt C � 6αt π + S � 6αt π sin αt √ αt � (3.6) where α = 3γN2� 4r3 , β = √ 2
T2, and C and S are the Fresnell functions, that can
be approximated to [76]: C(x) � 1 2 + 1 + 0.926x 2 + 1.792x + 3.104x2 sin � π2 2 x 2 � − 1 2 + 4.142x + 3.492x2+ 6.670x3 cos � π2 2 x 2 � (3.7) S(x) � 1 2 − 1 + 0.926x 2 + 1.792x + 3.104x2 cos � π2 2 x 2 � − 1 2 + 4.142x + 3.492x2+ 6.670x3 sin � π2 2 x 2 � (3.8)
The Pake function is derived as the inverse Fourier transform of the origi-nal expression of the dipolar Pake pattern in the frequency domain and it is
sents the distance between the protons of a water molecule in CaSO4 · 2H2O,
which provide an example of isolated spin pair [77]. For samples containing more than two coupled spins r is a parameter to be obtained by the fitting procedure. The other parameter β indicates the width of the Gaussian line due to the dipolar interaction between non-nearest neighbour protons.
Other functions widely used are the Abragamian [7], Brereton [78] and Weibullian [79]. The choice of the function to use is often dependent on the mobility of the domain to be described. In fact, fast decaying components, related to rigid domains, are frequently described by Pake, Abragamian and Gaussian functions. On the other side, slowly decaying components, related to mobile proton fractions, are often fitted through exponential functions.
Chapter 4
Large-amplitude
Interconformational Motions over
an Unconventional Range of
Temperatures: the case of
Sodium Ibuprofen
4.1
Introduction
The study of molecular motions of small organic molecules has a particular inter-est, not only for the intrinsic value of such a deep knowledge of a chemical system, but also because molecular motions can be intimately connected with physical properties, such as stability, intermolecular interactions and chemical reactivity. Such properties are relevant for many solid systems but in particular in the phar-maceutical field.
In the last few years, our group developed an NMR approach to obtain a very detailed characterization of the dynamics of small organic molecules by combining
and simultaneously analyzing a variety of SSNMR experimental data, including various types of relaxation times (T1 and T1ρ) of different nuclei (13C and 1H),
measured at different temperatures and frequencies, and spectral properties, such as lineshapes and linewidths. This approach, first applied to Ibuprofen [80, 26], was then extended to the di-hydrated solid form of Sodium Ibuprofen (IBUS), which showed an interesting dynamic behaviour [81]. In particular some of its molecular fragments are characterized by motions on the ns timescale at room temperature. This is the reason why IBUS has been chosen as a model compound for the study of dynamics at cryogenic temperatures.
Solid-State NMR at cryogenic temperatures can offer new tools to study the temperature dependence of molecular motions, and can give a crucial contribution to the quantitative determination of motional parameters such as activation en-ergies and correlation times. Some motions can be slowed down or frozen at the moderately low temperatures achievable by conventional low-temperature NMR probes (usually working in the range 150 - 350 K), but, many interesting motions, especially involving small molecular fragments, like CH3 groups, persist even at
very low temperature (much below 150 K), and this is the case of IBUS.
At present, the acquisition of solid-state NMR experiments at such low tem-perature is a real challenge and this work could not have been possible without the cryo-NMR equipment developed by Prof. M. H. Levitt group and based at University of Southampton. As described in section 3.2.2, this new equipment has particular engineering features that allow unparalleled performances.
In this chapter the study of the dynamic properties of the di-hydrated solid form of Sodium Ibuprofen and especially the contribution of cryogenic NMR mea-surements is presented and discussed. After a description of the methods used, and a short summary of the previous results, the measurements at cryogenic tem-peratures are described. In particular 13C CP-MAS spectra in the temperature
range 20 - 358 K, 13C chemical shif tensors from 142 to 353 K and 1H and 13C
relaxation time measurements in the temperature range 40 - 270 K, will be shown and the interpretation of the main results will be described.
4.2 The system 77
Moreover, a quantitative analysis for the determination of the motional pa-rameters of the aromatic ring π flip, and the methyl and isobutyl rotations will be presented. For the characterization of the aromatic ring π flip, lineshape analysis of the aromatic carbons signal in the variable temperature 13C CP-MAS
spec-tra was carried out, by suitable simulation procedure. On the other side, for the methyl and isobutyl rotations, the analysis was conducted by means of a global fitting procedure, consisting in the simultaneous fitting of all the different relax-ation data curves vs. temperature. In particular, relaxrelax-ation data curves of 13C
and 1H nuclei, measured at different instrumental frequencies, were fitted
simul-taneously in order to determine motional parameters such as activation energies and correlation times. This method, previously developed in our group [82] and used for the analysis of high temperature data [26] was proven to be more robust and reliable than the separate fittings of single curves, which may bring to biased results.
Finally, a study aimed at the dynamic characterization of the anhydrous form of Sodium Ibuprofen is presented. This work has been done in collaboration with the group of Prof. P. Paoli at Universit`a degli Studi di Firenze. They performed some Thermogravimetric Analysis (TGA) and X-Ray Powder Diffraction (XRPD) experiments. A set of room temperature solid-state NMR experiments was also performed, including 1H MAS and 13C CP-MAS spectra, 1H FID analysis and 1H−13C correlations experiments. In the last section the results of the NMR
ex-periments are described and a comparison between the anhydrous and di-hydrated forms is carried out. This part of the work opens an interesting perspective about a variable temperature study of the dynamic properties of the anhydrous form.
4.2
The system
The di-hydrate crystalline form of Sodium Ibuprofen (IBUS) has been investigated as a model compound, since its different fragments are characterized by motions on the ns timescale at room temperature. The molecular structure of IBUS and
its 13C CP-MAS spectrum at room temperature are shown in figure 4.1, together
with spectral assignment [80].
Figure 4.1: Room temperature13C CP-MAS spectrum of IBUS acquired at Larmor frequency
of 100.56 MHz and spinning frequency of 5 kHz. Spinning sidebands are marked with asterisks.
Some important information about the dynamic behavior of IBUS can be ob-tained from the room temperature CP-MAS spectrum: indeed, as already dis-cussed in refs [80, 81] the presence of a single signal for the two methyl carbons of the isobutyl group (m, n) and of only two partially superimposed signals for the tertiary aromatic carbons (d-g) clearly indicates that at room temperature the interconformational motions of both of these groups, that is, the rotation of the isobutyl group and the motions of the aromatic ring, are fast with respect to the reference frequencies of the exchange processes (hundreds of hertz).
4.3
Experimental details
The NMR experiments were carried out on four different NMR spectrometers described in section 3.1 and named Varian 400 at Universit`a di Pisa, Stelar Relax-ometer, Varian 400 at University of Southampton and Bruker 600 at University of Southampton.
appa-4.3 Experimental details 79
ratuses.
Experiments between 353 and 224 K were recorded on the Varian 400 at Universit`a di Pisa spectrometer, and a cooling system consisting of an ex-change Dewar filled with a mixture of ethanol and liquid nitrogen. The 7.5 mm MAS probe was used, and1H and 13C 90◦ pulse durations were 4.0 and
4.5 µs, respectively.
Experiments between 239 and 139 K were recorded on the Varian 400 at University of Southampton spectrometer and the cooling equipment de-scribed in section 3.2.1. The 4 mm modified probe was used and and 1H
and 13C 90◦ pulse durations were 3.0 and 4.5 µs, respectively.
Experiments below 120 K were recorded with the cryoNMR equipment at Uni-versity of Southampton (section 3.2.2). For static experiments, the Cryo-Static probe was used with 1H 90◦ pulse durations of 5.5 µs. For spinning
experiments the CryoMAS probe was used. 1H 90◦ pulse durations was 5.0
µs and the MAS frequency was 9 kHz.
All cross-polarization (CP) spectra were acquired using a contact time of 1 ms, which was found to give the maximum signal intensity. 13C chemical shifts were
referred to hexamethylbenzene and TMS as secondary and primary references, respectively.
1H spin-lattice relaxation times in the laboratory frame (T
1) were measured
un-der low resolution conditions by direct proton observation using either saturation-recovery or inversion-saturation-recovery pulse sequences. 1H spin-lattice relaxation times in
the rotating frame (T1ρ) were measured under low resolution conditions by direct
proton observation using a variable spin-lock field pulse sequence. 13C spin-lattice
relaxation times in the laboratory frame (T1) were measured at high resolution
using Torchia pulse sequence with high-power proton decoupling (HPD) during
13C signal acquisition.
peaks through a nonlinear least-squares minimization procedure, thus allowing the integrals of each peak to be determined without the biasing effect due to peak superposition, and then the trends of the integrals vs. the variable time of the pulse sequence were fitted by means of suitable analytical functions to obtain the relaxation times.
13C chemical shift tensors were measured using the 2D- PASS experiment at
a spinning frequency of 1.6 kHz for aromatic carbons. A cogwheel phase cycling [83, 84] was used. The analysis of spinning sidebands [59, 60] was performed using the HBA software [85].
The room temperature experiments presented in the last section of the chapter were performed on Varian 400 at Universit`a di Pisa (3.2 mm probe, 1H and 13C
90◦ pulse of 1.9 and 2.1 µs, respectively) and Stelar Relaxometer at Universit`a di Pisa (1H 90◦ pulse of 3.7 µs).
4.4
High temperature measurements
In the past few years, our group has been working on methods to obtain detailed characterization of the dynamics of small organic molecules by combining and si-multaneously analyzing a variety of SSNMR experimental data, including various types of relaxation times (T1 and T1ρ) of different nuclei (13C and 1H), measured
at different temperatures and frequencies, and spectral properties, such as line-shapes and linewidths. This approach was applied to the di-hydrated crystalline form of Na-salt of Ibuprofen to investigate in detail its dynamic behavior in the temperature range between 220 and 360 K. The results of this work [81] will be summarized in the next paragraph.
First we analyzed the variable temperature 13C spectra of IBUS in the range
of temperatures between 220 and 360 K. The spectra do not show any significant change in the lineshape of the m - n signal, indicating that the frequency of the interconformational motion of the isobutyl group is higher than 200-300 Hz over the
4.4 High temperature measurements 81
temperature range invstigated. On the contrary, the signals of aromatic carbons d-g present a significant linebroadening within the temperature range 220 - 360 K (Figure 4.2), which is maximum for the spectrum recorded at 260 K. However, the evolution of the lineshape with temperature suggests that this linebroadening should be ascribed to an interference of the motion with the decoupling field, rather than to an exchange phenomenon, thus indicating the occurrence of a motion of the aromatic ring with a characteristic frequency of the order of kHz or tens of kHz (intermediate regime), rather than of hundreds of Hz.
Figure 4.2: Aromatic region of the 13C CP-MAS spectra of IBUS acquired at different
temperatures (reported on the right). Spectra below room temperature were recorded with νM AS = 5 kHz, whereas those above room temperature were recorded with νM AS = 6 kHz. The
peaks at 135 and 125 ppm are spinning sidebands of the carboxylic carbon signal in the two cases, respectively.
Spin-lattice relaxation times in the rotating frame (T1ρ) of1H nuclei were
mea-sured at three different spin-lock field frequencies. In all cases the relaxation decay was found to be biexponential, indicating that the spin-diffusion average was not complete. In order to obtain dynamic information, PWRA values were calculated. At all the three spin-lock field frequencies clear trends of 1/PWRA with tem-perature were obtained with minima at 273 - 293 K (Figure 4.3), indicating the occurrence of a motion with characteristic frequency in the intermediate regime,
which could be identified with the motion of the aromatic ring.
In order to further investigate the intermediate motional regime a T1dispersion
curve at room temperature was also measured with the Fast Field Cycling tech-nique [86]. The curve shows the dependence of T1 values on the Larmor frequency
in a range between 0.05 and 30 MHz. This measure was performed by Dr. S. Bubici (Stelar s.r.l) at Stelar s.r.l. main laboratory (Pavia - Italy).
1H T
1ρ vs. temperature curves measured at three different spin-lock
frequen-cies and the T1 dispersion curve were analyzed for characterizing the phenyl ring
motion. 1H T
1ρ data were fitted by eqs. 2.25, 2.23, and using the Arrhenius law
for the temperature dependence of correlation times:
τC = τ∞e Ea
kT (4.1)
where Ea is the activation energy of the motion.
The 1H T
1 dispersion curve was fitted by eq. 2.22. The Cole-Cole model for
spectral densities (eq. 2.6) was found to be the most suitable for the experimental data. A good correspondence was obtained between calculated and experimental curves, as shown in Figure 4.3, and the best-fitting parameters are reported in Table 4.1.
From the dynamic parameters obtained by the fitting it is possible to predict the temperature at which the maximum interference (i.e. the maximum 13C
line-broadening) should occur, using the Arrhenius parameters found from the 1H T 1ρ
and T1 fitting and the value of the decoupling field used for recording13C spectra:
this temperature was found to be 264 K, in very good agreement with the observed maximum linebroadening between 273 and 260 K (Figure 4.2).
13C T
1 measurements were performed in the temperature range 220 - 360 K.
Values of T1 close to the minimum values predictable on the basis of eq. 2.29 were
found for methyl carbons m/n (0.13 - 0.80 s) and o (0.10- 0.29 s), and for isobutyl carbons h (0.3 - 0.9 s) and l (0.6 - 1.6 s), indicating that these carbons are involved in motions with characteristic frequencies of the order of the13C Larmor frequency
4.4 High temperature measurements 83
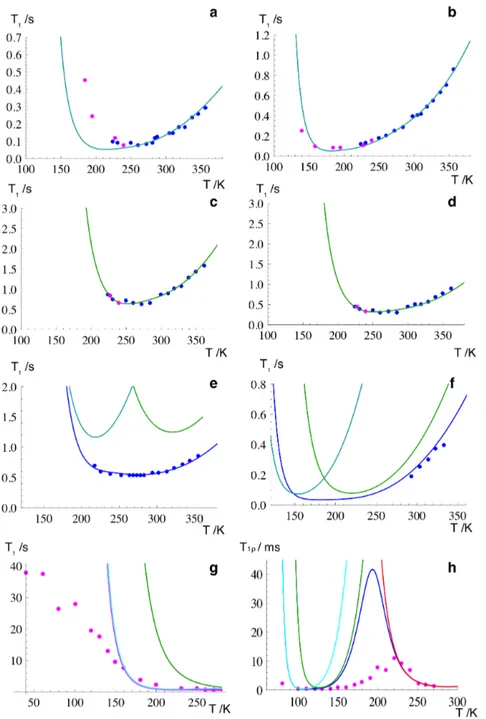
Figure 4.3: 1H T
1 dispersion curve (a) and 1H T1ρ PWRA−1 of IBUS versus temperature
curves at spin-lock field frequencies of (b) 90, (c) 50, and (d) 35 kHz. Symbols and lines indicate experimental and best-fit calculated relaxation times, respectively.
(100 MHz). For methyl groups the rotation about their ternary symmetry axis is expected to be fast. Indeed both m/n and o T1’s show increasing trends with
increasing temperature (Figure 4.4), indicating that the rotations of methyl groups are in the fast motion side of T1 curve. As far as h and l carbons are concerned,
their T1 values present a minimum between 273 and 283 K (Figure 4.4). The ratio
between h and l T1’s is about two at all temperatures, indicating that, on the basis
of eq. 2.29, the corresponding carbons undergo the same dynamic process, which can be identified as the rotation of the isobutyl group, also in agreement with the previous observation of a single peak for m and n methyl carbons. All the other carbons exhibit much larger T1’s, indicating that the motions in which they are
involved have characteristic frequencies very far from 13C Larmor frequency.
Spin-lattice relaxation times in the laboratory frame (T1) for 1H nuclei were
measured at two different Larmor frequencies, 25 and 400 MHz. In both cases a single T1 value was measured for all 1H nuclei, as a consequence of the complete
average operated by spin-diffusion. T1 values at both frequencies are quite small
and show clear trends with temperature (Figure 4.4). On the basis of 13C T 1
data we can hypothesize that 1H T
1 trends are mainly determined by methyls and
isobutyl rotations.
A quantitative analysis of the motions in the fast regime was performed by fitting the proton and carbon T1 vs. temperature curves. The motions previously
recognized to influence T1 values were the rotations of the three methyl groups
about their ternary symmetry axes and the reorientation of the isobutyl fragment. A global fitting procedure was applied to the 13C T
1 curves of h, l, m/n, and o
carbons, and the 1H T
1 curves obtained at two different Larmor frequencies, using
eqs. 2.29, 2.22, 2.30, and 4.1. The BPP model for spectral densities (eq. 2.30) was found to be suitable to describe the relaxation times in this range of temperature. We tried to reproduce the experimental curves considering: isobutyl motion only, o methyl motion only, m/n methyl and isobutyl motions for describing the curves of h/l, o and m/n carbons, respectively. The motions of isobutyl and methyl groups were assumed independent and, consequently, their contributions
4.4 High temperature measurements 85
Figure 4.4: 13C spin-lattice relaxation times in the laboratory frame versus temperature curves
at a13C Larmor frequency of 100.56 MHz for IBUS: (a) carbon o, (b) carbon l, (c) carbon h, and
(d) carbons m/n (signal at 23 ppm). 1H spin-lattice relaxation times in the laboratory frame
versus temperature curves at Larmor frequencies of (e) 399.89 and (f) 25.00 MHz. Symbols and lines indicate experimental and best-fit calculated relaxation times, respectively. Cyan and green lines in figures e and f and in the inset of figure d indicate the contribution of methyl rotations and that of isobutyl reorientations, respectively.
Table 4.1: Motional parameters obtained from the fit of experimental data in the temperature range 220 - 360 K, and corresponding errors.
Motion Ea (kJ/mol) Log(τ∞(s)) δCole−Cole
Methyl m/ n rotation 12.1 ± 0.9 -12.5 ± 0.1 1
Methyl o rotation 12.0 ± 1.0 -12.0 ± 0.2 1
Isobutyl reorientation 16.1 ± 0.4 -12.2 ± 0.1 1 Aromatic ring π-flip 32.8 ± 1.5 -11.9 ± 0.2 0.82
to the relaxation rate of carbons m/n were considered additive. However, the agreement between calculated and experimental curves was found to be good only when the multiplicative constant CC for the sole isobutyl motion was taken as a
fitting parameter, rather than calculated from eq. 2.28. The best-fitting value found for CC was about 25 % of the theoretical value. A similar behavior has
been explained with the contribution to 13C T
1 relaxation of C-H bond librations
[87, 88, 82]. Indeed, if librations are considered independent from and much faster than the main motion (the isobutyl rotation, in our case), their contribution to the relaxation results in a simple reduction of the theoretical constant Ctheor
C :
CCexp = χ CCtheor (4.2)
with the scaling factor χ < 1. In the case of isobutyl rotation, a scaling factor of 0.25 indicates a significant contribution of librations to relaxation. The motional parameters obtained from the fitting are reported in Table 4.1.
4.5
Low temperature measurements
The main part of the work here presented consisted in the acquisition and analysis of low temperature NMR experiments. In particular 13C CP-MAS spectra in the
temperature range 20 - 358 K, 13C chemical shift tensors from 142 to 353 K and 1H and 13C relaxation time measurements in the temperature range 270 -40 K, are
4.5 Low temperature measurements 87
shown and discussed in the next paragraphs.
4.5.1
13C CP-MAS spectra from 353 to 20 K
13C-CP-MAS spectra were acquired in a cryogenic regime (down to 20 K) to follow
the changes in the characteristic frequency of the methyl and isobutyl rotations, and of the aromatic ring motion (which was identified to be a π-flip from 13C
chemical shift tensor measurements, as it will be shown in section 4.5.2).
All the spectra acquired with the three different instruments are shown in Figure 4.5. The acquisition performed with different probes and different number of transients (Table 4.2) causes the differences in signal to noise. It is worth noticing that the spectra below 120 K were acquired with a 2 mm probe and the amount of sample is more than 100 times less than that present in a 4 mm rotor, thus explaining the drastic reduction of signal to noise passing from the spectrum at 139 to that at 120 K. Nevertheless, the signal to noise noticeably increases going down in temperature despite the decreasing of the number of transients accumulated. Indeed going down in temperature two main effects occur: first the increases in the difference of population between spin states increase the signal, and second the reduction of the electric noise at low temperatures further increases the signal-to-noise ratio. This is one of the advantages of NMR experiments at cryogenic temperatures.
The whole series of spectra contains information about the motions of every molecular fragments: the isopropionic group, the aromatic ring, the isobutyl and the three methyl groups. The most rigid part of the molecule is the isopropionic group, which is frozen in a single conformation in the whole range of temperatures. This is proven by fact that both the intensity and linewidth of the signals of the aliphatic carbon i (49 ppm) and the carboxylic carbon a (184 ppm) remain unchanged down to 20 K. These data confirm previous findings obtained by the measurement of relaxation times [81].
Figure 4.5: 13C CP-MAS spectra in the temperature range 20 - 358 K. The spectra were
4.5 Low temperature measurements 89
Table 4.2: Experimental details of the13C CP-MAS spectra shown in figure 4.5.
Temp /K
Scan # MAS Freq. / kHz Probe Sample amount /mg 13C Larmor Freq. /MHz 358-298 80 6.5 7.5 mm 240 100 283-224 80 5.0 7.5 mm 240 100 239-139 80 5.0 4 mm 150 100 modified 120-100 32 9.0 2 mm 1.5 150 costum-built 80-40 16 9.0 2 mm 1.5 150 costum-built 20 8 9.0 2 mm 1.5 150 costum-built Aromatic region
As far as the aromatic ring is concerned (signals in the spectral region from 120 to 150 ppm), interesting information about the motion around its para axis can be obtained from the signals of the ternary aromatic carbons d-g. At high tem-peratures the four carbons give rise to two peaks, indicating that the exchange between the corresponding positions (e with d, and f with g) is fast with respect to the chemical shift timescale.
Going down with temperature, the two peaks experience a progressive line-broadening: the two peaks become substantially indistinguishable at about 298 K, and the maximum linewidth is obtained between 274 and 260 K. Below this temperature the lines progressively narrow, and at about 195 K, it is possible to notice that the shape of the spectrum is changed with respect to high tempera-tures: instead of two signals, with the same intensity, at 128.4 and 130.0 ppm, a peak at 125.8 ppm and a much more intense one at about 129.7 ppm are
ob-served(which as it will be explained in section 4.6.1, can be assigned to carbon e and d, f, g, respectively). Through spectral deconvolution we could show that the latter should arise from three heavily superimposed signals centered at 130.6, 129.8 and 128.9 ppm. Therefore, the presence of four peaks for the four carbons d-g clearly indicates that below 195 K the frequency of the ring motion is lower than 100 - 200 Hz.
The linebroadening affecting these signals above 195 K can be interpreted, by decreasing temperature, as arising from: a) interference of the motional frequency with the decoupling field and, b), the MAS frequency; c) coalescence due to ex-change of d-e and f -g carbons. Below 195 K the aromatic ring seems to be frozen in a single conformation. The broadening observed at temperatures lower than 139 K is partially due to the superimposition with a spinning sideband of the carboxylic carbon signal.
Aliphatic region
The fastest reorientational motions in the molecule are the methyl rotations about their ternary axes, and the reorientation of the isobutyl group, consisting in the rotations about the single bonds between carbons c-h, and h-l, previously shown to occur at about the same frequency [81].
The cryogenic measurements are of particular relevance for the characterization of these fast motions. On cooling, the first large effect on the spectra is a dramatic decrease of the intensity of all the aliphatic signals (with the only exception of that of carbon l) in the region between 17 and 46 ppm, occurring below 185 K. The signal at 17 ppm, ascribed to methyl carbon o, almost disappears because of line broadening at 139 K. Below 60 K the signal narrows again, but even at 20K its intensity has not entirely recovered and its linewidth is larger with respect to the spectra recorded above 190 K. Since this carbon is only involved in the rotation around its ternary symmetry axis, the observed linebroadening must be due to the interference of the frequency of this motion with the decoupling field and the