4-1
4 APPLICATION TO REAL DATASETS
We applied some of the meta-analysis methods described in the previous chapter to a set of three microarray experiments from four malignant pleural mesothelioma (MPM) studies. We focused on differential expression analysis between normal and malignant mesothelioma pleural tissues.
4.1 MATERIALS AND METHODS
4.1.1 DATA COLLECTION
To systematically collect MPM microarray studies PubMed (http://www.ncbi.nlm.nih.gov/pubmed) was searched with keywords related to the study background. The automatic search covered up to the end of December 2011. The search was extended to the two largest public microarray data repositories: GEO and ArrayExpress. MPM microarray studies suitable for meta-analysis were selected according to the following inclusion/exclusion criteria:
4-2
- any human studies investigating at least four patients with MPM and at least four patients with corresponding normal pleural samples using high-density arrays were included,
- any studies using mesothelioma derived cell lines or studies using specialized arrays were excluded,
- any studies where patients with MPM have been exposed to drugs were excluded.
In the following, datasets will be referred to by the name of the first author of the related papers.
4.1.2 DATA PREPROCESSING
The quality assessment of the raw data was performed using affyPLM [74] and arrayQualityMetrics [75] Bioconductor packages with the aim of identifying and possibly removing poor quality arrays and to detect possible systematic effects.
All datasets were preprocessed independently for background correction, normalization and summarization.
According to Ramasamy [48], who stated that the same preprocessing algorithm should be used for multiple studies conducted on the same platform, raw data from Crispi and Røe were preprocessed using the implementation of the Affymetrix MAS 5.0 algorithm provided by the Bioconductor package simpleaffy [73], setting the scale parameter to 100. Gene expression levels for each microarray in the Gordon study were generated and scaled to a target intensity of 100 using Affymetrix Microarray Suite v.5.0 (Santa Clara, USA). The log2 of the expression values
was taken.
Alternatively, in order to assess the overall effect of the preprocessing methods on meta-analysis results, for all the studies the
4-3
data preprocessed using the algorithm described by the original authors in their papers were also considered. In particular, probe set intensities were obtained by means of gcrma [147] followed by quantile normalization for Crispi dataset and by means of RMA (Robust Multi-array Average) [148] for Røe dataset. In both cases, the gene expression values of the technical replicates in the Røe dataset have been averaged after the preprocessing step. The assessment of data quality was repeated after the preprocessing step to check the normalization efficiency.
Box plots and density plots for each sample in each dataset were used to evaluate the effect of the preprocessing steps on the data.
4.1.3 DATA ANNOTATION
To combine microarray data across studies a unique gene-level identifier must be adopted. We relied on official Gene Symbols by the HUGO Gene Nomenclature Committee [149] to achieve a uniform annotation across array versions. Affymetrix probe set IDs were mapped to the corresponding Gene Symbol IDs using platform-specific Bioconductor annotation packages such as hgu133a.db [Carlson M, hgu133a.db: Affymetrix Human Genome U133 Set annotation data (chip hgu133a). R package version 2.8.0], hgu133plus2.db [Carlson M, hgu133plus2.db: Affymetrix Human Genome U133 Plus 2.0 Array annotation data (chip hgu133plus2). R package version 2.8.0] and AnnotationDbi [Pages H, Carlson M et al., AnnotationDbi: Annotation Database Interface. R package version 1.20.3]. Probe set IDs with no Gene Symbol and probe set IDs mapping to more than one Gene Symbol were discarded from each dataset. Vice versa, when multiple probes sets mapped to an identical Gene Symbol, the probe set ID with the largest Inter Quartile Range (IQR) of expression values (among all multiple probe
4-4
IDs) was selected to represent the gene. Larger IQR represents greater variability (and thus greater information content) in the data and this probe matching method has been recommended in Bioconductor [74]. Only the genes in common between the three datasets were retained for the analysis.
The gene expression values for the genes in common to all studies from the three datasets were bound together to form two final meta-datasets, denoted as A and B, containing MAS 5.0 preprocessed data and data processed according to the original authors’ methods, respectively.
Box plots and PCA plots of meta-datasets A and B were used to inspect for any clustering of arrays by studies. affy [150] and EMA (Easy Microarray data Analysis) [151] Bioconductor packages were used to obtain these plots.
4.1.4 GENE FILTERING
As stated in Chapter 2, it is unclear if filtering is beneficial from a meta-analysis perspective. Here we tried to evaluate the effect of a common filtering strategy on meta-analysis results. Two sequential steps of gene filtering were applied to meta-datasets A and B. In the first step, genes with very low expression showing small average expression values across studies were filtered out. Specifically, mean intensities of each gene across all samples in each study were calculated and the corresponding ranks were obtained. The sum of such ranks across the three studies of each gene was calculated and genes with the lowest 30% rank sum were considered unexpressed genes and were filtered out. Similarly, in the second step, genes with small variation between the experimental conditions were filtered out by replacing mean intensity in the first step with standard deviation. Genes with the lowest 30% rank sum of standard
4-5
deviations were filtered out. Finally only the genes which passed the two filtering steps were retained for further analysis. We denoted these additional filtered meta-datasets as A1 and B1.
Box plots and PCA plots of datasets A1 and B1 were used to inspect for any clustering of arrays by studies.
4.1.5 DATA META-ANALYSIS
A combination of meta-analysis methods was applied to both unfiltered (A and B) and filtered (A1 and B1) meta-datasets. First of all, a standard limma analysis was performed including a study effect in the linear model. The Benjamini and Hochberg (BH) multiple correction method with a threshold of 5% was applied to identify the DEGs. In addition three analysis approaches were applied to the meta-datasets:
1. the weighted inverse normal p-value combination method proposed by Marot and colleagues [40] and implemented in the R package metaMA. Both the standard t-statistics and the moderated t-statistics were used to calculate the p-values for each gene in the individual studies analyses. We will refer to this method as p-value combination method.
2. The effect size combination approach both in the Choi and colleagues’ version [16], implemented in the Bioconductor package GeneMeta, and in the Marot and colleagues’ version [40], available in the R package metaMA. We will refer to these methods as the GeneMeta and the metaMA method, respectively.
3. The rank combination method by Hong and colleagues [42], implemented in the Bioconductor package RankProd. We will refer to this methods as RankProd method.
4-6
The DEGs were selected at significance level of 0.05 in all methods. In order to the selected DEGs lists from different methods be more comparable in size, we considered the lists of the top 500 genes with the smallest p-values/q-values for each method.
All analysis was carried out in R version 2.15.2 and Bioconductor release 2.11.
To further assess the DEGs lists produced by the different methods, pathway analysis was done using PathwayExpress [152]. Hypergeometric distribution and FDR were used for the p-value calculation and p-value correction, respectively. The set of genes shared by all the three datasets was selected as reference array for the over-representation analysis. The magnitude of the measured expression changes was not used because this information was not available for all the tested methods.
4.2 RESULTS
Only four microarray studies [153-156] met the inclusion/exclusion criteria. This may depend on the difficulty of collecting a large number of tissue samples, due to the low incidence of MPM. However the two papers by Røe and colleagues referred to the same dataset so there were only three distinct datasets suitable for the meta-analysis.
By querying ArrayExpress and GEO, the raw data (in the form of CEL files) were retrieved for Crispi and Røe studies but not for Gordon study for which only gene expression data have been deposited in GEO database. The authors were asked for the raw data but they did not make them available.
The studies were performed on different versions of the Affymetrix oligonucleotide microarray platform. The Crispi and Røe studies used
4-7
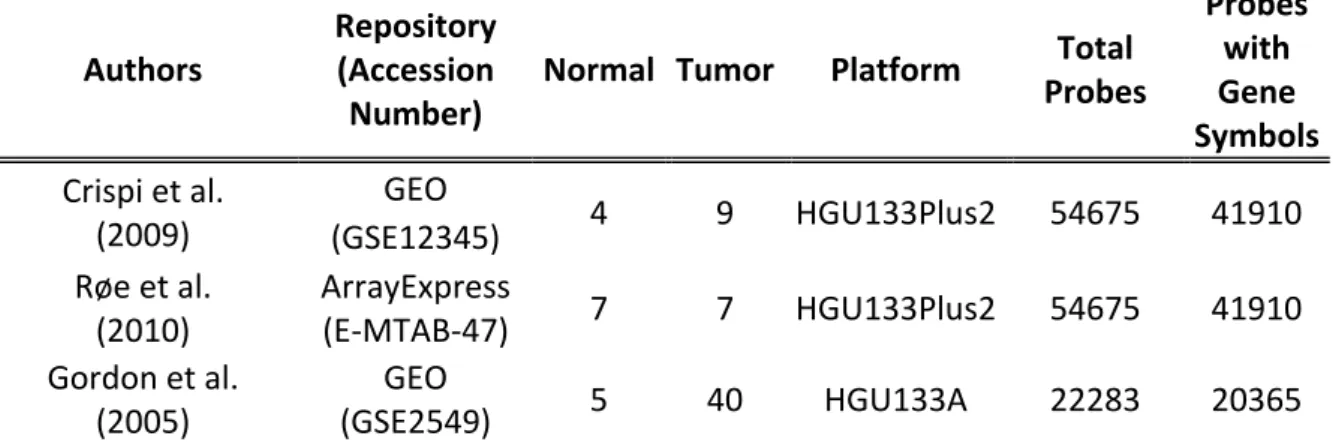
Affymetrix Human Genome U133 Plus2.0 GeneChip (Santa Clara, CA, USA), containing 54675 probe sets, each with eleven probe pairs. The Crispi dataset included thirteen samples, four normal pleural samples and nine MPM samples. The Røe dataset consisted of one papillary serous adenocarcinoma pleura sample, one pleural plaque sample with unknown disease condition, seven MPM samples, where two were from the same patient, seven parietal pleural samples, where two were from the same patient, and four visceral pleural samples that were from the same control patients. Finally, the Gordon study was performed on Affymetrix Human Genome U133A GeneChip, containing 22283 probe sets, each with eleven probe pairs. This dataset included forty human MPM tumor specimens, five normal pleura specimens, four normal lung specimens and five mesothelial cell lines, where four are MPM derived and one (Met5a) is a nontumorigenic immortalized mesothelial cell line. The papillary serous adenocarcinoma sample and the pleural plaque sample with unknown disease condition Røe
[155] forty human MPM tumor specimens and the five normal pleural specimens in the Gordon dataset were retained for the meta-analysis.
The
4-8 Authors
Repository (Accession Number)
Normal Tumor Platform Total Probes Probes with Gene Symbols Crispi et al. (2009) GEO 4 9 HGU133Plus2 54675 41910 (GSE12345) Røe et al. (2010) ArrayExpress (E-MTAB-47) 7 7 HGU133Plus2 54675 41910 Gordon et al. (2005) GEO (GSE2549) 5 40 HGU133A 22283 20365
Table 4.1: Microarray datasets and samples included in the meta-analysis
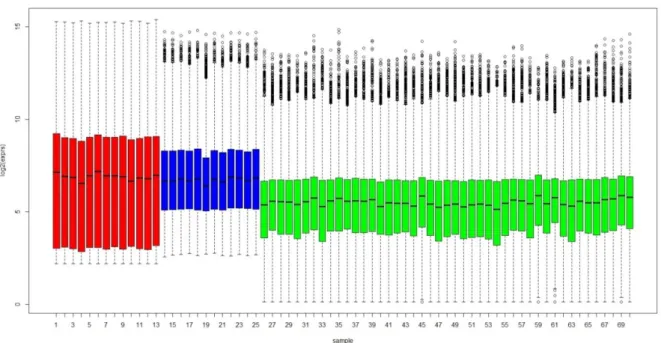
Figure 4.1 and Figure 4.2 show the box plots of MAS 5.0 preprocessed, log2 transformed gene expression data separately for the
three datasets, while box plots of preprocessed data obtained applying different algorithms for each dataset are shown in Figure 4.2 and Figure 4.3.
Figure 4.1: Box plots of MAS 5.0 preprocessed data from Crispi (left) and Røe
4-9
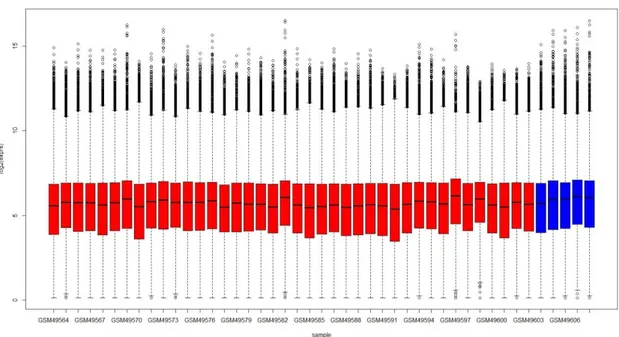
Figure 4.2: Box plots of MAS 5.0 preprocessed data from Gordon dataset
(red=MPM samples, blue=control samples)
Figure 4.3: Box plots of data preprocessed using the algorithms described by
individual authors, gcrma for Crispi dataset (left) and RMA for Røe dataset (right) (red=MPM samples, blue=control samples)
In both cases, the preprocessed data from the three studies were matched using Gene Symbol IDs. By excluding the control probe sets, the 22215 probe sets in the U133A platform mapped to 20365 Gene Symbols, while the 54613 probe sets in the U133 Plus 2.0 platform mapped to
4-10
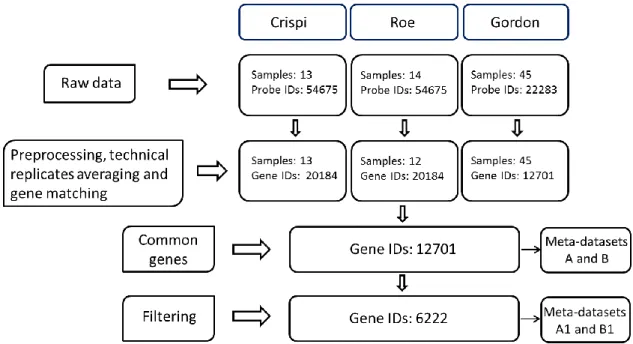
41910 Gene Symbols. After solving the many-to-many relationships, 12701 and 20184 unique Gene Symbols were found in the U133A and U133 Plus 2.0 platform, respectively. Only the 12701 genes in common to all three datasets were kept for the meta-analysis. Consequently the meta-datasets A and B consist of 12701 genes and 70 samples.
After the filtering steps, 6222 matched genes in three studies were analyzed. The meta-datasets A1 and B1 consist of 6222 genes and 70 samples. We note that the somewhat ad hoc gene filtering procedure is necessary and is commonly used in microarray analysis. This procedure can reduce false positives from non-expressed or non-informative genes and increase statistical power in multiple test correction; however important DEGs can be discarded. Figure 4.4 shows the preprocessing diagram and the number of genes selected by each preprocessing step.
Figure 4.4: A diagram for data preprocessing, gene matching and gene filtering
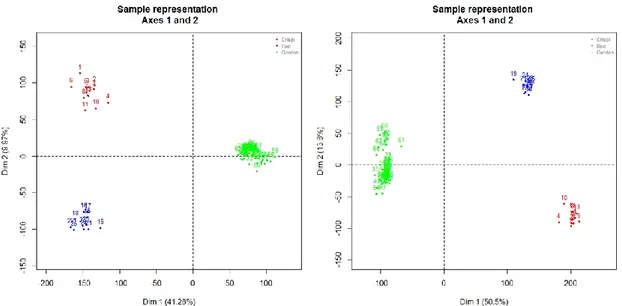
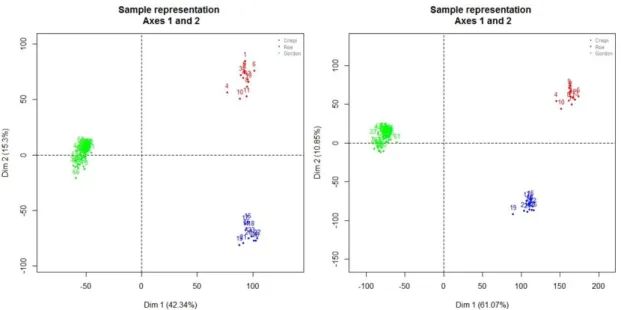
PCA plots for the meta-datasets A and B are reported in Figure 4.5. In both cases, PCA plots highlight a clustering of arrays by studies.
4-11
Figure 4.5: PCA plots of MAS 5.0 preprocessed data (left) and data preprocessed
using the algorithms described by individual authors (right) (common Gene Symbols only) (red=Crispi dataset, blue= Røe e dataset, green=Gordon dataset)
The same grouping of arrays by studies is evident from the box plots (see Figure 4.6 and Figure 4.7). However the box plots highlight better how the differences between the studies are relevant when the data preprocessed using different algorithms for the three datasets are considered compared to the MAS 5.0 processed data. Figure 4.6 also suggests a possible ‘platform effect’ as the Crispi and Røe datasets, performed on the same Affymetrix platform, appear much more similar to each other than to the data from the Gordon study performed on a different Affymetrix platform.
4-12
Figure 4.6: Box plots of MAS 5.0 preprocessed data (common Gene Symbols
only) (red=Crispi dataset, blue= Røe dataset, green=Gordon dataset)
Figure 4.7: Box plots of data preprocessed using the algorithms described by
individual authors (common Gene Symbols only) (red=Crispi dataset, blue= Røe dataset, green=Gordon dataset)
4-13
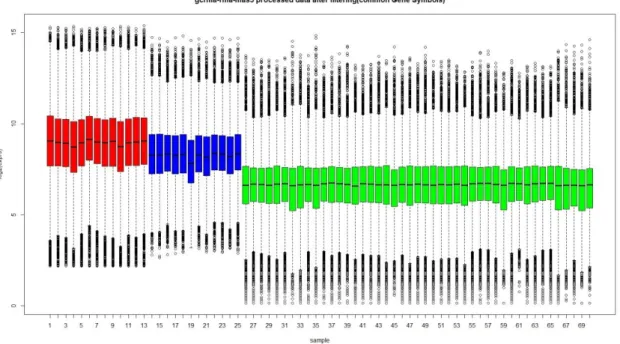
The same considerations apply to meta-datasets A1 and B1, whose PCA plots and box plots are shown in Figure 4.8, Figure 4.9 and Figure 4.10.
Figure 4.8: PCA plots of MAS 5.0 preprocessed data (left) and data preprocessed
using the algorithms described by individual authors (right) after filtering (common Gene Symbols only) (red=Crispi dataset, blue= Røe dataset, green=Gordon dataset)
Figure 4.9: Box plots of MAS 5.0 preprocessed data after filtering (common Gene
4-14
Figure 4.10: Box plots of data preprocessed using the algorithms described by
individual authors after filtering (common Gene Symbols only) (red=Crispi dataset, blue= Røe dataset, green=Gordon dataset)
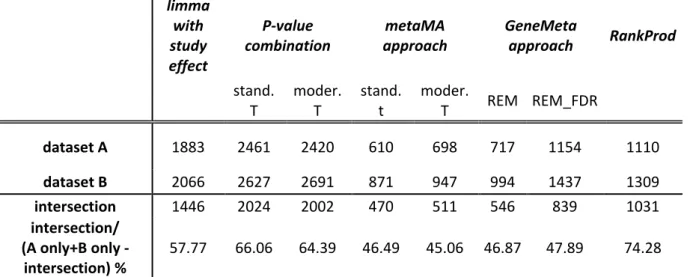
Concerning meta-dataset A, at a 5% BH threshold, using a limma model including a study effect, 1883 genes were found statistically significant. The p-value combination claimed 2420 and 2461 genes as differentially expressed at the same BH threshold using the moderated t-statistics and the standard t-t-statistics, respectively. For the metaMA method, 698 and 610 genes were found as differentially expressed at a 5% BH threshold using the moderated t-statistics and the standard t-statistics, respectively. The GeneMeta method identified 717 DEGs at a 5% BH threshold using the REM. The Cochran’s Q statistics has been used to test the between-study variability and decide between the REM and the FEM. Using the SAM type analysis to estimate the FDR, 1154 DEGs were identified with a FDR<0.05 for the two-sided hypothesis. These 1154 DEGs included the 717 DEGs identified using the BH multiple correction procedure. Finally, the RankProd method detected 1110 DEGs. The number of DEGs identified by each method for meta-datasets A and B is
4-15
summarized in Table 4.2, while the meta-analysis results for the filtered meta-datasets A1 and B1 are illustrated in Table 4.3.
limma with study effect P-value combination metaMA approach GeneMeta approach RankProd stand. T moder. T stand. t moder. T REM REM_FDR dataset A 1883 2461 2420 610 698 717 1154 1110 dataset B 2066 2627 2691 871 947 994 1437 1309 intersection 1446 2024 2002 470 511 546 839 1031 intersection/ (A only+B only -intersection) % 57.77 66.06 64.39 46.49 45.06 46.87 47.89 74.28
Table 4.2: Number of DEGs provided by the different meta-analysis approaches
at 5% BH threshold for both datasets A and B and their intersections
limma with study effect P-value combination metaMA approach GeneMeta approach RankProd stand. T moder. t stand. t moder. T REM REM_FDR dataset A1 1485 1684 1699 559 626 627 912 668 dataset B1 1548 1787 1805 667 742 717 1018 735 intersection 1095 1291 1293 382 428 423 619 511 intersection/ (A1 only+B1 only
-intersection) %
56.5 59.22 58.48 45.26 45.53 45.93 47.22 57.29
Table 4.3: Number of DEGs provided by the different meta-analysis approaches
at 5% BH threshold for both datasets A1 and B1 and their intersections
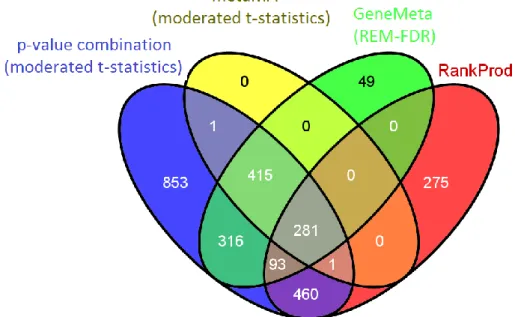
Venn diagrams corresponding to the comparisons of these methods applied to meta-dataset A are given in Figure 4.11 and Figure 4.12.
4-16
Figure 4.11: Venn diagram for meta-dataset A comparing the DEGs lists at a 5%
BH threshold obtained by combining p-values, effect sizes (using both metaMA and GeneMeta approaches) and ranks
Figure 4.12: Venn diagram for meta-dataset A comparing the DEGs in common
between the four meta-analysis methods to the DEGs list provided by limma including a study effect
It was found that 281 DEGs were in common between the four approaches (gray sector in Figure 4.11). This poor overlap is mainly due to the DEGs identified by the RankProd method which look quite different from the DEGs lists generated by the other meta-analysis approaches. In
4-17
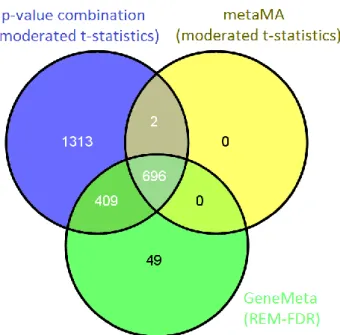
fact, excluding the RankProd method, the number of DEGs in common between the other three approaches goes up to 696 (see Figure 4.13).
Figure 4.13: Venn diagram comparing the DEGs lists at a 5% BH threshold
obtained by combining p-values and effect sizes (using both metaMA and GeneMeta approaches) for meta-dataset A.
It can also be noticed that the p-value combination method detected all the genes found with the metaMA effect size combination method, all but 49 genes found with the GeneMeta method followed by SAM type analysis to estimate the FDR and all but 275 genes identified by the RankProd method. On the other hand, 853 genes were detected only by the p-value combination method. For each method the intersections among the identified DEGs for meta-datasets A and B and A1 and B1 are summarized in Table 4.2 and Table 4.3, respectively.
Since many biological replicates were involved, we could not observe on these datasets the gain of DEGs usually found with shrinkage approaches. Indeed, the effect size combination based on classical t-tests detected 610 DEGs while the effect size combination based on moderated t-tests found 698 DEGs. We could check that, in this case, using the exact variance for standard effect sizes, as done by the metaMA method, the
4-18
number of DEGs did not change substantially compared with using the asymptotic variance, as done by GeneMeta. Indeed, the effect size combination based on usual t-tests and the exact variance detected 610 DEGs, while the z-score given by the GeneMeta package found 717 DEGs. Table 4.2 also points out that p-value combination method detected many more genes than the other approaches. The same considerations apply to the meta-datasets B, A1 and B1. Concerning the intersections between the DEGs lists detected by the diverse methods in the meta-datasets A and B, it is worth noting that the greater overlap (74.28 %) was reached by the RankProd method thus confirming the reduced dependence of this approach by the preprocessing methods adopted in single-study analysis and its greater robustness against heterogeneity across studies [66]. The intersections between the DEGs lists detected by the different methods in the meta-datasets A1 and B1 are instead comparable in size.
As far as gene rankings were concerned, they were very similar. The absolute values of test statistics used by the different meta-analysis methods were ranked in descending order and the Spearman rank correlation coefficients were calculated for each pair of methods. Detailed results for meta-datasets A and B are summarized in Table 4.4 and Table 4.5, respectively. As expected, the highest correlation (0.99) was found between GeneMeta and metaMA methods given the similarity between the used summary test statistics. Slightly lower values were obtained for meta-dataset B. Concerning meta-datasets A1 and B1, a slight increase of the correlation coefficients can be observed. Spearman rank correlation coefficients for dataset A1 are summarized in Table 4.8.
In order to make the DEGs lists from different methods more comparable in size, the top 500 DEGs for all the methods were selected.
4-19
Figure 4.14 and Figure 4.15 are Venn diagrams displaying the overlap of the top 500 DEGs found by different methods applied to meta-dataset A.
Figure 4.14: Venn diagram showing the overlap of the top 500 DEGs found by
different meta-analysis methods applied to meta-dataset A
Figure 4.15: Venn diagram showing the overlap of the top 500 DEGs in common
between the four meta-analysis methods and the top 500 DEGs found by limma including a study effect applied to meta-dataset A
Detailed information concerning the size of the overlap between the top 500 DEGs lists found using the different meta-analysis methods for
4-20
datasets A, B and A1 are presented in Table 4.6, Table 4.7 and Table 4.9, respectively. Also in this case, the use of the filtering process results in a greater overlap of the results provided by the different meta-analysis methods.
The fact that a significant number of genes were selected by only one of the methods shows that the gene ranking is based on different perspectives, thus it may be useful to select candidate genes using a combination of these methods.
4-21
limma with
study effect P-value combination metaMA approach
GeneMeta
approach RankProd
standard t moderated t standard t moderated t REM_FDR
limma with study effect 1 P-value combination standard t 0.883 1 moderated t 0.897 0.994 1 metaMA approach standard t 0.883 0.836 1 moderated t 0.898 0.831 0.993 1 GeneMeta approach REM_FDR 0.88 0.823 0.82 0.999 0.993 1 RankProd 0.768 0.687 0.717 0.78 0.81 0.785 1
Table 4.4: Spearman rank correlations for meta-dataset A
limma with
study effect P-value combination metaMA approach
GeneMeta
approach RankProd
standard t moderated t standard t moderated t REM_FDR
limma with study effect 1 P-value combination standard t 0.904 1 moderated t 0.92 0.995 1 metaMA approach standard t 0.772 0.832 1 moderated t 0.783 0.833 0.99 1 GeneMeta approach REM_FDR 0.684 0.717 0.717 0.863 0.845 1 RankProd 0.882 0.754 0.782 0.74 0.761 0.637 1
4-22
limma with
study effect P-value combination metaMA approach
GeneMeta
approach RankProd
standard t moderated t standard t moderated t REM_FDR
limma with study effect 100 P-value combination standard t 76.2 100 moderated t 78.6 100 metaMA approach standard t 64.4 54.6 100 moderated t 65 54.8 100 GeneMeta approach REM_FDR 63.4 53.6 52.8 96.4 86.6 100 RankProd 33.6 37.6 42.2 23.6 23.8 22.6 100
Table 4.6: Overlap between the top 500 DEGs lists identified by various methods for meta-dataset A, expressed as a percentage
limma with
study effect P-value combination metaMA approach
GeneMeta
approach RankProd
standard t moderated t standard t moderated t REM_FDR
limma with study effect 100 P-value combination standard t 75.8 100 moderated t 78 100 metaMA approach standard t 57.6 54 100 moderated t 56.6 56.8 100 GeneMeta approach REM_FDR 55.8 52.2 53 95.4 93 100 RankProd 37.4 40.8 43 25.4 25.8 24.2 100
4-23
limma with
study effect P-value combination metaMA approach
GeneMeta
approach RankProd
standard t moderated t standard t moderated t REM_FDR
limma with study effect 1 P-value combination standard t 0.922 1 moderated t 0.935 0.996 1 metaMA approach standard t 0.874 0.848 1 moderated t 0.883 0.846 0.996 1 GeneMeta approach REM_FDR 0.869 0.837 0.837 0.999 0.996 1 RankProd 0.892 0.763 0.79 0.806 0.829 0.808 1
Table 4.8: Spearman rank correlations for meta-dataset A1
limma with
study effect P-value combination metaMA approach
GeneMeta
approach RankProd
standard t moderated t standard t moderated t REM_FDR
limma with study effect 100 P-value combination standard t 81.2 100 moderated t 84.2 100 metaMA approach standard t 64 56 100 moderated t 63.2 57.8 100 GeneMeta approach REM_FDR 63.2 54.8 56.4 97 94.2 100 RankProd 47.8 49.4 54 36.4 37.4 35.6 100
4-24
4.2.1 COMPARISONS AMONG THE DEGs LISTS AT PATHWAY-LEVEL
To further assess the DEGs lists, a pathway analysis was performed. Table 4.10 shows the top five ranked pathways for the 75 and 79 DEGs (among the top 500 genes) that were selected by all methods simultaneously for meta-datasets A and B, respectively. Table 4.11 shows the top five ranked pathways for the 133 and 129 DEGs (among the top 500 genes) that were selected by all methods simultaneously for meta-datasets A1 and B1, respectively.Dataset A
Pathway Name Impact Factor p-value corrected p-value
Asthma 4,59 0,01 0,14
Hematopoietic cell lineage 4,35 0,01 0,14
Apoptosis 4,31 0,01 0,14
Toll-like receptor signaling pathway 4,04 0,02 0,14
Graft-versus-host disease 4,02 0,02 0,14
Dataset B
Pathway Name Impact Factor p-value corrected p-value
DNA replication 3,97 0,02 0,32
Tight junction 3,27 0,04 0,32
Epithelial cell signaling in Helicobacter pylori infection 2,93 0,05 0,32
Non-homologous end-joining 2,55 0,08 0,32
ECM-receptor interaction 2,40 0,09 0,32
Table 4.10: Pathway analysis results for meta-datasets A and B considering the top
4-25 Dataset A1
Pathway Name Impact Factor p-value corrected p-value
Cell adhesion molecules (CAMs) 8,92 1,33E-04 0,01
Neuroactive ligand-receptor interaction 6,28 0,00 0,04
Renin-angiotensin system 5,05 0,01 0,09
ECM-receptor interaction 4,27 0,01 0,14
Tight junction 3,77 0,02 0,17
Dataset B1
Pathway Name Impact Factor p-value corrected p-value
Neuroactive ligand-receptor interaction 8,91 1,35E-04 0,00
ECM-receptor interaction 6,21 0,00 0,03
Cell adhesion molecules (CAMs) 5,00 0,01 0,07
Tight junction 3,29 0,04 0,29
Non-homologous end-joining 2,52 0,08 0,44
Table 4.11: Pathway analysis results for meta-datasets A1 and B1 considering the
top 500 DEGs selected by all the methods simultaneously
Table 4.12 and Table 4.13 show the most perturbed KEGG pathways for the top 500 DEGs that were selected by each method, applied to meta-datasets A and B, respectively. Analogous information for meta-datasets A1 and B1 is summarized in Table 4.14 and Table 4.15. A better agreement between the top pathways for the four meta-analysis approaches and between them and the top pathways provided by the intersection of all the methods was observed in the case of filtered datasets A1 and B1 compared to datasets A and B.
Despite the poor overlap of the results at the gene-level, pathway analysis showed a higher concordance. Moreover the differences among the DEGs lists for meta-datasets A and B were confirmed at the pathway-level. In fact, although some pathways such as PPAR signaling pathway, complement and coagulation cascades and cytokine-cytokine receptor interaction were identified in both datasets by two or more meta-analysis methods, the
4-26
ranking is quite different and there are also some pathways unique for each dataset (e.g. apoptosis pathway detected only in dataset A and neuroactive ligand-receptor interaction and cell adhesion molecules (CAMs) pathways retrieved only in dataset B). Furthermore it is worth noting that the impact factors (the FDR-corrected p-values) for the top pathways by the RankProd method are higher (respectively, lower) compared to all the other methods in all meta-datasets. A higher impact factor indicates that the top genes lists contain genes that aggregate into certain functions as opposed to individual genes that are unrelated. Thus results with higher impact factor may make more sense and be more easily interpretable.
4-27
DEG_limma_with_study_effect
Pathway Name Impact Factor p-value corrected p-value
PPAR signaling pathway 8,88 1,39E-04 0,01
Complement and coagulation cascades 5,47 0,00 0,17
Apoptosis 4,05 0,02 0,35
Renin-angiotensin system 3,77 0,02 0,35
Thyroid cancer 3,66 0,03 0,35
DEGs_p-value combination (moderated t-statistics)
Pathway Name Impact Factor p-value corrected p-value
PPAR signaling pathway 8,88 1,39E-04 0,01
Hematopoietic cell lineage 6,50 0,00 0,06
Adipocytokine signaling pathway 4,54 0,01 0,28
ECM-receptor interaction 4,26 0,01 0,28
Cytokine-cytokine receptor interaction 3,85 0,02 0,29
DEGs_metaMA (moderated t-statistics)
Pathway Name Impact Factor p-value corrected p-value
Complement and coagulation cascades 9,95 4,76E-05 0,00
Renin-angiotensin system 8,17 2,82E-04 0,01
Hematopoietic cell lineage 5,25 0,01 0,14
Cell adhesion molecules (CAMs) 4,93 0,01 0,15
Apoptosis 4,05 0,02 0,28
DEGs_GeneMeta (FDR)
Pathway Name Impact Factor p-value corrected p-value
Renin-angiotensin system 5,82 0,00 0,15
Complement and coagulation cascades 5,47 0,00 0,15
Apoptosis 5,17 0,01 0,15
DNA replication 4,60 0,01 0,16
Cytokine-cytokine receptor interaction 4,57 0,01 0,16
DEGs_RankProd
Pathway Name Impact Factor p-value corrected p-value
ECM-receptor interaction 11,10 1,51E-05 0,00
PPAR signaling pathway 8,88 1,39E-04 0,01
Focal adhesion 6,48 0,00 0,04
Adipocytokine signaling pathway 5,86 0,00 0,06
Systemic lupus erythematosus 4,92 0,01 0,11
4-28
DEGs_limma_with_study_effect
Pathway Name Impact Factor p-value corrected p-value
PPAR signaling pathway 8,88 1,39E-04 0,01
Cell adhesion molecules (CAMs) 5,99 0,00 0,07
Adipocytokine signaling pathway 5,86 0,00 0,07
Hematopoietic cell lineage 5,25 0,01 0,10
ECM-receptor interaction 4,26 0,01 0,19
DEGs_p-value combination (moderated t-statistics)
Pathway Name Impact Factor p-value corrected p-value
PPAR signaling pathway 8,88 1,39E-04 0,01
Cell adhesion molecules (CAMs) 5,99 0,00 0,07
Adipocytokine signaling pathway 5,86 0,00 0,07
Hematopoietic cell lineage 5,25 0,01 0,10
ECM-receptor interaction 4,26 0,01 0,19
DEGs_metaMA (moderated t-statistics)
Pathway Name Impact Factor p-value corrected p-value
Complement and coagulation cascades 8,35 2,37E-04 0,02
Cell adhesion molecules (CAMs) 5,99 0,00 0,10
PPAR signaling pathway 4,54 0,01 0,28
ECM-receptor interaction 4,26 0,01 0,28
Vibrio cholerae infection 3,89 0,02 0,30
DEGs_GeneMeta (FDR)
Pathway Name Impact Factor p-value corrected p-value
Complement and coagulation cascades 8,35 2,37E-04 0,02
Cell adhesion molecules (CAMs) 5,99 0,00 0,10
Vibrio cholerae infection 5,19 0,01 0,14
ABC transporters 4,36 0,01 0,22
ECM-receptor interaction 4,26 0,01 0,22
DEGs_RankProd
Pathway Name Impact Factor p-value corrected p-value
ECM-receptor interaction 11,10 1,51E-05 0,00
PPAR signaling pathway 7,31 0,00 0,03
Focal adhesion 6,48 0,00 0,04
Cell adhesion molecules (CAMs) 4,93 0,01 0,11
Systemic lupus erythematosus 4,92 0,01 0,11
4-29
DEGs_limma_with_study_effect
Pathway Name Impact Factor p-value corrected p-value
Renin-angiotensin system 7,52 5,42E-04 0,04
Neuroactive ligand-receptor interaction 6,55 0,00 0,05
Cell adhesion molecules (CAMs) 5,74 0,00 0,07
Cytokine-cytokine receptor interaction 5,59 0,00 0,07
PPAR signaling pathway 4,79 0,01 0,12
DEGs_p-value combination (moderated t-statistics)
Pathway Name Impact Factor p-value corrected p-value
PPAR signaling pathway 6,23 0,00 0,13
Cell adhesion molecules (CAMs) 5,74 0,00 0,13
Renin-angiotensin system 4,76 0,01 0,19
Cytokine-cytokine receptor interaction 4,65 0,01 0,19
Neuroactive ligand-receptor interaction 4,08 0,02 0,23
DEGs_metaMA (moderated t-statistics)
Pathway Name Impact Factor p-value corrected p-value
Neuroactive ligand-receptor interaction 6,55 0,00 0,09
Cell adhesion molecules (CAMs) 5,74 0,00 0,09
Cytokine-cytokine receptor interaction 5,59 0,00 0,09
Complement and coagulation cascades 5,38 0,00 0,09
Renin-angiotensin system 4,76 0,01 0,14
DEGs_GeneMeta (FDR)
Pathway Name Impact Factor p-value corrected p-value
Cell adhesion molecules (CAMs) 5,74 0,00 0,14
Complement and coagulation cascades 5,38 0,00 0,14
Neuroactive ligand-receptor interaction 5,25 0,01 0,14
Renin-angiotensin system 4,76 0,01 0,17
Cytokine-cytokine receptor interaction 3,78 0,02 0,36
DEGs_RankProd
Pathway Name Impact Factor p-value corrected p-value
ECM-receptor interaction 14,05 7,89E-07 5,84E-05
Focal adhesion 11,35 1,18E-05 4,35E-04
Cytokine-cytokine receptor interaction 10,16 3,87E-05 9,56E-04
PPAR signaling pathway 9,56 7,07E-05 0,00
Neuroactive ligand-receptor interaction 6,55 0,00 0,02
4-30
DEGs_limma_with_study_effect
Pathway Name Impact Factor p-value corrected p-value
PPAR signaling pathway 9,89 5,08E-05 0,00
Cell adhesion molecules (CAMs) 6,29 0,00 0,07
Neuroactive ligand-receptor interaction 5,89 0,00 0,07
Adipocytokine signaling pathway 4,26 0,01 0,28
ECM-receptor interaction 3,81 0,02 0,35
DEGs_p-value combination (moderated t-statistics)
Pathway Name Impact Factor p-value corrected p-value
PPAR signaling pathway 8,10 3,03E-04 0,02
Cell adhesion molecules (CAMs) 6,29 0,00 0,07
Neuroactive ligand-receptor interaction 4,39 0,01 0,28
Adipocytokine signaling pathway 4,26 0,01 0,28
ECM-receptor interaction 3,81 0,02 0,35
DEGs_metaMA (moderated t-statistics)
Pathway Name Impact Factor p-value corrected p-value
Neuroactive ligand-receptor interaction 9,40 8,28E-05 0,01
Leukocyte transendothelial migration 6,14 0,00 0,08
Cell adhesion molecules (CAMs) 5,16 0,01 0,15
Complement and coagulation cascades 4,26 0,01 0,28
DNA replication 3,59 0,03 0,43
DEGs_GeneMeta (FDR)
Pathway Name Impact Factor p-value corrected p-value
Neuroactive ligand-receptor interaction 9,40 8,28E-05 0,01
DNA replication 6,71 0,00 0,05
Complement and coagulation cascades 5,58 0,00 0,10
Cell adhesion molecules (CAMs) 4,13 0,02 0,29
Leukocyte transendothelial migration 4,02 0,02 0,29
DEGs_RankProd
Pathway Name Impact Factor p-value corrected p-value
ECM-receptor interaction 15,93 1,20E-07 8,90E-06
Focal adhesion 10,19 3,77E-05 0,00
PPAR signaling pathway 9,89 5,08E-05 0,00
Neuroactive ligand-receptor interaction 9,40 8,28E-05 0,00
Cell adhesion molecules (CAMs) 8,84 1,46E-04 0,00
4-31
4.3 DISCUSSION
The increasing availability and maturity of DNA microarray technology has led to an explosion of profiling studies, especially in cancer research. To extract maximum value from the accumulating mass of publicly available cancer gene expression data, methods are needed to evaluate, integrate, and inter-validate multiple datasets. Therefore, we applied a combination of statistical methods to perform a meta-analysis of independent microarray datasets in MPM tumor.
A relevant number of studies on gene expression in MPM have been published so far. Gene expression profiling microarrays have been widely used in mesothelioma research to improve histological classifications [157], to identify predictive or prognostic biomarkers [158, 159] or to examine response to therapy [160]. One of the problems identified with the use of microarray technology and particularly in experiments involving MPM samples, has been the lack of concordance between the several studies. From this, one can conclude that microarray analysis of MPM would appear to be very ‘noisy’, and the differential expression of the identified genes should be confirmed independently at the RNA (RT-qPCR) or protein level (immunohistochemistry) [161]. There are several potential reasons for the low concordance of these studies such as different sample types (e.g. mesothelioma derived cell lines or mesothelioma patient samples) and/or histological subtypes, array platforms and number of samples. Therefore, a comparison of the results of individual analyses is not enough to evaluate the available gene expression data. Gene expression data often lack statistical power especially due to low sample size, as is the case in most of MPM microarray studies. This might depend on the low incidence of MPM in addition to
4-32
the costs of the technology and generally leads to underestimation of variances, which inflates the false-positive rate. Meta-analysis thus represents a good solution to overcome the problem of reduced statistical power of MPM microarray experiments and a valuable alternative for cross-study validation.
The quality of the meta-analysis benefits from the number and the quality of single datasets analyzed. Focusing on differential expression analysis between normal and malignant pleural mesothelioma tissues, only three microarray studies compliant with our inclusion/exclusion criteria were identified and included in the meta-analysis. All the selected studies were performed on two different array versions of the same Affymetrix platform. We tried to obtain raw data for all of them but only the two most recent studies (Crispi and Røe) have the CEL files stored in public databases. For the Gordon study only MAS 5.0 preprocessed gene expression data were publicly available and this might heavily affect the down-stream analysis. In fact, to obtain consistently preprocessed data, the implementation of the MAS 5.0 algorithm provided by the Bioconductor package simpleaffy was used to process Crispi and Røe datasets. This choice has two limitations. On the one hand, there may be some not negligible differences between the expression data provided by the original MAS 5.0 algorithm and its re-implementation. On the other hand, in the last years new preprocessing methods, such as RMA and gcrma, have been developed that outperform MAS 5.0 in terms of sensitivity and specificity (i.e. the true and false detection rate) [162], especially for the detection of DEGs [163]. Despite the use of the same preprocessing method, our data showed a strong between-study variability. Gene expression data obtained applying to each dataset the preprocessing algorithms suggested by the original authors were also considered for the meta-analysis with
4-33
the aim to evaluate the impact of the preprocessing methods on the meta-analysis results. In addition, the number of genes evaluated was reduced applying an intensity filter followed by an IQR filter in order to eliminate non-expressed or non-informative genes and increase statistical power in multiple comparison procedure.
To date only two papers by Hong and colleagues [109] and Campain and colleagues [99] performed a systematic comparative analysis on microarray meta-analysis methods performances, in terms of sensitivity and specificity. Although the two studies provided insightful conclusions, the number of methods compared (three and five methods, respectively) and the number of case studies examined (two and three case studies, respectively with each case study combining only 2–5 microarray datasets) were very limited. In addition, some key conclusions from the two papers were even contradictory. Therefore practical guidelines for choosing the ‘best’ meta-analysis method(s) still lack.
Four meta-analysis methods corresponding to the three most common relative meta-analysis approaches (i.e. combining p-values, combining effect size and combining ranks) were applied to the selected MPM datasets using three R and Bioconductor packages (metaMA, GeneMeta and RankProd). In addition the preprocessed data from the three studies have been directly combined and analyzed using limma, including a study effect in the linear model. This approach can be viewed as an alternative meta-analysis method.
The different methods resulted in significant gene lists of different sizes. The highest number of DEGs was detected by the weighted inverse normal p-value combination method. This high proportion of significant genes may be due to the fact that p-value combination approaches are in general prone to be driven by
4-34
significant results of individual studies. This drawback may be partly reduced by the introduction of study-specific weights as demonstrated by Li and Ghosh [164]. On the other hand, effect size combination methods were found to be the most conservative. Taking into account the between-study heterogeneity, which is particularly evident in our data, they lead to a more reliable and perhaps more meaningful set of commonly DEGs. The RankProd approach identified an intermediate number of DEGs. Although it does not incorporate the between-study variability, it has been widely shown that gene rankings from the RankProd method are more robust against noise and other hidden variables embedded in different datasets [109]. Finally, limma analysis including a study effect in the linear model also appeared to be a valuable alternative for meta-analysis.
A poor overlap between the DEGs lists provided by each method was observed, both considering the complete lists and the top 500 most significant DEGs. The overlap increases when filtered data are considered indicating a possible beneficial effect of filtering on our data. The fact that a significant number of genes were only detected by one of the methods stems from the different assumptions and ranking criteria on which the various methods are based. Therefore, when doing meta-analysis on real data, it might be useful to select candidate genes using a combination of methods, so as to capture genes that are interesting from different aspects. In particular, DEGs detected by more than one meta-analysis method may be considered as the most reliable ones while DEGs identified by only one method may be further explored to enrich the knowledge of the biological phenomenon of interest.
4-35
Despite the poor overlap of the results at the gene-level, the pathway analysis showed a higher concordance between the different methods, in particular when the filtered data were considered.
The present meta-analysis and the final DEGs lists may have some potential value as regards MPM, since this is the first attempt to integrate microarray datasets in this area. However such genes lists should be taken with caution due to the limitations of this microarray meta-analysis, first of all the small number of studies included. Regarding meta-analysis methodology with microarray data, some limitations emerge from this work. The fact that several microarray studies share the same hypothesis would not be sufficient to successfully integrate results; such studies should use the same sample sources (biological equivalency of cases and controls across studies), similar sample processing protocols and the same microarray platform, with identical probes in the chips. Otherwise, the search for genes in common among platforms and the precision of data could reduce the power of individual studies instead of increasing it. Furthermore, if DEGs do not present large differences among the groups compared, the results of the meta-analyses could be strongly affected by experimental error and patient variability. Finally, the sensitivity of the results from meta-analysis should be tested before a final conclusion is reached. We could not perform any sensitivity analysis because of the small number of included studies and the lack of suitable packages/tools. In fact, the sensitivity analysis has so far been largely neglected in the meta-analysis of microarray data.