41
CHAPTER 4
The gold(III)-PADA system in aqueous solution
In this chapter are described the results of a kinetic study of the interaction of Au(III) with PADA in water. The study has been undertaken with the purpose of enlighten the mechanism of the gold(III)-PADA complexation reaction in aqueous solution.
4.1 Spectral observations
First, an attempt has been made to investigate the equilibria of the interaction of gold(III) with PADA using the static spectrophotometric method. For this purpose the spectral characteristics of each component of the reacting system and of their mixtures were investigated.
4.1.1 Spectra of the AuCl4−−−− complex
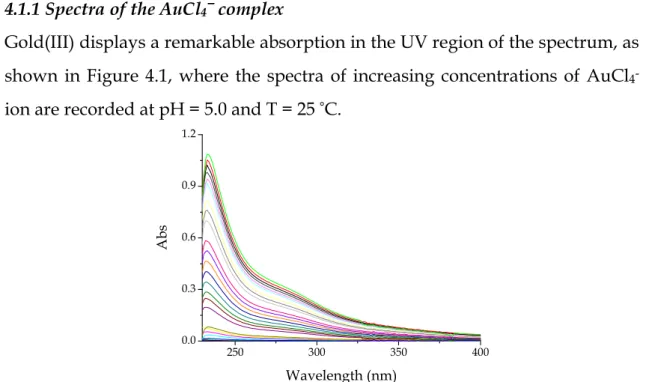
Gold(III) displays a remarkable absorption in the UV region of the spectrum, as shown in Figure 4.1, where the spectra of increasing concentrations of AuCl
4-ion are recorded at pH = 5.0 and T = 25 °C.
Figure 4.1 Spectra of different concentrations of gold(III) tetrachloroaurate up to
1.5
×
10-4 M recorded in aqueous solution at pH = 5.0 and T = 25 °C.250 300 350 400 0.0 0.3 0.6 0.9 1.2 A b s Wavelength (nm)
42
Note that the gold(III) chlorocomplex is transparent in the visible region, where the absorbance measurements will be performed.
4.1.2 Spectra of PADA
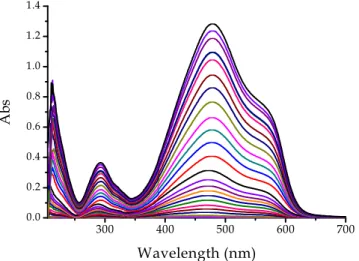
PADA presents well defined absorption bands both in the UV and in the visible regions, the absorption in the latter region being particularly strong, as shown in Figure 4.2. 300 400 500 600 700 0.0 0.2 0.4 0.6 0.8 1.0 1.2 1.4 A b s Wavelength (nm)
Figure 4.2 Spectra of PADA up to 3.0
×
10-5 M in aqueous solution at pH = 5.0 and T = 25 °C.The band between 350 and 650 nm is double since in addition to the species L, which prevails at pH 7 (see Chapter 3), the spectral contribution of the semi-protonated PADA, HL+, makes itself felt at pH 5.
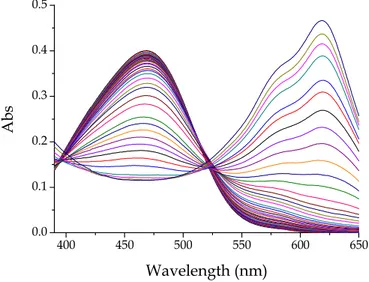
4.1.3 Spectra of mixtures of AuCl4- and PADA
The spectral changes induced by addition of increasing amounts of AuCl4−ion
to a PADA solution could be observed by comparing the spectra of Figures 4.1 and 4.2 with the spectra reported in Figure 4.3. This figure shows the spectral changes of PADA induced by the addition of increasing amounts AuCl4−. The
observations are limited to the visible region where the spectral variations are more conspicuous. The interaction of gold(III) with PADA is revealed by the
43 decrease of the PADA band centred (at pH = 6.5 ) at 470 nm and the outcome of a band centred at 620 nm ascribed to 1:1 Au/PADA complex.
400 450 500 550 600 650 0.0 0.1 0.2 0.3 0.4 0.5 A b s Wavelength (nm)
Figure 4.3 Spectral change recorded during a titration of PADA with gold(III); CAu from 0 M to 1
×
10-3 M, CPADA = 3×
10-5 M, [NaCl] = 0.03 M, pH = 6.5, T = 25°
C.However, it was found that on a long time scale (hours) the spectra do change. This fading effect has been attributed to the slow oxidation of the dye by Au(III) in aqueous solution. Despite the fading process is slow, nevertheless its occurrence does make impossible to obtain reliable thermodynamic results due to severe interference of metal reduction processes with the binding reaction when the measurements are prolonged for hours (a situation which occurs in titration experiments). The difficulty could be overcome by working under batch wise conditions, but this method presents the disadvantage of consuming both time and gold. Therefore, the static method, as a tool to study the binding equilibria, has been abandoned.
On the other hand, the kinetic method of analysis, allowing the reactants to stay together only for the time necessary to complete the binding process, makes it possible to simultaneously investigate the kinetic and the equilibrium characteristics of gold(III)-ligand interactions. Moreover, the kinetic method enables to detect (and eventually to cut off) spurious processes occurring at rates lower than those corresponding to binding reaction.
44
4.1.4 Spectral changes of gold(III) induced by chloride
The square planar complexes of noble metals are known to undergo hydrolysis even at relatively low pH values. It is, therefore, conceivable that the solutions of AuCl4−, under the acidity conditions employed in the present work, could be
in equilibrium with hydrolyzed species. The first of them is Au(OH)Cl3−, but at
higher pH values also more hydrolyzed species, as Au(OH)2Cl2− and
Au(OH)3Cl−,could be formed (see the predominance diagram of Au(III)-OH−
-Cl− species shown in Figure 1.2).
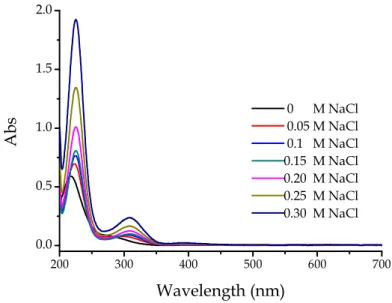
Figure 4.4 shows the results of an experiment performed at pH 4.8 where increasing amounts of NaCl are added to a solution containing gold(III) initially in the form of AuCl4−.
200 300 400 500 600 700 0.0 0.5 1.0 1.5 2.0 A b s Wavelength (nm) 0 M NaCl 0.05 M NaCl 0.1 M NaCl 0.15 M NaCl 0.20 M NaCl 0.25 M NaCl 0.30 M NaCl
Figure 4.4. Spectral changes of a gold(III) solution induced by the addition of
increasing amounts of chloride ion, CAu = 1
×
10-4 M, pH = 4.8, T = 25°
C.The spectrum of the gold(III) solution displayed a change for each addition of NaCl, revealing that the initial solution of AuCl4−had undergone hydrolysis, so
that an equilibrium between AuCl4−and Au(OH)Cl3− was already established
before the addition of NaCl and the effect of chloride addition was that of displacing the equilibrium in favour of the tetrachloro complex.
45
4.2 Kinetic study of the gold(III)-PADA system in aqueous solution
The kinetic measurements concerned with the binding reaction between gold(III) and PADA have been carried out in aqueous solution under pseudo first-order conditions using an excess of AuCl4−. The time course of the reaction
was found to embrace the time scale of minutes and, between pH 4.0 and 6.0, the curves are monophasic. The reaction has been investigated at pH values higher than 6.0 as well. Under these circumstances the kinetic behaviour is characterized by two phases, the first of them being rather fast, so that the kinetics were monitored by the stopped-flow method (see section 4.2.2). It should be also noticed that a further effect has been observed at much longer times (hours). As outlined in section 4.1, this effect has been ascribed to the dye fading induced by the oxidizing power of Au(III) and was not investigated.
4.2.1 Kinetic Experiments monitored by classical spectrophotometry (pH ≤ 6.0)
The reaction between gold(III) and PADA, in the pH range between 4.0 and 6.0 is sufficiently slow to be investigated using the classical spectrophotometric method. The experiments have been performed at 633 nm, under conditions of metal excess, CAu > 10CPADA. The concentration of PADA was the same in all
solutions (3×10⁻⁶ M), the concentration of Au(III) was changed between 3×10⁻⁵
M and 3×10⁻⁴ M. The pH of the solutions was kept constant at the desired
values using the CH3COOH/CH3COONa and the HCl/NaCacodylate buffer
systems.
Figure 4.5 shows a typical kinetic trace. The function representing the change of the signal (in this case the absorbance of the reacting system) with time is a single exponential function which corresponds mathematically to equation (4.1)
Abs = A
0+ A
1e
-t/τ (4.1)where A0 is the instrument offset, A1 is the amplitude and τ is the time constant
46 0 5 10 15 20 25 30 35 40 0.00 0.05 0.10 0.15 0.20 A b s Time (min)
Figure 4.5 Absorbance change with time of the gold(III)-PADA system in water;
CAu = 5
×
10-5 M, CPADA = 5×
10-6 M, [NaCl] = 0.04 M, pH = 5.0, λ = 633 nm, T = 25°
C.Rate dependence on the gold(III) concentration. Figure 4.6 shows a series of experiments where the concentration of AuCl4− has been changed, keeping
constant the concentration of the other reactants. The plot shows a linear dependence of the rate on the metal concentration, CAu. Such a dependence can
be represented by the relationship (4.2)
1/τ = k
fC
Au+ k
d (4.2)where kf (slope) and kd (intercept) are apparent rate constants of the binding
47 0.0 0.5 1.0 1.5 2.0 2.5 3.0 0.000 0.003 0.006 0.009 0.012 0.015 0.018 1/ τ ( s -1 ) 104CAu (M)
Figure 4.6 Plot of 1/τ vs. concentration of gold(III) in the kinetic analysis of the
gold(III)-PADA system; CPADA = 3
×
10−6 ÷ 5×
10−6 M, pH = 5.0, [NaCl] = 0.04 M, T = 25°
C.Two pieces of information can be obtained from the experiments analyzed according to the plot of Figure 4.6. First, the linearity of the plot reveals that the reaction is first-order in metal ion and, second, the value of the intercept, indistinguishable from zero, indicates that the binding process is quantitative. Hence, in the kinetic analysis, the contribution to 1/τ of the reverse step can be neglected.
Rate dependence on [H+]. The acidity dependences of kf and kd have been studied performing various series of experiments as those of Figure 4.6, each of them having been executed at a different value of [H+]. The results are reported in
48
Table 4.1 Kinetic constants of the gold(III)-PADA system measured at different values
of [H+]; [NaCl] = 0.04 M, T = 25
°
C. pH Kw/[OH−−−−] (M) kf (M−1 s−1) kd (s−1) 4.0 1.0×10⁻⁴ 72 ± 2 (5.4 ± 3.6)×10−4 4.5 3.2×10⁻⁵ 70 ± 1 (5.6 ± 1.9)×10−4 5.0 1.0×10⁻⁵ 57 ± 2 (1.1 ± 4.0)×10−4 5.5 3.2×10⁻⁶ 22 ± 1 (1.8 ± 1.7)×10−4 6.0 1.0×10−-6 7.3± 0.4 (1.9 ± 6.6)×10−5The Table shows that the values of kd are very small and very uncertain,
enabling us to neglect the reverse process at all the investigated acidity levels. The acidity dependence of the forward reaction constant, kf, is shown in
graphical form in Figure 4.7 for [NaCl] = 0.04 M. Note that the rate of binding increases with the acidity of the medium tending to a constant value for [H+] > 3×10⁻⁵ M. 0 2 4 6 8 10 0 10 20 30 40 50 60 70 80 k f (M -1 s - 1 ) 105 [H+] (M)
Figure 4.7 Plot of kf vs. concentration of H+ in the kinetic analysis of gold(III)-PADA complex formation; [NaCl] = 0.04 M, T = 25
°
C.49 Rate dependence on [Cl−]. The dependence of the reciprocal time constants of the gold(III)-PADA system on the chloride ion concentration has been studied at different pH values. Plots as that of Figure 4.6, worked out for each concentration of chloride investigated, provide the values of kf and kd reported
in Table 4.2.
Table 4.2 Forward (kf) and reverse (kd) rate constants of the gold(III)-PADA system in water for different Cl− and H+ concentration values.
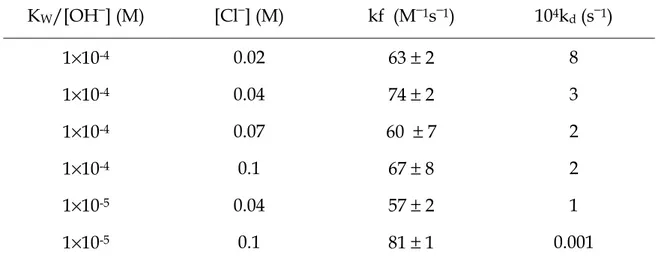
KW/[OH−] (M) [Cl−] (M) kf (M−1s−1) 104kd (s−1) 1×10⁻⁴ 0.02 63 ± 2 8 1×10⁻⁴ 0.04 74 ± 2 3 1×10⁻⁴ 0.07 60 ± 7 2 1×10⁻⁴ 0.1 67 ± 8 2 1×10⁻⁵ 0.04 57 ± 2 1 1×10⁻⁵ 0.1 81 ± 1 0.001
The Table shows, again, that the contribution of the reverse step, represented by kd, can be neglected at all the concentrations of NaCl investigated.
Moreover, it shows that the change of rate is negligible at [H+] = 10−4 M, but for
[H+] = 10−5 M, kf increases by increasing [Cl−].
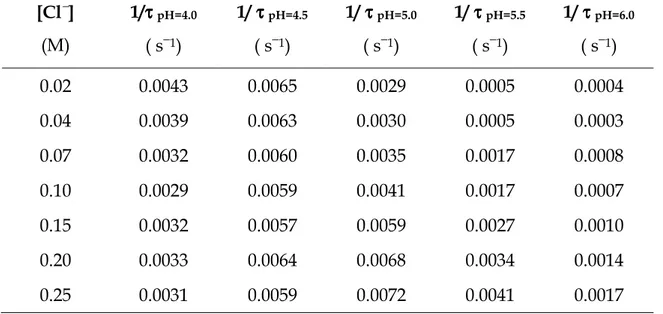
Table 4.3 displays an array of 1/τ values obtained by changing the medium pH and the [Cl−] concentration. One can observe that, at the lower pH values, the rate is almost independent on the chloride ion content, whereas at the highest pH values the rate tends to increase proportionally to the chloride concentration.
50
Table 4.3. Values of reciprocal time constants, 1/τ, of the gold(III)-PADA system in
aqueous solution at different Cl− and H+ concentrations. CAu = 5
×
10−5 M, CPADA = 5×
10−6 M, T = 25°
C. [Cl−] (M) 1/ττττpH=4.0 ( s−1) 1/ τ τ τ τpH=4.5 ( s−1) 1/ τ τ τ τpH=5.0 ( s−1) 1/ τ τ τ τpH=5.5 ( s−1) 1/ τ τ τ τpH=6.0 ( s−1) 0.02 0.0043 0.0065 0.0029 0.0005 0.0004 0.04 0.0039 0.0063 0.0030 0.0005 0.0003 0.07 0.0032 0.0060 0.0035 0.0017 0.0008 0.10 0.0029 0.0059 0.0041 0.0017 0.0007 0.15 0.0032 0.0057 0.0059 0.0027 0.0010 0.20 0.0033 0.0064 0.0068 0.0034 0.0014 0.25 0.0031 0.0059 0.0072 0.0041 0.0017The reaction mechanism at pH
≤
6.0. The analysis of the whole behaviour of the gold(III)-PADA system has allowed to rationalize the binding mode of the system for pH values equal or less than 6.0.As shown by the dependence of the time constant 1/τ on the Au(III) concentration, the reverse reaction of the binding process can be neglected. Moreover, the dependence of the reaction rate on both [Cl−] and [H+] ions
reveals that under the conditions of the experiments more than a single gold(III) species takes part, directly or indirectly, to the binding process. The gold(III) species present in noticeable amounts within the range of the investigated acid and chloride concentrations are AuCl4− and Au(OH)3Cl−, in
equilibrium within themselves. The reaction scheme which accounts in the simplest way for the kinetic behaviour is represented by the reaction scheme (4.3) and (4.4).
51
Au(OH)Cl3− + Cl− K AuCl4−+ OH− (4.3)
(4.4)
where reaction (4.3) is assumed to be fast with respect to reaction (4.4). The rate equation corresponding to the reaction scheme (4.3) and (4.4) can be expressed as the decrease of dye concentration with time (equation 4.5). The dye is here denoted as L-L to point out that each of the two reaction sites of PADA binds to Au(III) forming e chelate as the final product.
-d[L-L]/dt = k
1×
[AuCl
4−]
×
[L-L]
(4.5)and the time constant derived from the above equation depends on the reactant concentration according to equation 4.6 (Appendix II ).
] OH [ ] Cl [ K ] Cl [ C Kk s τ 1 1 Au − − − + = (4.6)
where K = [AuCl4−][OH−]/[Au(OH)3Cl−][ Cl−] is the equilibrium constant of the
reaction (4.3). Equation 4.6 clearly shows that 1/τs is directly proportional to the
gold(III) concentration, CAu, as shown by the plot of Figure 4.6. It also indicates
that, for K×[Cl−]>>[OH−], the values of 1/τs tend to be independent of the
chloride concentration, as shown by the data of Table 4.3 for pH values less than 5.0. On the other hand, under the condition K×[Cl−] << [OH−], the time constant tends to increase linearly with [Cl−].
The array of data of Table 4.3 has been analyzed according to equation (4.6) by means of a non-linear least square treatment. The obtained reaction parameters are k1 = 633 ± 49 M−1s−1 and K = (3.3 ± 1.1)×10−8. The graphic representation of
the experimental data and the calculated surface is shown in Figure 4.8. The value of K derived from kinetics agrees with the value of 1.3×10⁻⁸ M derived
from the value reported by Baes and Mesmer (1976). This finding validates the
AuCl2+ + 2Cl−
k1 L
L
52 0 0.05 0.1 0.15 0.2 x = [C l] 0 2e-09 4e-09 6e-09 8e-09 y = [OH] 0 0 0.1 0.1 0.2 0.2 0.3 0.3 0.4 0.4 z = 1 /t a u z = 1 /t a u
proposed reaction scheme and demonstrates the usefulness of the kinetic method for the analysis of equilibria in solution.
Figure 4.8 Graphical representation of the non-linear least square analysis of the kinetic
behaviour of the gold(III)-PADA system at pH ≤ 6.0; CAu = 5
×
10−5 M, CPADA = 5×
10−6 M. The blue surface represents the calculated 1/τ
values (min−1) for any [Cl−] and pH value.4.2.2 Kinetic experiments monitored by the stopped-flow method (pH > 6 )
When the pH of the medium is raised to values higher than 6.0 the kinetic behaviour displays a change in the sense a fast effect is observed whose analysis requires the use of the stopped-flow method (Figure 4.9).
0.0 0.5 1.0 1.5 -0.06 -0.05 -0.04 -0.03 -0.02 -0.01 S ig n al ( V ) Time (sec)
Figure 4.9 The fast effect for the gold(III)-PADA system in aqueous solution revealed
by a stopped-flow experiment; CAu = 5
×
10−5 M, CPADA = 7.5×
10−6 M, [NaCl] = 0.03 M, pH = 6.5, λ = 629 nm, T = 25°
C.53 This effect is completed in a few tenth of a second and it is out of doubt that the fast effect reveals further aspects of the binding process. Actually, the time constant of this process (obtained by mono exponential fits to curves as that of Figure 4.9) displays a dependence on the gold(III) concentration which indicates that the fast process as well is associated to the interaction of PADA with Au(III), of which it represents a different aspect undetected at pH values less than 6.0. The fast effect is followed by a slower one which generates a very stable complex.
Dependence of the rate of reaction on the gold(III) concentration. The reciprocal relaxation time of the fast effect has been plotted as a function of CAu (Figure
4.10). The behaviour observed is linear, indicating that the reaction in the forward direction involves one molecule of gold(III). The positive value of the intercept reveals that in this case the binding process does not go to completion. Actually, the intercept value provides a measure of the contribution of the reverse step to the overall kinetic process.
2 4 6 8 10 0 5 10 15 20 25 30 1/ τ f (s -1 ) 10 5 CAu (M)
Figure 4.10 Dependence of the reciprocal time constant, 1/τf, of the fast effect on gold(III) concentration for the gold(III)-PADA system in aqueous solution; CPADA = 2
×
10−6 ÷ 7.5×
10−6 M, [NaCl] = 0.03 M, pH = 6.5, T = 25°
C.54
Dependence of the reaction rate on the Cl− concentration. To study the effect of chloride on the kinetics of binding of PADA to AuCl4−, the reaction rates have
been measured by mixing AuCl4− and PADA solutions, in constant
concentration ratio, and changing the level of NaCl present. The results are reported in graphical form in Figure 4.11, which shows that the reaction rate depends parabolically on the chloride concentration.
0.00 0.05 0.10 0.15 0.20 0.25 20 40 60 80 100 120 1 / τ f (s -1 ) [NaCl] (M)
Figure 4.11 Plot of the reciprocal time constant, 1/
τ
f, of the fast effect on [Cl−] for the gold(III)-PADA complexation reaction in aqueous solution at a relatively high pH value; CAu = 5×
10−5 M, CPADA = 5×
10−6 M, pH = 6.5, T = 25°
C. The continous line has been calculated using equation 4.9.Also, an attempt was made to measure the dependence of the rate of dissociation of the gold(III)-PADA complex (preformed in one of the syringes of the stopped-flow apparatus) on [Cl−], but the reaction resulted to be too slow to be measured, indicating once again that the complex formed by the slow reaction with PADA is very strong. We believe that this complex is that obtained at pH values lower than 6.0.
Dependence of the Reaction Rate on the H+ concentration. The rate of complex formation between gold (III) and PADA has been investigated at different acidity values. Actually, a rate dependence on the medium acidity is to be
55 expected if differently oxydrylated forms of the metal can react with PADA. The obtained results are shown in Figure 4.12. Surprisingly, the reaction rate does not appear to significantly depend on the hydrogen ion concentration.
0 2 4 6 8 10 0 10 20 30 40 50 60 1/ τ f (s -1 ) 107KW/[OH−] (M)
Figure 4.12 Plot of the reciprocal time constant, 1/
τ
f, of the fast effect on [H+] for the gold(III)-PADA complexation reaction in aqueous solution; CAu = 5×
10−5 M, CPADA = 5×
10−6 M, [NaCl] = 0.03 M, T = 25°
C.For pH values higher than 6.0 the picture of the equilibria changes in the sense that the prevailing species becomes Au(OH)3Cl−, eventually in equilibrium with
a small amount of Au(OH)2Cl2− ions.
The results provided by the kinetic study of the fast effect can be explained on the basis of the reaction scheme (4.7) and (4.8) making the (reasonable) assumption that the species Au(OH)3Cl−, which tends to prevail at relatively
high pH values, becomes the reactive species.
(4.7) (4.8) Cl- + Au(OH) 3Cl- Au(OH)2Cl2- + OH -K' Au(OH)2Cl2- +L L Au(OH)2+ + 2ClL -L k2 k-2
56
According to reaction scheme (4.7) and (4.8), the expression of 1/τf is given by
equation (4.9). 2 2 Au 2 k [Cl ] ] OH [ ] Cl [ K ] OH [ C k f τ 1 − − − − − + + ′ = (4.9)
which would indicate a linear dependence of 1/τf on [OH−] provided that
K’[Cl−] >> [OH−]. However, in the present case the reverse is true: being K’ = 1.3x10⁻⁷ (Baes and Mesmer, 1976), it turns out that, under the employed
reactant concentrations, the inequality K’[Cl−] << [OH−] holds and, by consequence, 1/τf becomes independent on [OH−] and increases parabolically
with [Cl−], as shown by the data of Figures 4.11 and 4.12.

![Figure 4.6 Plot of 1/τ vs. concentration of gold(III) in the kinetic analysis of the gold(III)-PADA system; C PADA = 3 × 10 − 6 ÷ 5 × 10 − 6 M, pH = 5.0, [NaCl] = 0.04 M, T = 25 ° C](https://thumb-eu.123doks.com/thumbv2/123dokorg/7554695.109756/7.892.269.655.123.406/figure-plot-concentration-kinetic-analysis-pada-pada-nacl.webp)
![Figure 4.7 Plot of k f vs. concentration of H + in the kinetic analysis of gold(III)-PADA complex formation; [NaCl] = 0.04 M, T = 25 ° C](https://thumb-eu.123doks.com/thumbv2/123dokorg/7554695.109756/8.892.240.646.701.1011/figure-plot-concentration-kinetic-analysis-complex-formation-nacl.webp)