CHAPTER 4
METHOD
This chapter deals with the methodology of the current dissertation. First, the characteristics of participants in the study and subject selection are described. This is followed by a presentation of the task materials designed to elicit subject data and of the procedures adopted to carry out data collection. Finally, the analysis of data, specifically data screening which determined the use of nonparametric tests, is reported.
4.1. Subjects
The sample of subjects in this dissertation belongs to a study on the role of age as a factor in foreign language acquisition – BAF project – conducted between 1995 and 2004 at the Departament de Filologia Anglesa i Alemanya of the Universitat de Barcelona.
That study looks at the effects of age of onset of FL learning50 on the acquisition of English in a formal learning context (namely, a school setting) by bilingual Spanish-Catalan speakers. Both written and oral tasks were administered to learners of various ages who attended state primary and secondary schools in the metropolitan area of Barcelona or adult language schools in the same city. A total of 29 different centres took part in this study. Due to the large number of participating centres, the variable of teacher (i.e. teachers’ training and teaching methods) was considered to have been balanced out.
Written tests were administered to intact groups, but only those subjects who met the following requirements were considered valid for the study. First, they should not have been exposed to English either before the starting age established by their corresponding curriculum or in parallel with school instruction. Second, subjects’ stays in an
50 The terms “age of onset of FL learning”, “onset age of FL learning”, “starting age (of FL learning)”, “age
of FL learning”, and “age of first exposure (to the FL)” will be used interchangeably in this dissertation, referring to the chronological age at which subjects started to learn English as an FL in school settings (see also footnote 1 in Section 2.2). When shortened, the abbreviation AOL (age of learning) will be used in accordance with the existing literature on L2 phonological acquisition (e.g. Flege & Fletcher, 1992, p. 370).
speaking country, if any, should have been shorter than a month51 and should not have consisted of a language course of any length. These two conditions were determined by means of a questionnaire that participants filled out at the beginning of data collection. Those who fulfilled the two conditions to perform the oral tasks constitute the sample that was studied in this dissertation. To be exact, a total of 323 subjects (135 male and 188 female) participated in the oral tasks. At the time of writing they make up 17.24% of the subjects from the larger study alluded to above.
Subjects were classified into different learner groups according to the two main variables in the design of the study: onset age of foreign language learning and amount of formal exposure to English in school settings only, measured in hours.
As for starting age of FL learning, there were four age groups: Group A, Group B, Group C, and Group D. Subjects in Group A had started to learn English at the age of 8; those in Group B had begun at the age of 11; learners in Group C were 14 years old when they were exposed to the TL for the first time; and, finally, Group D consisted of adult learners whose initial contact with English took place at the age of 18 or later.
Starting age 11 of foreign language learning corresponds to the former curriculum in the Spanish educational system that was applicable from 1970 to 2000 – grade 6 in Educación General Básica (E.G.B); whereas 8 years old is the current age at which students start learning a foreign language in the new curriculum – grade 3 in Primary Education (Primaria). Thus, the co-existence of the former and new curricula for a period of 8 years (1992-2000) made it convenient for testing the research questions that are concerned with the effect of starting age of learning on the acquisition of an FL. Starting age 14 of FL learning corresponds either to the former curriculum – grade 1 in Bachillerato Unificado Polivante (B.U.P.) – or to the new curriculum. However, in this case, starting age 14 refers to the learning of English as an FL specifically, since students had taken French or another FL in the period comprised between the ages of 11 and 14. In other words, students in Group C were first exposed to an FL in a school setting at the age of 11, like subjects in Group B, but their age of first exposure to English in an instructional setting was 14 years old. Adults who took a language other than English throughout their schooling – an option also available in the former curriculum – or adults who studied at the time when French was the only foreign language taught at school, make up the group whose starting age was 18 years or later.
In relation to the amount of formal exposure to the target language, there were three points or times at which data were collected: Time 1 with 200 hours of formal exposure to the FL, which were attained after a two-year period52 of instruction in the former curriculum and a three-year period in the new curriculum; Time 2 with an exposure amounting to 416 hours, which were achieved 2 years later after the first data collection in both curricula; and Time 3 with an exposure of 726 hours, which resulted from an additional and-a-half-year period of instruction in the new curriculum, and a three-year period in the former curriculum. The latter coincided then with the final three-year of secondary education and was a preparatory course for university.
The combination of these two variables resulted in the following 11 learner groups (Table 4.1 below summarises the characteristics of participant groups).
Group A – Time 1 (henceforth A1) consisted of 42 subjects who had begun to learn English at the age of 8 in grade 3 (Primary Education). At the time of testing they had had 200 hours of formal exposure to English. Data were collected in the academic year 1995-1996 when subjects were in grade 5 (Primary Education) and their mean age was 10.93 years.
Group A – Time 2 (A2) comprised 52 subjects who were first exposed to English in the school setting at the age of 8, like A1. At the time of testing in the academic year 1997-1998 they had had 216 hours more exposure than A1, that is, 416 hours. They were in grade 1 (Compulsory Secondary Education – E.S.O.) and they were 12.97 years old on average.
Group A – Time 3 (A3) was comprised of 33 subjects with a total amount of 726 hours of formal exposure to English, and with the same starting age as A1 and A2. They were 16.57 years old and in grade 1 (Baccalaureate in the new curriculum – Bachillerato) when they carried out the tasks in the academic year 2001-2002.
Group B – Time 1 (B1) was composed of 31 subjects in grade 7 (E.G.B. in the former curriculum). They had begun learning English at the age of 11 and had 200 hours of exposure to the TL. They were tested in the academic year 1995-1996 when they were 13.03 years old on average.
Group B – Time 2 (B2) consisted of 33 15-year-old subjects with the same starting age of FL learning as B1 and with an extra exposure of 216 hours (making up 416 hours). They were in grade 1 (B.U.P. in the former curriculum) at the time of testing in the academic year 1997-1998 and their mean age was 15.02 years.
Group B – Time 3 (B3) was made up of 40 participants who carried out the tasks in the academic year 1996-1997 when they were 17.95 years old on average. Like B1 and B2, they started to learn English at the age of 11, and at the time of data collection they had reached 726 hours of exposure to the FL and they were in C.O.U. (preparatory course for university in the former curriculum).
Group C – Time 1 (C1) consisted of 22 subjects who started to learn English at the age of 14. At first, only learners within the former curriculum were asked to participate. Thus, they were in grade 2 (B.U.P.) when their exposure to English amounted to 200 hours. However, due to the scarcity of 14-year-old starters “valid” for the purposes of this study, in addition to the fact that the former curriculum was approaching its end, it was necessary to resort to learners who were studying English within the new curriculum as well. In that case, learners were either in grade 3 or grade 4 (Compulsory Secondary Education in the new curriculum) when they had received 200 hours of formal exposure to the TL. For the sake of simplicity, all subjects belonging to C1 will be placed in grade 2 (B.U.P in the former curriculum). C1 subjects’ average age was 16.07 years at testing. Data collection took place over a couple of academic years, 1996-1997 and 1998-1999, depending on whether learners belonged to the former or to the new curriculum.
Group C – Time 2 (C2) contained 7 subjects only. They had had 416 hours of formal instruction in English when they participated in the study. Like B3, they were in C.O.U. (preparatory year for university) and on average they were 18.70 years old at the time of testing in the academic year 1996-1997. There was no Time 3 for Group C, as after 416 hours of instruction subjects were already in their final year of secondary education.
Group D – Time 1 (D1) was comprised of 49 adult learners who were first exposed to English at the age of 18 or later. Data collection took place over three academic years: 1998-1999, 1999-2000, and 2001-2002. In all cases subjects had been formally exposed to English for 200 hours. They were in grade 2 (language school) and their mean age was 28.74 years.
Group D – Time 2 (D2) consisted of 10 adult subjects who were in grade 4 (language school) in the academic year 2001-2002 when data were collected. They were 27.55 years old on average and they had had 416 hours of formal instruction in English since their beginning of English learning at age 18 or older.
Group D – Time 3 (D3) was composed of 4 adult subjects who had been exposed to English for 726 hours in language schools after their start at age 18 at the earliest. Their
average age was 37.68 years and they participated in the study in the academic year 2001-2002 when they were in Grade 5 or 6 of their language school.
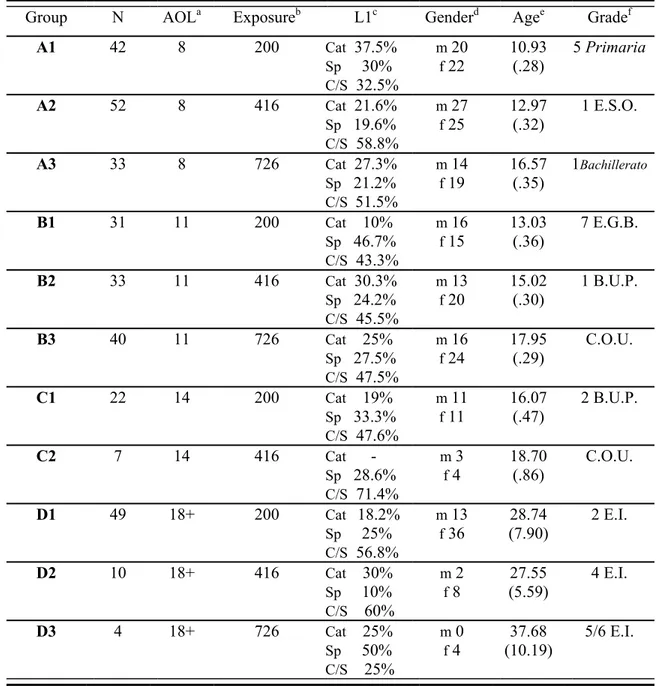
Table 4.1. Characteristics of groups in the study (includes both longitudinal and
cross-sectional data). Standard deviations are in parentheses.
Group N AOLa Exposureb L1c Genderd Agee Gradef
A1 42 8 200 Cat 37.5% Sp 30% C/S 32.5% m 20 f 22 10.93 (.28) 5 Primaria A2 52 8 416 Cat 21.6% Sp 19.6% C/S 58.8% m 27 f 25 12.97 (.32) 1 E.S.O. A3 33 8 726 Cat 27.3% Sp 21.2% C/S 51.5% m 14 f 19 16.57 (.35) 1Bachillerato B1 31 11 200 Cat 10% Sp 46.7% C/S 43.3% m 16 f 15 13.03 (.36) 7 E.G.B. B2 33 11 416 Cat 30.3% Sp 24.2% C/S 45.5% m 13 f 20 15.02 (.30) 1 B.U.P. B3 40 11 726 Cat 25% Sp 27.5% C/S 47.5% m 16 f 24 17.95 (.29) C.O.U. C1 22 14 200 Cat 19% Sp 33.3% C/S 47.6% m 11 f 11 16.07 (.47) 2 B.U.P. C2 7 14 416 Cat - Sp 28.6% C/S 71.4% m 3 f 4 18.70 (.86) C.O.U. D1 49 18+ 200 Cat 18.2% Sp 25% C/S 56.8% m 13 f 36 28.74 (7.90) 2 E.I. D2 10 18+ 416 Cat 30% Sp 10% C/S 60% m 2 f 8 27.55 (5.59) 4 E.I. D3 4 18+ 726 Cat 25% Sp 50% C/S 25% m 0 f 4 37.68 (10.19) 5/6 E.I.
a Age of learning = Onset age of FL learning (in years) b Number of hours of formal exposure to English
c Dominant L1(s) (%): Cat (Catalan), Sp (Spanish), C/S (Catalan and Spanish) d m: male, f: female
e Mean chronological age at testing (in years) f Subjects’schoolgrade at testing:
Primaria, E.S.O., and Bachillerato (new curriculum)
E.G.B., B.U.P., and C.O.U. (former curriculum) E.I. (Escuela de Idiomas) – (adult) language schools
Other pieces of relevant information about subjects, such as strategies used to learn different aspects of the FL and their dominant L1(s), were provided by the questionnaire mentioned above. As for the dominant L1(s), based on the language(s) subjects spoke with their close family – that is, father, mother, and siblings – and others, such as relatives and friends, it was inferred that they had either Spanish (85 Ss, 27.2%) or Catalan (74 Ss, 23.6%) as their dominant L1, or both Spanish and Catalan (154 Ss, 49.2%) as their dominant L153. However, it should be noted that in all cases participants were exposed to both languages to a certain extent through the media, school54, and in everyday life, since they lived in Catalonia.
A final comment about subjects’ characteristics has to do with longitudinal and cross-sectional data. Originally, the study was designed to have both types of data. When any data collection was in progress, an attempt was made to have the valid subjects for the research at Time 1 do the tests again at Times 2 and 3. However, after the first data collection had been carried out, there were many instances of attrition due to several reasons. The first reason had to do with the fact that over the years some subjects who had initially been exposed to English solely in the school setting had taken extracurricular courses in English, thus making them ineligible to carry out the oral tasks. In the second place, it was not always possible to follow the subjects’ school itinerary once they had completed a specific cycle (e.g. Primary Education) and then moved to another centre to continue with their studies. In other cases, certain subjects who had done the oral tasks at Time 1 could be recruited at Time 3, but data when they had 416 hours of formal exposure (Time 2) could not be collected. And, in other instances, subjects who were tested after 416 hours of instruction in English could also be tested after 726 hours (but they had not been recruited at Time 1 with 200 hours of exposure). In the end, the same 27 Ss could be re-tested at two or three different times. In other words, 8.35% of the total population examined in this study was longitudinal (see Table 4.2 for characteristics of longitudinal subjects).
At the same time, cross-sectional data were gathered at all three data collections. So, new participants were included at Times 2 and 3. And in the case of group B3, all subjects were cross-sectional, since data collection was carried out before subjects in B1 or B2 had
53 Information concerning the dominant L1(s) of 10 subjects is missing. Those subjects either did not fill out
the questionnaire – that is, they were not present in class the first day of test administration – or they did not answer that question.
54 Schools in Catalonia have Catalan and Spanish as language subjects, but only Catalan is the language of
reached 726 hours of exposure to the FL. The reason for this is that by the time they had reached that amount of exposure, the former curriculum would have ended, and so C.O.U. would no longer exist.
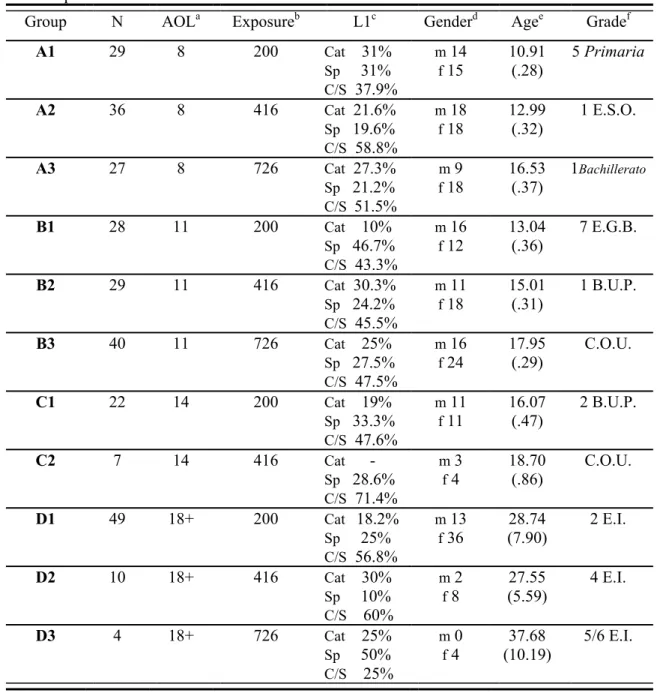
As a result, the study followed a mixed design of longitudinal and cross-sectional data, which has important implications as far as statistical analyses and results are concerned. So, in order to deal with the mixed design of the study, a new data matrix was created that only consisted of cross-sectional data (see Table 4.3 below). An attempt was made to keep group sizes as similar as possible to their corresponding original subject group (as shown in Table 4.1 above) by adopting the following criterion: a different third of longitudinal subjects in Group A was randomly kept at each Time 1, Time 2, and Time 3, while the remaining two thirds were discarded accordingly. For Group B, half the number of longitudinal subjects was randomly deleted at Time 1, and the other half at Time 2. The resulting characteristics of subjects in the cross-sectional matrix are presented in Table 4.3. Subjects from this table are the final data used in statistical analyses involving cross-sectional subjects.
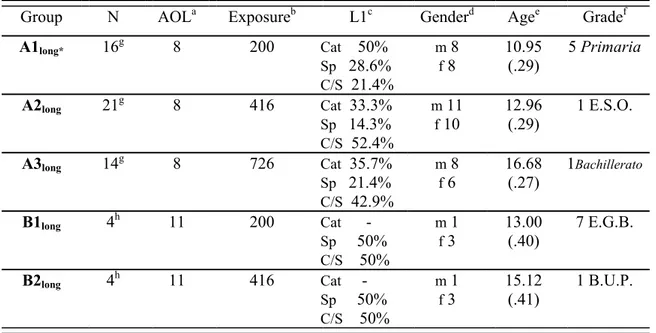
Table 4.2. Characteristics of longitudinal subjects in the study. Standard deviations are in
parentheses.
Group N AOLa Exposureb L1c Genderd Agee Gradef
A1long* 16g 8 200 Cat 50% Sp 28.6% C/S 21.4% m 8 f 8 10.95 (.29) 5 Primaria A2long 21g 8 416 Cat 33.3% Sp 14.3% C/S 52.4% m 11 f 10 12.96 (.29) 1 E.S.O. A3long 14g 8 726 Cat 35.7% Sp 21.4% C/S 42.9% m 8 f 6 16.68 (.27) 1Bachillerato B1long 4h 11 200 Cat - Sp 50% C/S 50% m 1 f 3 13.00 (.40) 7 E.G.B. B2long 4h 11 416 Cat - Sp 50% C/S 50% m 1 f 3 15.12 (.41) 1 B.U.P.
*longLongitudinal group a Age of learning = Onset age of FL learning (in years) b Number of hours of formal exposure to English
c Dominant L1(s) (%): Cat (Catalan), Sp (Spanish), C/S (Catalan and Spanish) d m: male, f: female e Mean chronological age at testing (in years)
f Subjects’schoolgrade at testing: Primaria, E.S.O., and Bachillerato (new curriculum)
E.G.B. and B.U.P. (former curriculum)
g Distribution of longitudinal subjects (8-year-old beginners):
9 Ss at T1 + T2 7 Ss at T2 + T3 2 Ss at T1 + T3 5 Ss at T1 + T2 + T3
Table 4.3. Characteristics of cross-sectional subjects in the study. Standard deviations are in
parentheses.
Group N AOLa Exposureb L1c Genderd Agee Gradef
A1 29 8 200 Cat 31% Sp 31% C/S 37.9% m 14 f 15 10.91 (.28) 5 Primaria A2 36 8 416 Cat 21.6% Sp 19.6% C/S 58.8% m 18 f 18 12.99 (.32) 1 E.S.O. A3 27 8 726 Cat 27.3% Sp 21.2% C/S 51.5% m 9 f 18 16.53 (.37) 1Bachillerato B1 28 11 200 Cat 10% Sp 46.7% C/S 43.3% m 16 f 12 13.04 (.36) 7 E.G.B. B2 29 11 416 Cat 30.3% Sp 24.2% C/S 45.5% m 11 f 18 15.01 (.31) 1 B.U.P. B3 40 11 726 Cat 25% Sp 27.5% C/S 47.5% m 16 f 24 17.95 (.29) C.O.U. C1 22 14 200 Cat 19% Sp 33.3% C/S 47.6% m 11 f 11 16.07 (.47) 2 B.U.P. C2 7 14 416 Cat - Sp 28.6% C/S 71.4% m 3 f 4 18.70 (.86) C.O.U. D1 49 18+ 200 Cat 18.2% Sp 25% C/S 56.8% m 13 f 36 28.74 (7.90) 2 E.I. D2 10 18+ 416 Cat 30% Sp 10% C/S 60% m 2 f 8 27.55 (5.59) 4 E.I. D3 4 18+ 726 Cat 25% Sp 50% C/S 25% m 0 f 4 37.68 (10.19) 5/6 E.I.
a Age of learning = Onset age of FL learning (in years) b Number of hours of formal exposure to English
c Dominant L1(s) (%): Cat (Catalan), Sp (Spanish), C/S (Catalan and Spanish) d m: male, f: female
e Mean chronological age at testing (in years) f Subjects’ school grade at testing:
Primaria, E.S.O., and Bachillerato (new curriculum)
E.G.B., B.U.P., and C.O.U. (former curriculum) E.I. (Escuela de Idiomas) – (adult) language schools
4.2. Speech materials
In an attempt to provide answers to the research questions outlined in Chapter 3, two phonetic tasks were designed, namely an auditory discrimination task, which examined subjects’ perception of English sounds, and an imitation task, which looked at learner groups’ English segmental production.
The perceptual task was a same-different (AX) or 2IAX discrimination task (Beddor & Gottfried, 1995). It consisted of 20 tape-recorded pairs of words produced by a female native speaker of Standard British English, in which the second word in each pair could be either the same as or different from the first word presented in the pair. Thirteen different word pairs were minimal pairs, that is, the two words of a pair differed in one sound only; and the remaining 7 pairs were distractors55 that consisted of pairs of the same word repeated twice (see Appendix A for the taped instructions given to subjects and the pairs that make up the auditory discrimination task).
As for the minimal pairs, 8 pairs contained vowel contrasts and 5 pairs focused on consonant contrasts. The majority of these sound contrasts looked at features of the English sound system that have been reported to be difficult or problematic for Spanish and/or Catalan learners of English when it comes to their successful perceptual discrimination, such as the tense/lax vowel contrast and word-final consonant voicing (e.g. Cebrian, 2000, 2002c; Coe, 1987; Escudero, 2002; Flege, 1991a; Kenworthy, 1990; Recasens, 1984).
Therefore, consistent with much research conducted on NSs of Romance languages learning English as an L2 or FL (see section 2.3.2), the majority of vowel contrasts in the AX task involved English front vowels. More precisely, two pairs tested for the tense/lax distinctive feature of English /i/-//. In addition, two pairs contained English //-/æ/ contrast, also frequently examined in L2 phonological acquisition studies. The last pair involving front vowels looked at English //-// contrast. Moreover, three pairs had instances of back and central vowels – that is, //-// (one pair) and //-// (two pairs) –
55 Among the 7 distractors, the pair boot-book is a false distractor, as each word in the pair has two different
sounds, /ut/ vs. /k/, while it should have been the same word said twice. In fact, that pair was originally included to test learners on their discrimination of the distinctive feature of vowel tenseness in English /u/-//. However, the presence of two other different sounds, /t/-/k/, had been overlooked at first. Data for groups A1, B1, and B3 had already been collected when this error was noticed by the present researcher. Changes in the task (and its following administration to other learner groups) would have questioned the validity of results when comparisons across groups were to be made, so none of the 20 pairs was modified. Therefore, the pair containing such distinction was considered a distractor when performing statistical analyses, and, unfortunately, the subjects’ auditory discrimination skills for /u/-// could not be studied.
which have been investigated less often, as was noted above (e.g. Flege, Munro, & Fox, 1994; Rallo, 2005).
The consonant contrasts included one of each of the following: /b/-/v/ in word-initial position; /t/-/d/, /p/-/b/, and /s/-/z/ in word-final position; and //-/d/ in intervocalic position. Neither Spanish nor Catalan has voicing distinction in word-final position. As mentioned in 2.3.2, in the case of Catalan voiced plosives become neutralised (Cebrian, 2000; Recasens, 1984, 1993), while in Spanish they might be devoiced, fricativised, or deleted (Flege & Davidian, 1984). Devoicing of voiced consonants other than stops in word-final position is also a phonetic feature of Catalan. Thus, the consonant contrasts in the AX were for the most part concerned with the feature of consonant voicing in word-final position, which is also in agreement with the focus of previous studies (see 2.3.2 above). Besides, two word pairs included English //, /d/, and /z/, which do not occur in Spanish. Conversely, these sounds are present in the phonetic inventory of Catalan, although they do not appear word-finally as is the case of English. Finally, one pair looked at /b/-/v/ distinction, which was hypothesised to pose a problem for all language dominance groups, for English /v/ is realised as [b] in Spanish and in most varieties of Catalan (such as that of the subjects in the present dissertation).
The imitation task consisted of repeating a list of 34 English words presented in isolation by the same female taped model voice as in the AX discrimination task. Words were chosen as containing sounds and clusters of sounds that do not exist in the Spanish and Catalan phonetic inventories, and thus likely to be difficult for learners to produce. Examples included vowels // and //; consonant clusters in word-initial position such as /str-/, /sp-/, and /sk-/; and consonant clusters in word-final position like /-mz/, /-nz/, and /-sts/). Other words were selected on the basis of containing non-existent similar sounds in one first language but not in the other, for instance, //, /d/, and /z/ not found in Spanish as phonemes, but existent in Catalan; and // present in Spanish but not in Catalan (see Appendix B for the imitation task subjects performed).
Last, it should be mentioned that the words chosen for both tasks were not necessarily among the most frequent used words in English. Subjects’ lexical familiarity with all the words included in the tasks was not tested, either.
4.3. Procedure
The AX task and imitation task were part of a battery of oral tasks that the subjects performed. Usually the oral session developed in the following way. First, subjects were interviewed in English by one member of the research project. Second, subjects were asked to tell a story in English after having looked at six related vignettes. Next, they went on to do the auditory discrimination and imitation tasks. Last, they role-played two situations in pairs. The whole oral session lasted 30 minutes approximately, within which the time devoted to administering the phonetic tasks remained unchanged (6 minutes in total).
For the phonetic tasks, subjects listened to a recording of the auditory discrimination task and the imitation task on a tape recorder. The interviewer explained the delivery of each task to participants in English, and, if there were some doubts on the subject’s part, the instructions were translated into Spanish and/or Catalan. As for the auditory discrimination task (or perception test), subjects were told that they would hear pairs of words and they had to say whether the words were “the same”, if they thought the pair had just one word repeated twice; or “different”, if they heard the words as containing one sound different from each other. For pairs differing in one sound, instructions given to subjects did not specify that the two differing sounds in question could be either vowels or consonants. They were further told that the response time between each pair presentation would be very brief, although they were not informed of the exact inter-trial interval (ITI), i.e. 1.5 seconds. The total duration of the task was 1 minute and 30 seconds. As soon as it was finished, subjects proceeded to perform the imitation task. They were asked to repeat a series of words that they would hear via tape recorder again – each word was imitated immediately after being produced by the taped model voice. Subjects did not repeat the words within a carrier phrase or by following a delayed imitation technique, rather they produced the words in isolation, as presented on the tape. Subjects were told that the response time would be brief, as well, but they were not explicitly informed of the 3-second interval between two stimuli. The imitation task lasted 2 minutes.
The two tasks and their stimulus presentation were in the same fixed order for all participants. In both cases subjects were not provided with any practice or training beforehand and they did each task only once. In case they did not give an answer to a pair in the auditory discrimination task or they missed imitating one word in the production task, they had to continue with the task (no re-play was allowed).
Subjects’ imitations of English words and responses to the perception test were recorded by means of SONY tape-recorders Models TCM-313, TCM-459, and TCM-939 on school premises56.
4.4. Analyses
Learner groups’ performance on the AX task and imitation task was analysed with the Statistical Package for Social Sciences SPSS version 11.0 for Windows. The description and explanation of specific analyses carried out for each task and their respective results will be presented in separate sections as follows, starting with cross-sectional subjects’ performance on the auditory discrimination task.
4.4.1. Auditory discrimination task
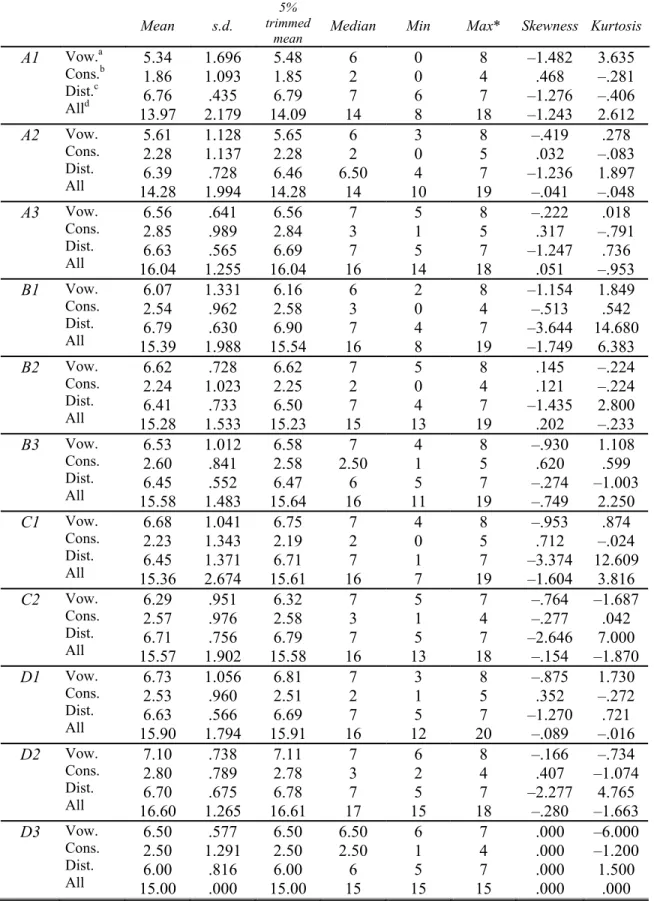
A total of 5,620 discriminations57 (281 cross-sectional subjects x 20 word pairs) was first examined for normality, missing cases, and outliers. Measures of central tendency and dispersion, kurtosis and skew statistics, as well as Kolmogorov-Smirnov tests of normality were calculated. As shown in Table 4.4, the mean, trimmed mean, and median were nearly equal for the total score of correct discriminations on vowel contrasts, consonant contrasts, distractors, and for the final averaged score of correct discriminations on the 20 word pairs of the AX task. However, in most cases skewness and kurtosis were not close to 0. This together with the findings of the tests of normality displayed in Table 4.5, which yielded significant results for nearly all learner groups (p < .05), provided evidence that the data were not normally distributed.
56 All data collection had to take place on school premises, which, in some cases, led to poor quality
recordings with a considerable amount of background noise. That posed no problem for the analysis of the answers to the auditory discrimination task, but the same does not apply to the imitation task, where noise played an important role in the analysis of the subjects’ imitations. That fact was noticed when recordings for A1, B1, and B3 were carried out. An attempt was made to obtain better quality recordings in subsequent data collections by means of using microphones SONY ECM-717 and VIVANCO EM 216 with varying degrees of success. The importance of noise in recordings and its possible effects on the evaluation of learners’ performance in the production of FL sounds will be discussed in later sections of this dissertation.
57 The valid number of discriminations was 5,550. Seventy responses were, in fact, missing cases (see p. 119
Table 4.4. Data screening (cross-sectional Ss). All measures are based on raw scores
(number of correct discriminations).
Mean s.d.
5% trimmed
mean Median Min Max* Skewness Kurtosis
A1 Vow.a Cons.b Dist.c Alld 5.34 1.86 6.76 13.97 1.696 1.093 .435 2.179 5.48 1.85 6.79 14.09 6 2 7 14 0 0 6 8 8 4 7 18 –1.482 .468 –1.276 –1.243 3.635 –.281 –.406 2.612 A2 Vow. Cons. Dist. All 5.61 2.28 6.39 14.28 1.128 1.137 .728 1.994 5.65 2.28 6.46 14.28 6 2 6.50 14 3 0 4 10 8 5 7 19 –.419 .032 –1.236 –.041 .278 –.083 1.897 –.048 A3 Vow. Cons. Dist. All 6.56 2.85 6.63 16.04 .641 .989 .565 1.255 6.56 2.84 6.69 16.04 7 3 7 16 5 1 5 14 8 5 7 18 –.222 .317 –1.247 .051 .018 –.791 .736 –.953 B1 Vow. Cons. Dist. All 6.07 2.54 6.79 15.39 1.331 .962 .630 1.988 6.16 2.58 6.90 15.54 6 3 7 16 2 0 4 8 8 4 7 19 –1.154 –.513 –3.644 –1.749 1.849 .542 14.680 6.383 B2 Vow. Cons. Dist. All 6.62 2.24 6.41 15.28 .728 1.023 .733 1.533 6.62 2.25 6.50 15.23 7 2 7 15 5 0 4 13 8 4 7 19 .145 .121 –1.435 .202 –.224 –.224 2.800 –.233 B3 Vow. Cons. Dist. All 6.53 2.60 6.45 15.58 1.012 .841 .552 1.483 6.58 2.58 6.47 15.64 7 2.50 6 16 4 1 5 11 8 5 7 19 –.930 .620 –.274 –.749 1.108 .599 –1.003 2.250 C1 Vow. Cons. Dist. All 6.68 2.23 6.45 15.36 1.041 1.343 1.371 2.674 6.75 2.19 6.71 15.61 7 2 7 16 4 0 1 7 8 5 7 19 –.953 .712 –3.374 –1.604 .874 –.024 12.609 3.816 C2 Vow. Cons. Dist. All 6.29 2.57 6.71 15.57 .951 .976 .756 1.902 6.32 2.58 6.79 15.58 7 3 7 16 5 1 5 13 7 4 7 18 –.764 –.277 –2.646 –.154 –1.687 .042 7.000 –1.870 D1 Vow. Cons. Dist. All 6.73 2.53 6.63 15.90 1.056 .960 .566 1.794 6.81 2.51 6.69 15.91 7 2 7 16 3 1 5 12 8 5 7 20 –.875 .352 –1.270 –.089 1.730 –.272 .721 –.016 D2 Vow. Cons. Dist. All 7.10 2.80 6.70 16.60 .738 .789 .675 1.265 7.11 2.78 6.78 16.61 7 3 7 17 6 2 5 15 8 4 7 18 –.166 .407 –2.277 –.280 –.734 –1.074 4.765 –1.663 D3 Vow. Cons. Dist. All 6.50 2.50 6.00 15.00 .577 1.291 .816 .000 6.50 2.50 6.00 15.00 6.50 2.50 6 15 6 1 5 15 7 4 7 15 .000 .000 .000 .000 –6.000 –1.200 1.500 .000
*Maximum values were 8, 5, 7, and 20 for vowel contrasts, consonant contrasts, distractors, and overall task, respectively.
a vowel contrasts b consonant contrasts c distractors
Table 4.5. Tests of normality for cross-sectional data.
Kolmogorov-Smirnova Group Statistic Df Sig.
A1 .247 29 .000 A2 .218 36 .000 A3 .312 27 .000 B1 .222 28 .001 B2 .251 29 .000 B3 .256 40 .000 C1 .302 22 .000 C2 .345 7 .012 D1 .191 49 .000 D2 .254 10 .067 Vowel contrasts D3 .307 4 . A1 .208 29 .002 A2 .182 36 .004 A3 .250 27 .000 B1 .221 28 .001 B2 .248 29 .000 B3 .262 40 .000 C1 .249 22 .001 C2 .241 7 .200(*) D1 .240 49 .000 D2 .245 10 .091 Consonant contrasts D3 .151 4 . A1 .469 29 .000 A2 .299 36 .000 A3 .411 27 .000 B1 .490 28 .000 B2 .305 29 .000 B3 .317 40 .000 C1 .427 22 .000 C2 .504 7 .000 D1 .415 49 .000 D2 .472 10 .000 Distractors D3 .250 4 . A1 .230 29 .000 A2 .114 36 .200(*) A3 .166 27 .054 B1 .172 28 .034 B2 .158 29 .063 B3 .213 40 .000 C1 .173 22 .087 C2 .224 7 .200(*) D1 .155 49 .005 All pairsb D2 .224 10 .168
* This is a lower bound of the true significance.
a Lilliefors Significance Correction
Next, missing cases and outliers were studied in order to find out whether they had an effect on the lack of normal data distributions.
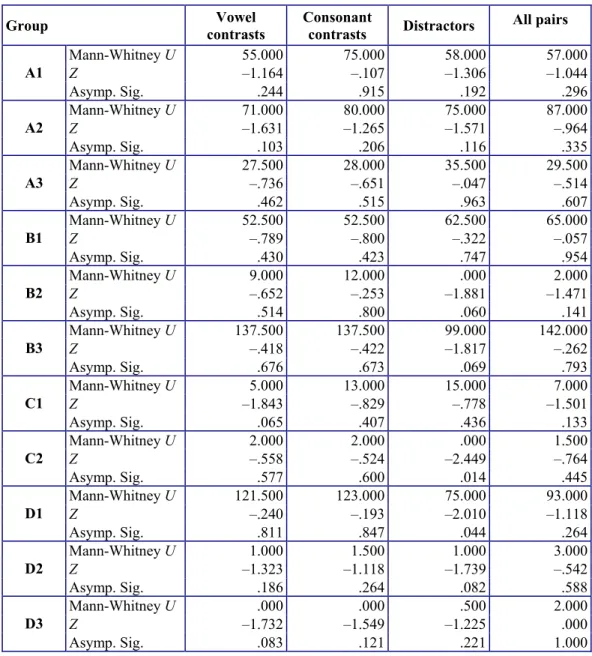
A missing case was defined as that of subjects failing to give an answer to a pair of words, either due to their performance or due to “technical problems”58. Out of the total 5,620 discriminations, 70 responses (1.24%) distributed in 47 subjects were missing cases, of which 17 were due to “technical problems”, and the remaining 53 were no answers on the subjects’ part59. To study the effect of missing cases on the discrimination scores and to know if those values were random, following Tabachnick and Fidell (1989), a new variable was created to identify subjects with complete cases and those with missing cases. Mann-Whitney U tests were performed on the total correct discrimination scores for vowel and consonant contrasts, distractors, and overall AX task as dependent variables; and with the variable containing complete vs. missing cases as a factor. With the exception of C2’s and D1’s raw scores on distractors, no significant differences were found in any of the learner groups between subjects who provided an answer to all the 20 pairs in the discrimination task and those who did not (p > .05) (see Table 4.6). In the case of C2 and D1, it was hypothesised that the significant effect of missing cases on the correct discrimination scores of distractors might have been triggered by outliers.
Further, to determine whether the fact that subjects responded or did not provide an answer to a pair in the AX task resulted from their onset age of FL learning, experience in the TL, dominant L1(s), and gender, two other variables were created. The first variable grouped those subjects who provided an answer (both correct and incorrect) to all the task pairs, while the second variable consisted of all those subjects who failed to answer any of the total 20 pairs. Separate Kruskal-Wallis analyses and Mann-Whitney U tests (the latter for two-level independent variables) were conducted on the two variables mentioned above as dependent variables, and with onset age of FL learning, exposure, dominant L1(s), and gender as factors. No analysis yielded significant differences among the various groups being compared (p > .05). Therefore, the fact that subjects responded to all pairs in the AX task or missed providing an answer was not the result of either onset age of FL learning, or amount of exposure to English, or dominant L1(s), or gender.
58 On occasion, a researcher had to stop the task briefly, whereby a word of the pair on the tape might go
forward unheard on resuming the test. And in a small number of cases a researcher accidentally recorded over the task tape for 1–2 seconds. These technical and practical problems prevented subjects from discriminating a specific pair of words.
59 A maximum of 3 missing cases per subject was found. Out of the 16.72% or 47 Ss with missing cases,
10.3% (29 Ss) had 1 missing case only, 4.6% (13 Ss) had 2 missing cases, and 1.8% (5 Ss) had 3 missing cases.
Table 4.6. Results of Mann-Whitney U tests to study the effect of cross-sectional subjects
with missing values vs. complete cases on the correct discrimination scores.
Group contrasts Vowel Consonant contrasts Distractors All pairs
Mann-Whitney U 55.000 75.000 58.000 57.000 Z –1.164 –.107 –1.306 –1.044 A1 Asymp. Sig. .244 .915 .192 .296 Mann-Whitney U 71.000 80.000 75.000 87.000 Z –1.631 –1.265 –1.571 –.964 A2 Asymp. Sig. .103 .206 .116 .335 Mann-Whitney U 27.500 28.000 35.500 29.500 Z –.736 –.651 –.047 –.514 A3 Asymp. Sig. .462 .515 .963 .607 Mann-Whitney U 52.500 52.500 62.500 65.000 Z –.789 –.800 –.322 –.057 B1 Asymp. Sig. .430 .423 .747 .954 Mann-Whitney U 9.000 12.000 .000 2.000 Z –.652 –.253 –1.881 –1.471 B2 Asymp. Sig. .514 .800 .060 .141 Mann-Whitney U 137.500 137.500 99.000 142.000 Z –.418 –.422 –1.817 –.262 B3 Asymp. Sig. .676 .673 .069 .793 Mann-Whitney U 5.000 13.000 15.000 7.000 Z –1.843 –.829 –.778 –1.501 C1 Asymp. Sig. .065 .407 .436 .133 Mann-Whitney U 2.000 2.000 .000 1.500 Z –.558 –.524 –2.449 –.764 C2 Asymp. Sig. .577 .600 .014 .445 Mann-Whitney U 121.500 123.000 75.000 93.000 Z –.240 –.193 –2.010 –1.118 D1 Asymp. Sig. .811 .847 .044 .264 Mann-Whitney U 1.000 1.500 1.000 3.000 Z –1.323 –1.118 –1.739 –.542 D2 Asymp. Sig. .186 .264 .082 .588 Mann-Whitney U .000 .000 .500 2.000 Z –1.732 –1.549 –1.225 .000 D3 Asymp. Sig. .083 .121 .221 1.000
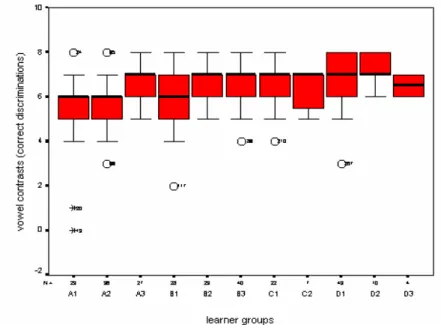
The following step involved identifying outliers by means of boxplots. Forty subjects were found to be outliers60. Among them, 12 had missing values, as well. As seen in Figures 4.1 – 4.4, most outliers were located at the lower bound, that is, their performance was significantly below the smallest observed values. Figure 4.3 shows one outlier in C2 that turned out to be the same subject with a missing value. The subject’s
60 The boxplots in Figures 4.1 to 4.4 revealed several “numbers” that were either above or below the boxplot
whiskers. Each of those numbers stood for each subject’s number (row) in the cross-sectional data matrix. Thus, by referring to the matrix, it was possible to identify the subjects whose performance was noticeably different from the remaining learners in their corresponding subject groups.
performance was also below the average mean, and being a small group in size, it affected overall discrimination scores. But the same did not apply to D1, for none of the outliers had missing values.
Thus, except for the sole case of C2, there seemed to be no reason why outliers with missing cases (found in groups other than D1) should have had an effect on their respective group’s correct discrimination scores, and yet they were considered outliers. One could argue that their performance (both poor and excellent) might have been the result of chance/guessing. This supposition was explored by means of Runs Tests. The results did not support the argument that subjects’ order of responses “the same” and/or “different” were due to chance/guessing (Z –3.045, p > .05).
Figure 4.1. Boxplot for all cross-sectional subject groups’ correct discriminations of vowel
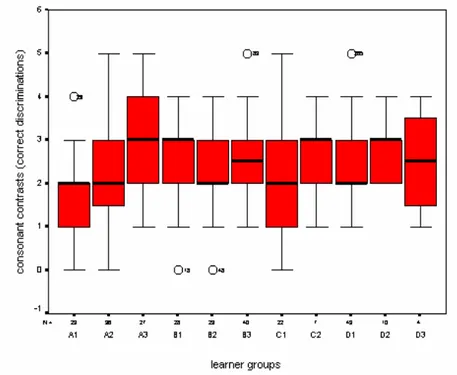
Figure 4.2. Boxplot for all cross-sectional subject groups’ correct discriminations of
consonant contrasts
Figure 4.3. Boxplot for all cross-sectional subject groups’ correct discriminations of
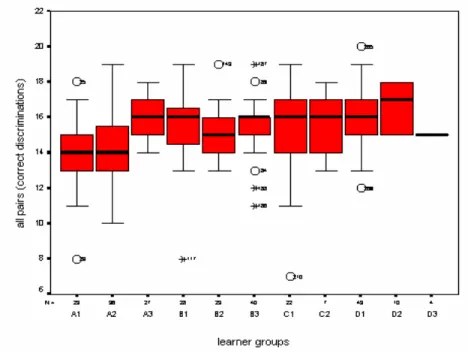
Figure 4.4. Boxplot for all cross-sectional subject groups’ total correct discriminations on
the auditory discrimination task
As outlier performance did not seem to have a clear-cut explanation, case deletion was not recommended in order to obtain rather normal distributions (Hatch & Lazaraton, 1991). Data removal was not considered, either, since it would have reduced even more. Likewise, subjects with missing cases were kept as such, because, on the whole, they proved to be random and did not affect learner groups’ correct discrimination scores.
In the same way, data distributions coming from the longitudinal subjects’ 1,180 discriminations (59 Ss across all learner groups x 20 word pairs) were also studied, which revealed that data failed to conform to a normal distribution. It would have been desirable to further analyse longitudinal subjects’ performance on the auditory discrimination task (and imitation task) in this study, especially after investigators’ continued call for longitudinal studies in L2 acquisition research. For instance, Singleton & Ryan (2004) point out that “if theoretical accounts of age-related factors in language acquisition are ever to get beyond the speculative stage, we require research which correlates age-related variables and language gains in a thoroughgoingly detailed manner.” (p. 228) (see also Flege, 1995a, 2005; Moyer, 2004). However, at a later stage – i.e. after data screening – it was decided that the longitudinal subjects’ results would not be included in this dissertation. The main reason for this decision lies in the fact that there was a high number of longitudinal
subgroups61. Therefore, a great number of statistical analyses would have had to be conducted and, rather than adding clarity or precision to the principal findings concerning Catalan/Spanish bilingual learners of English, these additional analyses would have served only to muddy the waters. A related consequence was the decrease in the size of groups, which often raised the question as to whether there were enough subjects62 to carry out the specific statistical tests properly63 – i.e. Wilcoxon Signed Ranks tests and Friedman tests for two and three related-sample groups. Finally, preliminary analyses showed that longitudinal subjects followed the tendencies found for cross-sectional data. For example, as will be reported later for cross-sectional Ss, an increase in exposure in 8-year-old beginners led to A3long’s noticeably higher correct discrimination scores than those of A1long and A2long. For all of the above reasons, the study of longitudinal subjects was discarded for this dissertation.
After data screening, the findings of skewed data distributions, significant tests of normality, and unequal number of subjects in groups (groups such as C2 and D3 contained very few subjects) did not meet the assumptions required to opt for parametric procedures. Instead, nonparametric tests were used with the AX task discrimination scores. Furthermore, it was decided that subjects’ results in groups C2 and D3 would not be analysed statistically, due to the scarcity of subjects in those groups. Thus, when their results obtained in the AX task are displayed, they will be considered as no more than indicative.
As far as nonparametric analyses are concerned, an alpha level of .05 was set. Significant results will be reported as having a significance value below .05, i.e. p < .05. That is, the exact significance level will not be given in those instances. However, the exact significance value of results that were close to being significant (or marginally significant)
61 Even though the findings resulting from the analysis conducted on longitudinal Ss have not been included,
it should be noted that data screening looked at longitudinal groups as a whole. As stated in g in Table 4.2, in
the case of those longitudinal subjects who had started to learn English at the age of 8, a number of longitudinal subgroups were created, since A1long, A2long, and A3long had different number of subjects. Thus,
there was a subgroup of 5 subjects in A1long, A2long, and A3long; another subgroup consisting of 9 subjects in
A1long and A2long; 2 subjects were longitudinal in A1long and A3long; and, finally, a subgroup of 7 subjects
comprised A2long and A3long.
62 The most extreme case was the two subjects forming A1
long and A3long.
63 Although nonparametric tests are the best option when some of the assumptions underlying parametric tests
are not met, authors differ in their views on what size constitutes a very small sample and how to treat it. For instance, Siegel (1956) offers different calculations depending on whether the sample is <= 8 (very small sample) or > 20 (large sample). In http://www.graphpad.com/instatman/Nonparametrictests.htm, a sample < 12 is considered small. There it is further stated that “with very small samples, it may be impossible for the P value to ever be less than 0.05, no matter how the values differ”.
is stated (e.g. p = .070). For a result to be considered marginally significant, p values are between > .05 and < .10. And nonsignificant results are displayed as p > .05. Finally, it should be mentioned that nonparametric tests did not allow for the study of the (significant or nonsignificant) interaction among the research variables.
4.4.2. Imitation task
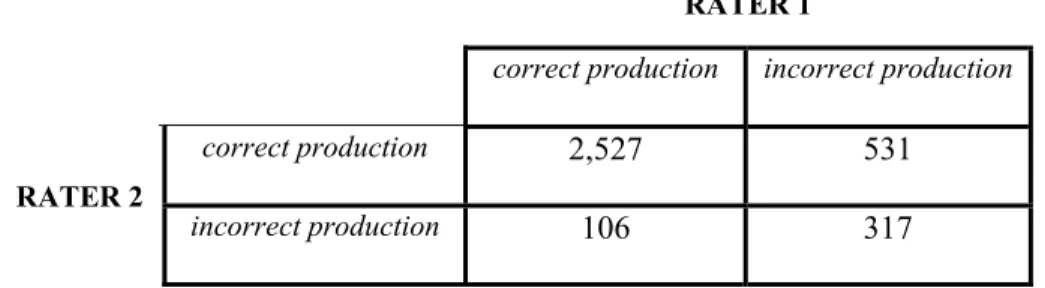
A pilot study was carried out with the data collected until 1997: groups A1, B1, B3, C164, and C2 (108 Ss). Two raters, female native speakers of American English65, were asked to assess specific target sounds in each of the 34 words that the subjects imitated as correct or incorrect productions – i.e. native-like or nonnative-like production in English (see Appendix B for the intended sounds for study in the original research design). Neither of the two raters was phonetically trained, so they were provided with the list of words, each underlined with the particular sound they had to evaluate on each occasion. Although not a requirement, where possible, they were also asked to transcribe orthographically the sound they had just judged as incorrect. Each rater assessed a total of 3,481 sound productions66 separately over a period of 3–4 months. The two raters’ assessments are summarised in Table 4.7 below. Thus, it can be seen that out of a total of 3,481 evaluations, they agreed in 2,844 instances (the same 2,527 productions were judged as correct by the two listeners and the same 317 productions were rated as incorrect by both listeners), while they disagreed in 637 instances (106 productions were judged as correct by rater 1 and incorrect by rater 2, and 531 productions were judged as incorrect by rater 1 and correct by rater 2).
64 At that time 4 subjects formed C1.
65 Recall that subjects were asked to imitate a native British English model. The choice of native American
English listeners was based on their availability to complete the evaluation/rating task. The possible influence of listeners’ differing native variety of English from that of the model will be commented on when discussing the results from two additional studies (Study 1 and Study 2) conducted on subjects’ productions of English words.
66 Had all 108 subjects produced the 34 words, a total of 3,672 word productions would have been obtained.
But, as in the auditory discrimination task, some subjects had a few missing cases due to the same reasons outlined for the AX task.
Table 4.7. Raters’ assessments (Total = 3,481).
RATER 1
correct production incorrect production
correct production 2,527 531
RATER 2
incorrect production 106 317
A Kappa analysis was computed on their evaluations, which returned a measure of agreement of 0.402 (p < .001). Despite its significance (due to the large number of productions considered in the analysis), the agreement between the two raters was low. Several explanations might account for this finding. One plausible cause might be the absence of an English native speaker group, which, in turn, might have influenced raters in different ways67. In this case, rater 2 was laxer in her assessments, especially for consonant sounds and consonant clusters like the following: /d/ and /nz/ in word-final position, /dr/ in word-initial position, //, /v/, and /z/ (see Table 4.8).
Table 4.8. Examples of sound productions where the two raters mostly differed in their
final number of correct productions assessed.
Rater 1 Rater 2 pad 18 61 loath 37 85 pens 40 91 dream 56 72 very 63 82 pleasant 72 102
Another reason for the low measure of agreement between raters might lie in the evaluation procedure itself. For instance, there is hardly any record of whether judges changed their original assessments in cases where they re-listened to several subjects’
67 For example, in the Flege and Fletcher (1992) study, listeners assigned stronger foreign accent ratings to
sentences produced by non-native speakers of English, when there was a larger number of sentences spoken by NSs of English included in a set presentation.
productions68. Furthermore, raters did not meet to discuss disagreements between their judgements, as they had performed the task over different periods of time.
Visual inspection of raters’ orthographic transcriptions revealed that they did not only focus on the target sound intended for study, but also on the surrounding phonetic context when assessing learners’ production of English sounds. Also, investigation of orthographic transcriptions showed that on a few occasions listeners rated a sound as incorrect (while it seems to be correct according to the orthographic transcription) because the other sounds in the word were not produced accurately. Examples include, among others, rating word-final /d/ in pad as incorrect because evaluators heard initial /b/ instead of /p/ (bad); incorrect /h/ in hat and /ks/ in box, as a different vowel was produced: //, //, // (hot, hut, books); and incorrect production of // in it because subjects added a consonant such as word-initial /h/ or word-final /s/ (hit, its). Then, in the absence of orthographic transcriptions for sounds rated as incorrect, doubts arose as to whether judges had only taken into account the target sound for evaluation or the surrounding phonetic context.
As a result, no average rating could be calculated, and the assessments obtained for every learner group were not further examined. Alternatively, and as more data were gathered, new analyses were undertaken with a shift in focus on what segments to rate for. Finally, to prevent shortcomings such as the ones mentioned above, listening conditions and judges’ final ratings were controlled for (see Section 5.2 below). Additionally, the number of raters was increased and a control group of native English speakers was included. Those studies appear in Sections 5.2.I and 5.3.II of this dissertation.
68 In very few instances, rater 2 noted down a change in her evaluations after further listening of subjects’