Appendice
172
APPENDICE H: Dati tecniche di confronto per le misure di concentrazione
•
Portina n°2
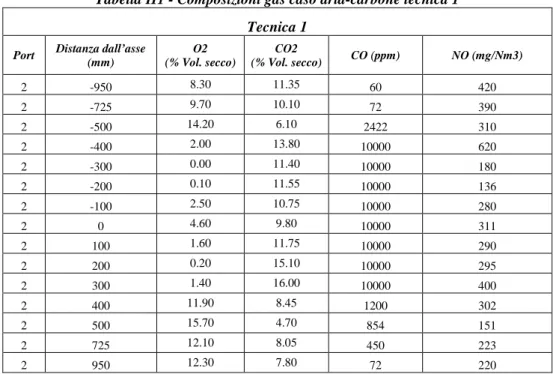
Tabella H1 - Composizioni gas caso aria-carbone tecnica 1
Tecnica 1
Port Distanza dall’asse (mm) O2 (% Vol. secco) CO2 (% Vol. secco) CO (ppm) NO (mg/Nm3) 2 -950 8.30 11.35 60 420 2 -725 9.70 10.10 72 390 2 -500 14.20 6.10 2422 310 2 -400 2.00 13.80 10000 620 2 -300 0.00 11.40 10000 180 2 -200 0.10 11.55 10000 136 2 -100 2.50 10.75 10000 280 2 0 4.60 9.80 10000 311 2 100 1.60 11.75 10000 290 2 200 0.20 15.10 10000 295 2 300 1.40 16.00 10000 400 2 400 11.90 8.45 1200 302 2 500 15.70 4.70 854 151 2 725 12.10 8.05 450 223 2 950 12.30 7.80 72 220
Tabella H2 - Composizioni gas caso aria-carbone tecnica 2
Tecnica 2
Port Distanza dall’asse (mm) O2 (% Vol. secco) CO2 (% Vol. secco) CO (ppm) NO (mg/Nm3) 2 -950 5.50 12.20 185 435 2 -725 8.00 11.00 93 390 2 -500 11.20 8.15 280 425 2 -400 0.60 14.30 10000 465 2 -300 0.00 10.60 10000 80 2 -200 0.00 10.60 10000 30 2 -100 0.00 10.40 10000 115 2 0 0.00 11.60 10000 190
Appendice
173
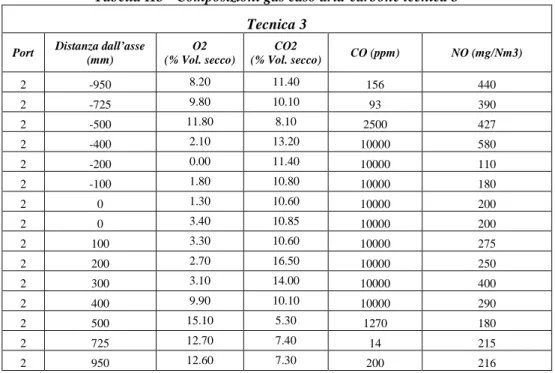
Tabella H3 - Composizioni gas caso aria-carbone tecnica 3
Tecnica 3
Port Distanza dall’asse (mm) O2 (% Vol. secco) CO2 (% Vol. secco) CO (ppm) NO (mg/Nm3) 2 -950 8.20 11.40 156 440 2 -725 9.80 10.10 93 390 2 -500 11.80 8.10 2500 427 2 -400 2.10 13.20 10000 580 2 -200 0.00 11.40 10000 110 2 -100 1.80 10.80 10000 180 2 0 1.30 10.60 10000 200 2 0 3.40 10.85 10000 200 2 100 3.30 10.60 10000 275 2 200 2.70 16.50 10000 250 2 300 3.10 14.00 10000 400 2 400 9.90 10.10 10000 290 2 500 15.10 5.30 1270 180 2 725 12.70 7.40 14 215 2 950 12.60 7.30 200 216
•
Portina n°7
Tabella H4 - Composizioni gas caso aria-carbone tecnica 1
Tecnica 1
Port Distanza dall’asse (mm) O2 (% Vol. secco) CO2 (% Vol. secco) CO (ppm) NO (mg/Nm3) 7 -950 6.10 13.15 2250 451 7 -450 0.60 14.35 10000 313 7 0 2.40 15.70 10000 322 7 450 7.80 12.00 600 255 7 950 11.70 8.30 350 204
Tabella H5 - Composizioni gas caso aria-carbone tecnica 4
Tecnica 4
Port Distanza dall’asse (mm) O2 (% Vol. secco) CO2 (% Vol. secco) CO (ppm) NO (mg/Nm3) 7 -950 7.30 12.40 360 390 7 -450 3.80 12.55 10000 240 7 0 4.00 13.90 10000 260 7 450 7.60 11.85 620 244