Alma Mater Studiorum – Universit`a di Bologna
DOTTORATO DI RICERCA IN
MECCANICA E SCIENZE AVANZATE DELL’INGEGNERIA
Ciclo XXXII
Settore Concorsuale: 09/A1
Settore Scientifico Disciplinare: ING-IND/04
Crack growth in adhesively bonded joints
under quasi-static and fatigue loading
Presentata da: Nicola Zavatta
Coordinatore Dottorato
Prof. Marco Carricato
Supervisore
Prof. Enrico Troiani
i
Abstract
Adhesively bonded joints are attracting increasing interest in the aerospace industry. However, incomplete knowledge of fatigue crack growth in adhesive bonds is a major concern to their application. This thesis investigates several aspects of crack growth in adhesively bonded joints. The influence of adhe-sive thickness on fatigue crack growth under mode I loading was addressed by a combination of experimental tests and numerical simulations. Increased crack growth was found in thicker specimens. This was explained as a re-sult of increased energy available for crack growth in thicker adhesives, while the crack growth resistance was found not to be affected by the thickness. Formation of micro-cracks promoted by increased plasticity is thought to be the source of increased crack growth. Cohesive zone models were applied to the study of mode I and mode II quasi-static crack growth. A strong dependence on the input parameters was observed. In particular, the effect of viscous regularization on the solution was investigated. A proof of consis-tency of the viscous solution was proposed. It was shown that a low value of viscosity is needed to obtain consistent results. Finally, disbond arrest in bonded GLARE was studied by means of fatigue tests on bolted cracked lap shear specimens. The experiments evidenced a moderate decrease of the crack growth rate near the bolt. This was further investigated by numerical computations, which showed a significant change of the strain energy release rate around the bolt from mixed mode I/II to almost pure mode II. Outside this region, good predictions of the fatigue crack growth rate could be ob-tained by a combination of existing models from the literature. Extensive adherent cracking was observed, which led to the conclusion that crack arrest in GLARE comes from a balance of adhesive crack growth retardation and adherent cracking.
Ringraziamenti
Ringrazio innanzitutto il mio supervisore, Prof. Enrico Troiani, per l’opportu-nità che mi ha offerto accettandomi come suo dottorando. Vorrei spendere un ringraziamento particolare nei suoi confronti per aver condiviso con me ben più di quanto i semplici doveri accademici richiedano.
Ringrazio i miei genitori per la loro costante presenza e la fiducia nei miei confronti.
Ringrazio infine la mia ragazza, Claudia, che mi ha supportato fin dal primo giorno del dottorato e che, in ultimo, ha contribuito personalmente alla cor-rezione di questa tesi.
A voi dedico i miei ringraziamenti più sentiti.
Contents
1 Introduction 1
1.1 Thesis motivation . . . 1
1.2 Thesis objectives . . . 2
1.3 Thesis outline . . . 3
2 Influence of adhesive thickness 5 2.1 Introduction . . . 5 2.2 Literature review . . . 6 2.3 Materials . . . 9 2.4 Test set-up. . . 13 2.5 Methods . . . 14 2.6 Experimental results . . . 18 2.7 Numerical model . . . 26 2.8 Numerical results . . . 27 2.9 Discussion . . . 32 2.10 Conclusions . . . 34
3 Cohesive zone models 39 3.1 Introduction . . . 39
3.2 Literature review . . . 40
3.3 Formulation of the cohesive zone model . . . 42
3.4 Implementation of the cohesive model . . . 48
3.4.1 Double cantilever beam model . . . 49
3.4.2 End-notched flexure model . . . 52
3.5 Results and discussion . . . 54
3.5.1 Double cantilever beam results. . . 54
3.5.2 End-notched flexure results . . . 60
3.6 Effect of viscous regularization . . . 64
3.7 Conclusions . . . 66 v
4 Disbond arrest in bonded GLARE 73 4.1 Introduction . . . 73 4.2 Literature review . . . 75 4.3 Materials . . . 76 4.4 Test set-up. . . 80 4.5 Methods . . . 83
4.5.1 Fatigue crack growth measurement . . . 83
4.5.2 Strain energy release rate in a CLS specimen . . . 87
4.5.3 Fatigue crack growth prediction in mixed-mode . . . . 88
4.6 Numerical model . . . 89 4.7 Results . . . 91 4.7.1 Experimental results . . . 91 4.7.2 Numerical results . . . 93 4.8 Discussion . . . 97 4.9 Conclusions . . . 100 5 Conclusions 105
List of Figures
2.1 Manufacturing of 1.5l specimens. The plate on the left is en-tirely covered by a sheet of epoxy film, the plate on the right is covered with strips of adhesive over approximately half of its surface area. The plates are then placed on top of each other, with the adhesive in the middle of the resulting stack [26]. . . 10
2.2 Microscopic pictures of the adhesive layer in two specimens with different nominal thickness. The pictures were taken from the side of the specimen after manufacturing. . . 11
2.3 Loading blocks used to connect the specimens to the fatigue machine. . . 13
2.4 Crack growth rate vs maximum strain energy release rate. All test data are plotted together to explicitly show the depen-dence of the curves on the R-ratio. . . 18
2.5 Crack growth rate as a function of the maximum strain energy release rate. The data are grouped according to the R-ratio to show the effect of the thickness. . . 19
2.6 Gmaxcorresponding to a given value of the crack growth rate,
plotted as a function of the adhesive thickness. Linear fits through the data are shown, as a guide to the eye. . . 20
2.7 Crack growth rate vs energy dissipation per cycle. Data are grouped according to the R-ratio. . . 21
2.8 Schematic representation of a secondary crack developing in-side the adhesive thickness.. . . 22
2.9 Fatigue crack growth in 1.5l specimens. The two photographs show the difference between cracks with and without secondary branching. . . 23
2.10 Fatigue crack growth resistance G∗ vs maximum strain energy
release rate. . . 24
2.11 Energy dissipated per cycle for a fixed crack growth rate, plot-ted as a function of Gmax. . . 25
2.12 Energy dissipation per cycle as a function of the cyclic energy, for a fixed crack resistance G∗. . . . 25
2.13 Elasto-plastic behaviour of FM94 epoxy as implemented to model the adhesive layer. Data taken from Papanicolaou et al. [36] . . . 26
2.14 SERR computed with the VCCT for different adhesive thick-ness (dashed lines) and from experimental data (dots). The same load cycle is applied in specimen C-002-D and in the simulations. . . 28
2.15 Cyclic energy computed by the model for different adhesive thicknesses. Data of specimen C-002-D are also shown for comparison. . . 28
2.16 Cyclic energy of the adhesive computed for different thick-nesses, plotted as a function of crack length. . . 29
2.17 Fatigue crack growth resistance compute by the model and from experimental data, plotted as a function of the maximum SERR. . . 31
2.18 Plastic energy dissipation computed by the model for different adhesive thicknesses. . . 32
3.1 Schematics of the cohesive zone around the cracked region. The cracked region, the process zone and the undamaged zone are shown. . . 42
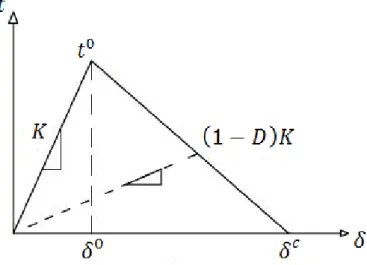
3.2 Bilinear traction-separation law. . . 43
3.3 Configurations considered for cohesive modelling of quasi-static crack growth. . . 48
3.4 Geometry of the double cantilever beam model. The material and the boundary conditions are also shown. . . 50
3.5 Mesh used for the 2D model with configuration (b). Also shown are the right-most node where D = 0.99, denoted as the crack tip, and the cohesive length computed accordingly. . 51
3.6 Geometry of the end-notched flexure model. . . 53
3.7 Load-displacement curve of the double cantilever beam spec-imen computed by the three models using configuration (a): 2D with cohesive elements, 2D with surface-based cohesive formulation and 3D. All quantities are in S.I. units. . . 55
3.8 Crack length in the double cantilever beam model as a function of the applied displacement. The three cases of configuration (a) are shown. All quantities are in S.I. units. . . 56
3.9 Strain energy release rate GI computed by the modified beam
LIST OF FIGURES ix
3.10 Crack shape computed by the 3D model. The crack front at different positions along the specimen length is shown. . . 57
3.11 Load-displacement curve as computed by the 2D model with configuration (b). Data measured in double cantilever beam specimens, i.e. G-005 and H-005, in previous quasi-static tests are also shown for comparison. . . 57
3.12 Crack length computed by the model with configuration (b), plotted as a function of the applied displacement. The crack measured with the camera in specimens G-005 and H-005 is shown for comparison. . . 59
3.13 Comparison of the crack resistance curves, GI vs a, computed
by the model and obtained from experimental data. . . 59
3.14 Load-displacement curve of the end-notched flexure specimen computed by the 2D and 3D models. . . 61
3.15 Crack length in the end-notched flexure model as a function of the applied displacement. The results of the 2D and 3D models are shown.. . . 62
3.16 Crack resistance curve, GII vs a, computed by the 2D model.
Also shown are the experimental results calculated by Budzik et al. [35] using the shear compliance (SC) and simple beam theory (SBT) methods. . . 63
3.17 Crack shape computed by the 3D model. The crack front remains almost straight during crack propagation. . . 63
3.18 Effect of viscosity on the load-displacement curve of a double cantilever beam specimen. The curves overlap for values of µ <10−3 s. . . . 65
3.19 Comparison of the traction-separation curves obtained for dif-ferent values of the viscosity µ. The inviscid law is plotted for comparison. . . 66
3.20 Fracture energy Gc plotted as a function of the artificial
vis-cosity. The nominal value of Gc is equal to 1400 J/m2. . . 67
4.1 Geometry of the cracked-lap shear specimens. . . 76
4.2 Tab bonded on the longer adherent to avoid bending preload during the tests. Note the tapered edge to decrease stress concentrations. . . 78
4.3 Picture of the Hi-lok’s installation: (a) bottom view; (b) top view. The difference between the flush head and the flat head is visible.. . . 79
4.4 Speckle pattern for DIC measurements on the top surface of two specimens. An HL and an FHL samples are shown. The HL sample is clearly recognizable from the protruding head. . 81
4.5 Clamps used to connect the specimens to the fatigue machine. 81
4.6 Image used for calibration of the DIC measurement system. . 82
4.7 Experimental set-up used in the fatigue tests. The two 5 MP cameras used for DIC images acquisition are recognizable in the front. Barely visible behind the lamp is the 9 MP side camera. . . 83
4.8 Steps of the algorithm for crack area measurement: (a) DIC data initialization, (b) removal of Hi-lok data, (c) data pro-jection on grid. . . 86
4.9 Crack front as computed by the tracking algorithm. The front positions for 10 kcycles (left) and 100 kcycles (right) are shown. 87
4.10 Curved crack front at a distance of 0.75 mm from the edge of the hole. The Hi-lok is not shown in order not to obstruct the view. . . 90
4.11 Crack area computed from the DIC data, plotted as a func-tion of the number of cycles. The results for both types of specimens are shown. The dashed line represents the area corresponding to the edge of the flush-headed Hi-lok. . . 91
4.12 Crack area growth rate plotted against the number of cycles. . 92
4.13 Crack length measured by the side camera (squares), plotted together with the equivalent crack length obtained dividing the crack area by specimen thickness (dots). . . 93
4.14 Surface crack started at the edge of the hole in the aluminium panel. The picture was taken at 145 kcycles. . . 94
4.15 Comparison of the average strain energy release rate computed by the VCCT and according to Brussat et al.’s theory, in the case of a cracked lap shear specimen without the Hi-lok. The mode I and mode II components of the SERR are shown. . . . 95
4.16 Distribution of the strain energy release rate along the spec-imen width. Three distances with respect to the edge of the hole are considered: 2.3 mm, 1.3 mm and 0.75 mm. The ver-tical dashed lines denote the coordinates corresponding to the edge of the Hi-lok’s head.. . . 96
4.17 Comparison of the average strain energy release rate computed for the conventional cracked lap shear specimen and for the bolted one. The vertical dashed line denotes the edge of the Hi-lok’s head. . . 98
LIST OF FIGURES xi
4.18 Crack length plotted as a function of the number of cycles. The theoretical curve obtained by the combination of Brussat’s and Bürger’s models is shown for comparison. . . 99
List of Tables
2.1 Adhesive thickness at the mid-point of the specimen, as mea-sured with the optical microscope. Only the average thickness is available for single layer specimens. . . 12
2.2 Summary of the experiments and their corresponding R-ratios. The tests are grouped according to the R-ratio used, as shown in the last column. . . 15
2.3 Coefficients of the power-law fitting of U vs a, as expressed in Equations (2.10) and (2.11). The energy U is measured in [mJ], the crack length in [mm]. . . 30
2.4 Coefficients of the power-law fitting of Upl vs a, as expressed
in Equations (2.10) and (2.11). The plastic energy Upl is in
[mJ], the crack length in [mm]. . . 31
3.1 Material properties employed in the double cantilever beam model. . . 49
3.2 Cohesive properties of the double cantilever beam model. Val-ues in column i are the components of the stiffness and cohe-sive strength in the corresponding direction. . . 50
3.3 Cohesive properties of the end-notched flexure model. Values in column i are the components of the stiffness and cohesive strength in the corresponding direction. . . 53
4.1 Material properties of Al 2024-T3 and of the fibreglass prepreg, as taken from Alderliesten [10]. Here σ4.7%denotes the strength
at 4.7% strain.. . . 77
4.2 Summary of the pre-tensioning force in the different samples, as computed according to Equation (4.1). For sample FHL-03, the pre-tensioning force could not be computed due to problems in measuring the length. . . 80
4.3 Test matrix of all samples, grouped according to the type of Hi-lok. Here, Pmax, iand Ni denote the maximum load applied
in the initiation phase and the corresponding number of cycles respectively; Pmax, g and Ng denote the maximum load applied
during crack growth and the corresponding number of cycles. . 84
4.4 Coefficients of Equations (4.6) and (4.7). The crack area Ab is
in [mm2]. The root mean square error RMSE is also reported. 85
4.5 Coefficients of modified Paris’ law, as expressed in Equations (4.16) and (4.17). Strain energy release rate in [J/m2] and crack
Chapter 1
Introduction
Adhesively bonded joints have gained increasing interest in the aerospace industry. Their capability to offer significant weight reduction compared to conventional riveted joints makes them much attractive for a sector in which words like ‘green’ and ‘light’ are being increasingly used. Moreover, adhesive bonds allow joining of components without the need for holes and pins, which come at the cost of high stress concentration factors and are detrimental to fatigue life. For instance, a survey of serious aircraft accidents involving fatigue published in 1984 reported that fasteners and holes alone account for about 40% of the total crashes, being respectively the first and second most common initiation sites of fatigue cracks [1]. Even though these figures should be put into perspective, as the advent of damage tolerant design has resulted in dramatic improvements on safety, they give a measure of how critical proper joint design is for structural integrity.
1.1
Thesis motivation
As good as they might be, adhesively bonded joints are not immune to fa-tigue: geometric discontinuities associated to thickness changes may well result in stress concentrations at the edges. Even worse, incomplete adhe-sion could occur during the manufacturing process in bonded and co-bonded structures, which substantially impairs the joint’s capability to withstand external loads. At present, non-destructive inspection techniques can detect the presence of disbonded areas within the component, but are not able to detect so-called weak bonds, i.e. bonds in which incomplete adhesion does not produce a distinct interface layer [2]. From the certification’s point of view, this means that adhesive bonds are currently acceptable in aircraft structures only on the condition that disbonding does not grow to the point
that critical design loads can not be sustained.
This indeed poses the main questions of this thesis: “How effectively can we predict crack growth in adhesive bonds? And to which extent can existing prediction methods be applied to situations different from the one they were developed for?”
Pascoe [3] already pointed out that most of the existing works on ad-hesive bonds focus on prediction methods more than on understanding the causes of fatigue disbonding and deriving prediction methods accordingly. Put it differently, many studies on fatigue crack growth in adhesive bonds are phenomenological, i.e. based on empirical observation of the specific phe-nomenon, rather than being based on knowledge of the mechanisms implied. In present author’s view, this has a strong practical consequence: knowl-edge on fatigue in adhesive bonds is fragmentary, with many different meth-ods applied to problems which should indeed be strictly interconnected to one another. Incomplete knowledge of how fatigue crack growth varies according to the fracture mode is a good example of this.
1.2
Thesis objectives
This research started in continuation of a previous work investigating the effect of thickness on fatigue crack growth in adhesively bonded joints [4]. Experimental evidence suggested an effect opposite to that reported in other works in the literature, i.e. increased adhesive thickness resulted in faster crack growth. Thus, the first question that was addressed was what mecha-nism is responsible for the effect of thickness. In particular, we investigated how varying the thickness affects plasticity in the adhesive and how this relates to the observed thickness effect.
Answering this question involved numerical modelling of the fracture re-gion. Further modelling of the crack propagation resulted in the development of a cohesive zone model for mode I and mode II crack growth under quasi-static conditions. By comparing the numerical results to the experimental ones, it was apparent that the input parameters of the model play a key role in the computed output. In spite of this, only some of these parameters have received attention in the literature. Most remarkably, only a few studies were found, dealing with the effect of the viscous numerical scheme used to stabilize the solution on the solution itself, despite it being widely adopted in finite element solvers. This motivated a more in-depth study of the effect of viscous regularization on the numerical solution of a cohesive model.
Finally, we investigated the effect of a bolted disbond arrest feature on fa-tigue crack growth in bonded cracked lap shear specimens made of GLARE.
1.3. THESIS OUTLINE 3 While the material was different from that used until that point, e.g. Al 2024 aluminium alloy, this activity was motivated by the opportunity to extend our study of fatigue crack growth to loading conditions which are more rep-resentative of those encountered in aerospace applications.
1.3
Thesis outline
The thesis is structured as follows:
Chapter 2 investigates the effect of adhesive thickness on fatigue crack growth under mode I loading.
Chapter 3 deals with the application of cohesive zone models to computa-tion of crack growth in mode I and mode II. The influence of viscous regularization on the numerical solution is also discussed.
Chapter4presents the study of disbond arrest features in bonded GLARE. Chapter 5 concludes the thesis by summarizing the main findings of the
research.
AppendixA contains a proof of consistency of the viscous solution.
References
1. Campbell, G. S. & Lahey, R. A survey of serious aircraft accidents involving fatigue fracture. International Journal of Fatigue 6, 25–30 (1984).
2. Kruse, T., Körwien, T., Ruzek, R., Hangx, R. & Rans, C. Fatigue behav-ior and damage tolerant design of bonded joints for aerospace application on Fiber Metal Laminates and composites in 29th ICAF Symposium -Nagoya (2017), 7–9.
3. Pascoe, J. A. Characterisation of Fatigue Crack Growth in Adhesive Bonds.PhD thesis (Delft University of Technology, 2016), 147. http:// doi.org/10.4233/uuid:ebbf552a-ce98-4ab6-b9cc-0b939e12ba8b. 4. Zavatta, N. Influence of adhesive thickness on adhesively bonded joints
under fatigue loadingMaster thesis (Università di Bologna, 2015). http: //amslaurea.unibo.it/9713/1/zavatta%7B%5C_%7Dnicola%7B%5C_ %7Dtesi.pdf.pdf.
Chapter 2
Influence of adhesive thickness on
fatigue crack growth of adhesively
bonded joints
This chapter deals with the topic of fatigue disbonding in metallic bonded joints. In particular, we discuss the influence of the adhesive thickness on fatigue disbonding of aluminium-epoxy specimens in mode I. First the issues related to the study of disbonding are briefly introduced and contextualized within a literature review on this subject. Then, the findings of our study are presented and discussed critically by comparison with existing results. Finally, we put forward an hypothesis to explain the observed results.
Part of the work presented here was carried out in collaboration with Dr. John-Alan Pascoe and Prof. René Alderliesten of TU Delft, that the author gratefully acknowledges. No criticism should be directed at them for any of the opinions expressed by the present author.
2.1
Introduction
Adhesive bonding has seen an increasing diffusion in weight-critical appli-cations. Although bonded joints allow to reduce the stress concentrations compared to riveted or bolted structures, they are susceptible to cracking along the bondline. This can occur either in the form of a crack develop-ing inside the adhesive layer, i.e. cohesive failure, or disbonddevelop-ing at interface between the adhesive and the adherent, i.e. adhesive failure. The presence of a crack propagating in a thin layer surrounded by bulk material is some-what different from crack growth in metals and bears some similarities to the phenomenon of delamination in composite materials.
Much effort is still needed to understand the fatigue crack growth be-haviour in bonded joints. Many prediction methods have been proposed in the past, but these are mostly based on empirical correlations rather than an understanding of the physics [1]. That physical understanding of the fatigue phenomenon is more than a mere speculation is also debated in Alderliesten et al. [2], with reference to fatigue in fibre-reinforced polymers.
Pascoe et al. [3, 4] have suggested that more insight into the underlying physics can be gained by measuring the dissipation of strain energy during the crack growth process. They showed that correlating the crack growth rate to the measured strain energy dissipation per cycle (dU
dN), rather than to
the strain energy release rate (SERR), could account for most of the effect of the stress ratio. A small stress ratio effect was still observed. It was suggested that this might be caused by non-linearity of the force-displacement curve [4]. However, further examination has shown that the force-displacement curve remains linear throughout the fatigue test [5]. An alternative hypothesis is that the observed difference in energy dissipation at different stress ratios, for a given crack growth rate, is caused by differences in the stress state and amount of plasticity at the crack tip. It is known from previous works, e.g. [6–10], that the adhesive thickness affects these parameters and thereby the fracture toughness.
Various studies on the effect of adhesive thickness on fatigue crack growth have been published [11–19]. While these works identify the effect of thick-ness, a clear explanation of this effect is still lacking.
Thus we investigated the effect of different bondline thicknesses on the fatigue disbonding behaviour in FM94 epoxy adhesive, as a way of gaining more understanding of the effect of the crack-tip plastic zone on crack growth behaviour. This is done by comparing results from crack growth experiments on Double Cantilever Beam (DCB) specimens with different adhesive thick-nesses with numerical modelling to determine the amount of plasticity. Before presenting the results of this work, a review of the existing literature on the effect of adhesive thickness on crack growth is discussed.
2.2
Literature review
Several studies on the effect of adhesive layer thickness on fatigue crack growth are available in the literature. A concise review of the effect of thick-ness on fracture (under quasi-static load) has been provided by Azari et al [11].
In general, these works report that higher thickness results in lower fa-tigue crack growth rates and also higher fracture toughness [11–13, 15–17,
2.2. LITERATURE REVIEW 7
19], which is ascribed to the effect of constraint (provided by the adherends) on the plastic zone size in the adhesive layer. Removal of constraint (by increasing thickness) is thought to result in more plasticity, which then in-creases the crack resistance, thus reducing the fatigue crack growth.
In contrast, Krenk et al. [14] reported no effect of thickness in a single-lap joint with a two-part cold-cured epoxy (9323, manufactured by 3M). Schmueser [18] found an increase of fatigue crack growth rate for increasing adhesive thickness in a Cracked Lap Shear (CLS) specimen, with a one-part epoxy (Ciba-Geigy Araldite XB-3131). In this case it should be noted that the loading mode-mix was different for the different adhesive thicknesses.
Chai [13] investigated two brittle epoxies (Namco 5208 and Hercules 3502) and one tough resin (PEEK) and found different behaviours. For the brittle epoxies the fracture toughness increased for increasing thickness. For PEEK, however, at low thicknesses (t < 0.038 mm) the fracture toughness first decreased with increasing thicknesses, and only at higher thicknesses did the toughness increase with increasing thickness.
Detailed studies explaining how bond line thickness affects fracture have been mainly confined to quasi-static loading. Nevertheless, these studies may also shed light on the fatigue behaviour. Kinloch and Shaw [6] identified that the effect on fracture toughness is non-monotonic. Up to an optimum thickness tm the fracture toughness GIc increased with increasing thickness.
Above tm, an increase of the adhesive thickness resulted in a reduction of the
fracture toughness.
Kinloch and Shaw explained this behaviour with the work of Bascom et al. [7] and Wang et al. [8], who studied the plastic zone and the stress fields ahead of the crack tip. Based on those works, Kinloch and Shaw argued that for t < tm the adherends restrict the full development of the
plastic zone. This reduces the capacity of the adhesive to dissipate energy by mechanisms other than fracture, resulting in a lower fracture toughness. The lower t, the greater the restrictive effect of the adherends, and therefore the lower the fracture toughness will be. For t > tm, the dominant effect
according to Kinloch and Shaw is the amount of constraint in the adhesive. As the thickness increases, the degree of constraint reduces. The reduction in constraint causes the plastic zone to extend less far ahead of the crack tip. This reduces the volume of the plastic zone, resulting in a reduction of fracture toughness.
These constraint effects were further investigated by Daghyani et al. [9], eventually leading Yan et al. [10] to propose a model involving two different mechanisms. Yan et al. propose that a reduction in thickness increases the constraint on the adhesive, resulting in a reduction of the plastic zone size, and therefore a decrease of the fracture toughness. This is the primary
mechanism when t < tm. When the thickness is greater than the optimum
thickness, an increase in thickness will allow increased crack tip blunting to occur, resulting in increased void-crack coalescence, and therefore a lower fracture toughness.
In contrast to the findings of Kinloch and Shaw and Yan et al., a re-cent study by Azari et al. [20] found no evidence of an optimum thickness, reporting a linear increase of the toughness with adhesive thickness for all the tested thicknesses. This suggests that the Kinloch-Shaw and Yan et al. models may be material dependant. It is also possible that for the adhesive tested by Azari et al. the optimum thickness is larger than the maximum value investigated.
Pardoen et al. [21] investigated the effect of thickness based on a work of fracture approach. Their findings were in line with the models of Kinloch-Shaw and Yan et al., but did highlight a number of important considerations. First of all, Pardoen et al. performed a fractographic investigation, which identified that the fracture mechanisms (for the adhesive they investigated) takes place on a length scale on the order of 100-200 µm. This means that, at low adhesive thicknesses, not only the plastic zone but also the fracture mechanisms themselves may be constrained by the adherents. Furthermore, Pardoen et al. pointed out that the intrinsic work of fracture of the adhesive, which is not affected by the plasticity, may itself also depend on the local stress state, and thereby on the adhesive thickness.
The works mentioned above all quantified the effect of thickness on the fracture toughness, i.e. the resistance to crack growth. However, the ad-hesive thickness might also affect the driving force for crack growth. That is, for the same applied far-field loading, a different thickness might result in a different driving force. Chiu and Jones [22] investigated the case of an undamaged bond, and found that the adhesive thickness affected the stress distribution. Gleich et al. [23, 24] and Lenwari et al. [25] looked specifically at the stress intensity factor at the bi-material interface at the end of the bondline and found that the stress intensity factor increased for increasing adhesive thickness. It is unclear whether these results also hold for a cohesive crack within the adhesive layer. Nevertheless, they could help explain the apparent decrease of fracture toughness for increasing adhesive thickness re-ported in the papers mentioned above. After all, the fracture toughness there was measured based on the applied load. So, an increase in crack driving force for the same applied load would produce the impression of a lowered fracture toughness.
From the available studies one can conclude that in general, up to a certain optimum, a greater adhesive thickness will produce more plastic de-formation, and as a result lower crack growth rates. The precise effects will
2.3. MATERIALS 9 however depend on the adhesive and geometry under consideration.
Compared to most of the literature (with the exception of Chai [13] and to a certain extent also Azari et al. [11] and Mall and Ramamurthy [16]), this research focused on lower thicknesses, considering a maximum thickness on the order of 0.3 mm.
2.3
Materials
For this research double cantilever beam specimens consisting of two Al 2024-T3 arms bonded with FM94K.03AD epoxy film adhesive were used. This adhesive comes in the form of a film supported by a polyester carrier mat, which allows for better control of the thickness. Three types of specimens with different nominal adhesive thicknesses were investigated.
As a baseline, fatigue crack growth data from specimens containing a single layer of adhesive film with polyester carrier were used. This data had been collected previously and published by Pascoe as part of his PhD thesis [26]. In the online datasets [5] these are referred to as series B through E. In the following they will collectively be denoted as 1l specimens, as they contained 1 layer of adhesive.
Two further types of specimens were manufactured. One type contained two layers of adhesive film (both with polyester carrier) and was denoted series G. Here these samples will collectively be referred to as 2l specimens. The third type of specimens contained approximately 1.5 layers of adhesive film and was called series H. Here we will refer to them as the 1.5l specimens. Having ‘1.5 layers’ of adhesive film was achieved during manufacturing by making an adhesive layer consisting of one layer of FM94K.03AD adhesive with carrier and then placing strips of FM94-U-06 adhesive film without carrier on top of this, over approximately half the surface area. This is shown in Figure 2.1. During curing the epoxy without carrier will flow, resulting in an adhesive layer thickness in between that of the single and the double layer specimens.
Accurate thickness control cannot be achieved with this manufacturing strategy. However, the adhesive thickness of each 1.5l and 2l specimen was measured before testing, in order to take into account the expected thickness variation. Another concern with this manufacturing strategy is that the different adhesive layers will not bond. Figure 2.2 illustrates two pictures of the adhesive bondline in a 1.5l specimen and in a 2l one, which were used to measure the effective thickness. The pictures were taken from the side of the specimens with an optical microscope with 10x magnification factor. They clearly show that the FM94-U-06 strips had indeed flowed enough during
Figure 2.1: Manufacturing of 1.5l specimens. The plate on the left is entirely covered by a sheet of epoxy film, the plate on the right is covered with strips of adhesive over approximately half of its surface area. The plates are then placed on top of each other, with the adhesive in the middle of the resulting stack [26].
the bonding process to produce a uniform thickness layer, confirming that the layers bonded indeed during manufacturing. The presence of a second carrier mat in the 2l specimens might also be expected to influence the results. However, it had previously been shown by Bürger that in mode I the effect of a single carrier mat is negligible [27]. In the present research no results were found that suggested the second mat had an influence, but this could be further investigated in future research.
The specimens were manufactured by bonding two plates of aluminium together for each specimen type. The aluminium plates had been pre-treated by chromic acid anodisation and application of BR-127 primer. A lay-up was created of the two plates, with the uncured epoxy film in between. This stack was then placed in a vacuum bag and cured in an autoclave according to the manufacturer’s specifications (120°C for 1 hour at 6 bar with a 2°C/min heating and cooling rate). After curing, the plates were cut into strips, which were then milled down to a nominal width of 25 mm. Each of the aluminium arms had a nominal thickness of 6 mm, resulting in a nominal total thickness of 12 mm plus the adhesive thickness. The 1l specimens were 300 mm long and the 1.5l and 2l specimens were 270 mm long (in both cases based on the available adherend stock). As for all tests the crack never got closer than 100 mm to the end of the specimen, the difference in specimen lengths should not have any effect. The measured final dimensions of each specimen can be found in the online datasets [5, 28].
2.3. MATERIALS 11
(a) 1.5l specimen
(b) 2l specimen
Figure 2.2: Microscopic pictures of the adhesive layer in two specimens with different nominal thickness. The pictures were taken from the side of the specimen after manufacturing.
Type Specimen ID Thickness [mm] 1 layer Average 0.07 1.5 layers H-002 0.195 ± 0.005 H-003 0.135 ± 0.005 H-004 0.245 ± 0.015 H-006 0.220 ± 0.010 H-008 0.210 ± 0.010 2 layers G-002 0.275 ± 0.015 G-006 0.275 ± 0.005 G-008 0.275 ± 0.005 G-009 0.265 ± 0.015 G-010 0.285 ± 0.005
Table 2.1: Adhesive thickness at the mid-point of the specimen, as measured with the optical microscope. Only the average thickness is available for single layer specimens.
Polyester adhesive tape was placed over a portion of the aluminium plates before bonding, in order to provide a pre-crack length of 50 mm, as measured from the load application points.
For the single layer specimens, the average bond line thickness was 0.07 mm. As the 1l specimens had been tested in an earlier research project, individual measurements of the adhesive thickness of each specimen are not available. The adhesive thickness as measured at the mid-point of the specimen length for the 1.5l specimens and the 2l specimens is reported in Table2.1.
Since in most cases multiple fatigue test were conducted on the same specimen, the tests were labelled with the scheme: [letter]-[number]-[Roman numeral], where the letter refers to the specimen series, the number to the specimen number in that series, and the Roman numeral refers to the number of the test on that specimen. For instance, E-003-II refers to the second test conducted on specimen 003 of series E. Due to issues with the test set-up (e.g. in one case the loading block became detached from the fatigue machine), not all tests produced valid crack growth data. Only the tests that produced valid data have been included in the following.
2.4. TEST SET-UP 13
Figure 2.3: Loading blocks used to connect the specimens to the fatigue machine.
2.4
Test set-up
Fatigue tests were performed on an MTS 10 kN fatigue testing machine at a frequency of 5 Hz under displacement control. Force and displacement were measured by the fatigue bench and crack lengths were measured using a camera aimed at the side of the specimen. A strip of scale paper was fixed at the side of the specimen to allow measurement of the crack. The resolution of image used to determine the crack length was approximately 20 pixels/mm.
The specimens were connected to the fatigue machine using loading blocks that were attached to the specimen by bolts, as shown in Figure 2.3. Prior to each fatigue test, the specimens were quasi-statically loaded in displace-ment control, until crack propagation was observed visually. This ensured that the specimens contained an actual cohesive pre-crack in the adhesive layer. Even though the crack starters were placed at the adhesive/adherent interface, the quasi-static loading caused the crack to jump into the bulk of the adhesive layer. This was also verified by post-mortem inspection of the fracture surfaces of a number of specimens.
As mentioned above, the single layer results were collected by Pascoe et al. during a previous test programme [3, 4]. Initially tests were conducted
to obtain certain ratios of ∆G/Gmax (series B and C). This resulted in four
different force ratios Rp = PPmaxmin: 0.036, 0.29, 0.61 and 0.86. These ratios
were used as displacement ratios Rd = ddmaxmin in the tests on the 1.5l and 2l
specimens. To be able to compare that data with the data on single layer specimens, follow up tests on the 1l specimens were performed using these four values of the displacement ratio. As the force-displacement curve did not pass exactly through the origin, the force ratios were not exactly equal to the displacement ratios. The obtained force ratios are shown in Table2.2, which gives an overview of all experiments discussed in this paper. For clarity of presentation the tests are grouped according to the four target R-ratios.
For Rp = 0.86 the amount of crack growth produced for the 1.5l and 2l
specimens was too small to be able to take accurate measurements, so the results for those experiments will not be presented here. For more information on the specimens and on the test set-up we refer the reader to the work of Pascoe [26] and to the master thesis of the present author [29].
2.5
Methods
The crack length was measured visually from the pictures taken by the side camera. The crack growth rate was then determined by fitting a power-law equation through the a vs N data and taking the derivative.
According to the ASTM standard [30], three methods are acceptable for measuring the mode I fracture toughness in composites. Since an equivalent standard does not exist for adhesively bonded specimens and given that the double cantilever beam geometry we used is similar to that described by ASTM, we refer to those standard test methods for computing the strain energy release rate. The three methods are:
• Modified Beam Theory Method (MBT); • Compliance Calibration Method (CC);
• Modified Compliance Calibration Method (MCC).
The modified beam theory method is based on the hypothesis that the DCB specimen is equivalent to a double cantilever beam clamped at the crack tip, which allows no relative rotation of the upper and bottom adherents at the crack tip. The formula for the SERR under these conditions is:
GI=
3P d
2.5. METHODS 15
Type Experiment Rd Rp Group
1 layer B-001-II 0.1 0.036 0.036 B-002-I 0.88 0.86 0.86 B-002-II 0.74 0.61 0.61 C-001-I 0.33 0.29 0.29 C-002-D 0.67 0.61 0.61 D-002-I 0.29 0.29 0.29 E-001-I 0.29 0.24 0.29 E-001-II 0.29 0.27 0.29 E-002-I 2.3 · 10−4 −0.022 0.036 E-002-II −9.3 · 10−5 0.014 0.036 E-003-I 0.61 0.60 0.61 E-003-II 0.61 0.62 0.61 1.5 layers H-002-I 0.036 0.0054 0.036 H-002-II 0.033 −0.0070 0.036 H-003-I 0.29 0.24 0.29 H-003-II 0.29 0.25 0.29 H-004-I 0.61 0.56 0.61 H-006-I 0.61 0.56 0.61 H-008-I 0.86 0.83 0.86 2 layers G-002-I 0.29 0.25 0.29 G-002-II 0.29 0.23 0.29 G-006-III 0.036 −3.1 · 10−4 0.036 G-008-I 0.61 0.47 0.61 G-009-I 0.61 0.56 0.61 G-010-I 0.86 0.83 0.86 G-010-II 0.033 −0.039 0.036
Table 2.2: Summary of the experiments and their corresponding R-ratios. The tests are grouped according to the R-ratio used, as shown in the last column.
where w is the width of the specimen, P and d are the applied load and displacement respectively, and a is the crack length. Because the two ad-herents can actually rotate at the crack tip, the value of GI computed by
Equation (2.1) tends to be slightly overestimated.
The compliance calibration method differs from the MBT method in that it directly includes the decrease of stiffness consequent from crack growth. The compliance C = d
P is plotted against the measured crack length on a
log-log diagram. A straight line (on the logarithmic scale) is then fit through the data by using a least-squares fitting algorithm, and the slope of the line, n is computed. The strain energy release rate is then calculated according to:
GI=
nP d
2wa (2.2)
In the modified compliance calibration method, a constant A is computed as the slope of a straight line fitting, in a least squares sense, the plot of a h
versus C1
3 generated from the data, where h is the specimen thickness. The
resulting formula for computing the SERR is: GI =
3(P C13)2
2Awh (2.3)
None of the three methods above is clearly superior to the others; ASTM standard [30] indicates a difference of 3.1% in the value of the toughness computed by Equations (2.1), (2.2) and (2.3). In this research, the com-pliance calibration method was applied. The comcom-pliance was calculated as C = dmax−dmin
Pmax−Pmin, where Pmax, dmax and Pmin, dmin are respectively the
maxi-mum and minimaxi-mum load and displacement applied in each cycle. The value n was determined for each experiment individually.
Following the method previously presented by Pascoe et al. [4], the energy dissipation per cycle dU
dN was computed by taking the derivative of a
power-law fit through the total strain energy U vs N data. The energy U was calculated as:
U = 1
2Pmax(dmax− d0) (2.4)
where d0 is the displacement for which the recorded force was zero.
Similarly to Equation (2.4), we can define the cyclic energy Ucyc as:
Ucyc =
1
2(Pmaxdmax− Pmindmin) (2.5) This expression, which holds under the assumption that the load-displacement curve is linear, can be used to quantify the energy stored in the specimen
2.5. METHODS 17 during each fatigue cycle. In fact, as the cyclic energy calculated by Equa-tion (2.5) is a measure of the work done by the test machine in a cycle, by the first law of thermodynamics it must be equal to the increase of internal energy of the specimen plus the energy spent to create new fracture surfaces. By noting this, we can also estimate the amount of cyclic energy which goes in the adhesive layer, Ucyc, adh, as:
Ucyc, adh = Z tmax tmin Z Vadh σ : ˙ε dV dt (2.6)
where Vadh is the volume of the adhesive layer, σ is the stress tensor, ˙ε is the
strain rate and tmin and tmax are the time instants corresponding to dmin and
dmax.
The energy dissipated by plasticity can be computed as: Upl=
Z
Vadh
σ : εpldV (2.7)
where εpl is the plastic strain. If the adherents start yielding, this formula
must be modified by extending the integral to the whole volume of the speci-men. However, since in this work no plasticity was observed in the adherents, we will refer to Equation (2.6) to compute the plastic dissipation.
A way of examining the resistance to fatigue crack growth is by looking at the amount of energy dissipated per unit of crack growth, G∗, which was
calculated according to:
G∗ = 1 w dU dN da dN (2.8) Equation (2.8) reduces to:
G∗ = 1 w
dU
da (2.9)
which is equal to the expression for the strain energy release rate. However, it should be noted that the SERR as defined by Irwin [31, 32] is a proper derivative in the mathematical sense, whereas G∗ is an average over one
fatigue cycle.
As G∗represents the amount of energy dissipated per unit of crack growth,
it can be seen as a measure of the crack growth resistance. More energy dissipation per unit of crack growth means it is harder for the crack to grow. Thus G∗ can be used to investigate whether the crack resistance is constant,
and if not, what factors influence it. It should be noted however, that G∗
measures all forms of energy dissipation. Therefore it can only be used to say something about the crack resistance if there are no other dissipative mechanisms active that are unrelated to crack growth.
Figure 2.4: Crack growth rate vs maximum strain energy release rate. All test data are plotted together to explicitly show the dependence of the curves on the R-ratio.
2.6
Experimental results
Figure 2.4 shows the crack growth rate plotted against the maximum strain energy release rate, following the conventional method. The results for all adhesive thicknesses are shown in the picture. An R-ratio effect is clearly vis-ible: higher R-ratios mean a lower crack growth rate. This is to be expected, as a higher R-ratio means a lower ∆G for the same Gmax.
The data already illustrated are plotted again in Figure 2.5, this time divided according to their R-ratio, so to explicitly highlight the effect of the adhesive thickness. Another way to look at this is shown in Figure2.6, which indicates for each experiment the Gmax that results in a crack growth rate
of 10−4 mm/cycle, as a function of bondline thickness. In Figure 2.6, linear
fits through the data are shown, one for each R-ratio, as a guide to the eye. However, given what is known about the effect of thickness, it is likely that the actual dependence of Gmax on t for a given dNda is non-linear. There is
a clear effect of adhesive thickness: increasing the thickness from one layer causes an increase in crack growth rate for the same load cycle. The effect
2.6. EXPERIMENTAL RESULTS 19
10
-110
010
1G
max(N/mm)
10
-610
-410
-210
0da/dN (mm/cycle)
1l
1.5l
2l
R=0.036
10
-110
010
1G
max(N/mm)
10
-610
-410
-210
0da/dN (mm/cycle)
1l
1.5l
2l
R=0.29
10
-110
010
1G
max(N/mm)
10
-610
-410
-210
0da/dN (mm/cycle)
1l
1.5l
2l
R=0.61
Figure 2.5: Crack growth rate as a function of the maximum strain energy release rate. The data are grouped according to the R-ratio to show the effect of the thickness.
Figure 2.6: Gmax corresponding to a given value of the crack growth rate,
plotted as a function of the adhesive thickness. Linear fits through the data are shown, as a guide to the eye.
of increasing from 1 layer to 1.5 layers appears to be larger than that of increasing from 1.5 layers to 2 layers. However, it should be noted (as it can be seen in Table2.1 and Figure 2.6) that going from 1 to 1.5 layers also causes a larger increase of the final bondline thickness than going from 1.5 to 2 layers.
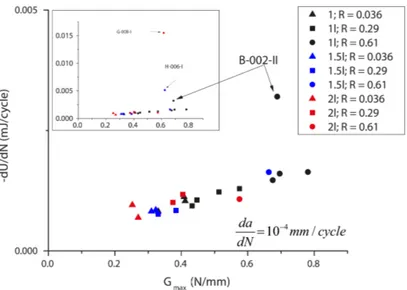
In contrast to the traditional method, Figure 2.7 shows the crack growth rate plotted against the strain energy dissipation per cycle dU
dN. Here the
data fall into a narrow band, except for three experiments: G-006-III (2 layers, R = 0.036), H-006-I (1.5 layers, R = 0.61) and G-008-I (2 layers, R = 0.61). The figure shows that the effect of adhesive thickness on the relationship between energy dissipation per cycle and crack growth rate is limited, especially in comparison to the effect of thickness on the relationship between crack growth rate and Gmax.
The anomalous behaviour of specimens H-006-I and G-008-I can poten-tially be explained by the observed crack growth behaviour. In these ex-periments secondary cracks growing along the adhesive/adherent interface were observed. A definition of secondary crack is schematically shown in Figure 2.8. The secondary crack develops as a branch of the main crack, extending through the adhesive thickness and growing close to the adhe-sive/adherent interface. Figure 2.9 shows a photograph of the secondary cracks in a 1.5l specimen. These secondary cracks were not present during
2.6. EXPERIMENTAL RESULTS 21 100
-dU/dN (mJ/cycle)
10-6 10-4 10-2da/dN (mm/cycle)
1l 1.5l 2l R = 0.036 G-006-III 10-5 100-dU/dN (mJ/cycle)
10-6 10-4 10-2da/dN (mm/cycle)
1l 1.5l 2lR=0.29
100-dU/dN (mJ/cycle)
10-6 10-4 10-2da/dN (mm/cycle)
1l 1.5l 2l G-008-I H-006-IR=0.61
Figure 2.7: Crack growth rate vs energy dissipation per cycle. Data are grouped according to the R-ratio.
Figure 2.8: Schematic representation of a secondary crack developing inside the adhesive thickness.
the other experiments. The growth of these secondary cracks will also dis-sipate energy, while not producing an advance of the main crack tip. As a consequence, the total amount of energy dissipated per unit of growth of the main crack will be increased, which is what is seen in Figure 2.7. We note that the growth of secondary cracks is only observed in the first part of the test, after which they stop and the crack grows as a cohesive crack inside the adhesive layer. An hypothesis on why this secondary crack growth occurs is formulated later in section 2.9.
Note that for all the anomalous experiments a second experiment was conducted under the same load conditions. During these repeat experiments no secondary crack growth was observed, and the data for these repeat ex-periments fall into the same band as for the bulk of the exex-periments.
In Figure 2.10 G∗ is compared to the maximum SERR value Gmax. For
most of the data there is a linear relationship between G∗ and G
max. The
exceptions are the three experiments that were identified as outliers in Fig-ure 2.7, as well as experiments B-001-II (1 layer, R = 0.61) and H-003-I (1.5 layers, R = 0.29). For these experiments the G∗ value rises asymptotically
as Gmax approaches a certain value. Apart from the outliers, the curves for
the higher adhesive thickness specimens seem to follow the same linear trend as those for the single layer specimens. Even though there is some scatter in the data, this suggests that the adhesive thickness does not affect the crack growth resistance in a substantial way. For G-008-I (2 layers, R = 0.61) and H-006-I (2 layers, R = 0.61) the difference in behaviour compared to the other specimens seems to be linked to the secondary crack growth discussed above. As the secondary crack growth was only seen during the early part of the test, when the Gmaxvalue is high, this could explain why for low Gmax
values the G∗ value matches that seen during the tests without secondary
crack growth.
2.6. EXPERIMENTAL RESULTS 23
(a) w/ secondary cracks
(b) w/o secondary cracks
Figure 2.9: Fatigue crack growth in 1.5l specimens. The two photographs show the difference between cracks with and without secondary branching.
Figure 2.10: Fatigue crack growth resistance G∗ vs maximum strain energy release rate.
by Figure 2.11, which shows how much energy was dissipated for a crack growth of 10−4 mm/cycle, as a function of G
max. The figure shows that for a
given R-ratio, for higher adhesive thickness, the amount of energy dissipated to produce 10−4 mm/cycle crack growth rate was lower.
It was noted elsewhere [26, 33] that if G∗ is fixed, i.e. the resistance to
crack growth is the same, then the energy dissipation is strongly correlated to the applied cyclic work Ucyc. Figure2.12 shows the energy dissipation as
a function of Ucyc for a fixed G∗. It can be noted that for a given value of
Ucyc the amount of energy dissipated in the increased thickness specimens is
higher than that dissipated in the single adhesive layer specimens.
The raw and processed data presented in this work are available online [5,
2.6. EXPERIMENTAL RESULTS 25
Figure 2.11: Energy dissipated per cycle for a fixed crack growth rate, plotted as a function of Gmax.
Figure 2.12: Energy dissipation per cycle as a function of the cyclic energy, for a fixed crack resistance G∗.
Figure 2.13: Elasto-plastic behaviour of FM94 epoxy as implemented to model the adhesive layer. Data taken from Papanicolaou et al. [36]
2.7
Numerical model
In order to compute the plasticity produced in the adhesive and its effect on the energy release and dissipation, a 2D finite element model was devel-oped in the software package Abaqus. The geometry of the model was equal to that of the tested specimens, i.e. a double cantilever beam with same dimensions. The adherends were modelled as aluminium plates, while the adhesive was modelled as an epoxy layer cut by the disbond surface along its midline. Three different configurations of the epoxy layer were considered, corresponding to 1 layer, 1.5 layers and 2 layers of adhesive, which resulted in an adhesive thickness equal to 0.08, 0.20 and 0.28 mm respectively.
Both the aluminium and the epoxy were modelled as isotropic materi-als with elastic-plastic behaviour; the elasto-plastic properties of the FM94 epoxy are reported in the literature [35, 36]. Figure 2.13 shows the stress-strain curve which was used to define the elasto-plastic behaviour of the adhesive in the numerical model.
The Virtual Crack Closure Technique (VCCT) [37, 38] was used to com-pute the strain energy release rate in the adhesive. Although the use of the VCCT is usually restricted to the framework of linear elastic fracture me-chanics, a similar application of this technique to yielding of FM300 adhesive is discussed in Jokinen et al [39].
2.8. NUMERICAL RESULTS 27 with quadrangular shape, i.e. types CPE8 and CPE8R in Abaqus. The mesh was refined in order to accommodate a sufficient number of elements around the crack tip; this resulted in a minimum of 4 elements through the adhesive thickness in the single layer specimen.
The model was loaded under displacement control similarly to the exper-imental tests. First the specimen was applied a linear displacement equal to dmax, then it was unloaded down to a displacement of dmin and then loaded
up again to dmax. Globally, this reproduces the loading conditions occurring
during a single cycle in the fatigue tests. The values dmax = 2.85 mm and
dmin = 1.89mm were used in the simulations, which are numerically equal to
those applied to specimen C-002-D in the tests. One single cycle was applied in each simulation. We run a total of ten simulations for each adhesive con-figuration, varying the length of the cracked area from 55 mm to 100 mm, with steps of 5 mm.
2.8
Numerical results
Figure 2.14 shows a comparison between the strain energy release rates GI
computed with the VCCT in the three different configurations of adhesive thickness. The GI calculated from experimental data on single layer
spec-imens is also plotted for comparison. Only specspec-imens with an applied dis-placement comparable to that used in the simulations are reported. The variation of strain energy release rate in the three configurations is as little as 7%. This suggests that, at least for the range of thicknesses considered here, varying the adhesive thickness has little effect on GI. The strain energy
release rate computed by the VCCT differs by no more than 15% from the experimental results for all the considered disbond lengths. The numerical and experimental curves tend to diverge for short disbonds, which can be related to the presence of the insert used for pre-cracking. It might be that, as the crack starts at the insert, only after some length the SERR reaches the value observed for crack growth in the bulk adhesive. Comparing the numer-ical results to the data from specimen C-002-D, which were obtained under basically the same cyclic displacement, shows an almost complete overlap-ping of the curves for both the maximum and minimum strain energy release rates, which suggests that both the upper and lower part of the loading cycle are well reproduced by the model.
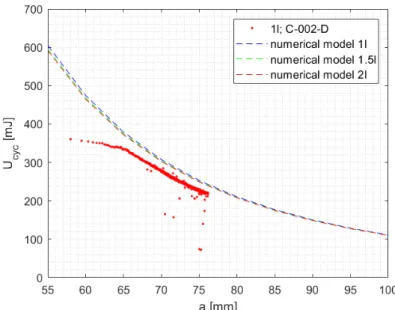
The cyclic energy Ucyc computed by the numerical model for different
adhesive thicknesses is plotted in Figure 2.15 versus the crack length. The cyclic energy of specimen C-002-D is also plotted for comparison, given that the same loading cycle is applied. For both cases, Equation (2.5) is used
Figure 2.14: SERR computed with the VCCT for different adhesive thick-ness (dashed lines) and from experimental data (dots). The same load cycle is applied in specimen C-002-D and in the simulations.
Figure 2.15: Cyclic energy computed by the model for different adhesive thicknesses. Data of specimen C-002-D are also shown for comparison.
2.8. NUMERICAL RESULTS 29
Figure 2.16: Cyclic energy of the adhesive computed for different thick-nesses, plotted as a function of crack length.
to calculate Ucyc. Like in Figure 2.14, the effect of the thickness is small,
in that the Ucyc computed in the three configurations differs by as little as
2.5%. The value of the cyclic energy computed by the model is slightly overestimated compared to that of the tested specimen (about 10% more). We note that, at the beginning of the test, the experimentally measured Ucyc
is remarkably lower than the computed one, which has probably to do with the high compliance of the specimen.
By using Equation (2.6), we can compute the cyclic strain energy of the adhesive layer, Ucyc, adh, for different thicknesses. The results are shown in
Figure 2.16. The figure clearly shows that more energy goes in the thicker adhesive. However, by comparison with Figure2.15, it can be noted that the amount of strain energy in the adhesive is only a small fraction of the energy in the whole specimen, which explains why no appreciable variation of Ucyc
could be seen for different thicknesses.
The crack growth resistance G∗ can be estimated numerically by using
Equation 2.9. This requires first the computation of the total energy U for each cycle, which can be done straightforwardly by Equation (2.4). In order to compute dU
da, a power-law fitting of U vs a is generated using a least squares
algorithm. This yield an expression in the form:
U = αaβ + γ (2.10)
The derivative dU
Type α β γ 1 layer 7.038 · 107 −2.764 −10.65
1.5 layers 6.345 · 107 −2.742 −11.88
2 layers 6.050 · 107 −2.732 −12.37
Table 2.3: Coefficients of the power-law fitting of U vs a, as expressed in Equations (2.10) and (2.11). The energy U is measured in [mJ], the crack length in [mm].
gives:
dU
da = αβaβ−1 (2.11)
The coefficients of the power-law for the three adhesive thicknesses are pro-vided in Table 2.3.
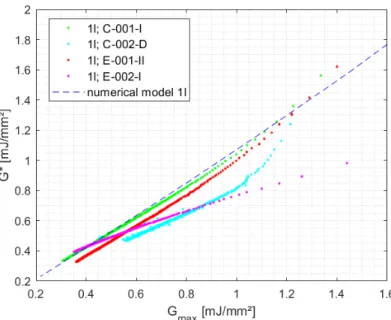
Figure 2.17 shows the fatigue crack growth resistance G∗ computed by
the model for the single layer adhesive, plotted as a function of the maxi-mum SERR. Also shown are the experimental data of four 1l specimens. It is worth noting that the numerical results are computed according to Equa-tion (2.9), thus not considering the crack growth rate, while the experimental G∗, calculated by Equation 2.8, explicitly considers it. Despite this concep-tual difference, and the scatter already noted in Figure 2.10, the results of the model fall within the same range of the experimental data.
No plasticity occurs in the aluminium adherends, in accordance to what was observed in the tested specimens. On the contrary, the yield strength of the epoxy is exceeded in a region around the crack tip, which extends through the adhesive thickness. This means that a plastic deformation is produced in the adhesive layer during the loading cycle, which is not recovered after unloading. As a result, a net amount of energy associated to the plastic strain is dissipated in the process. The plastic dissipation per unit crack growth is given by dUpl
dA = 1 w
dUpl
da . This was computed using a power-law fitting of
the form of Equations (2.10) and (2.11). The coefficients of the fitting are shown in Table2.4. The amount of plastic dissipation depends on the applied energy, which for a single cycle is equal to Ucyc.
The plastic energy dissipation is affected by the adhesive thickness, as shown in Figure 2.18. The thicker the adhesive layer, the more energy is dissipated by plasticity for a given applied energy. The relationship between the amount of dissipated energy and the adhesive thickness is non-linear, as it is clearly visible in the figure: increasing the thickness from 0.08 mm
2.8. NUMERICAL RESULTS 31
Figure 2.17: Fatigue crack growth resistance compute by the model and from experimental data, plotted as a function of the maximum SERR.
Type α β γ
1 layer 1.962 · 1010 −5.644 0.0169
1.5 layers 2.069 · 1010 −5.534 −0.0758
2 layers 1.571 · 1010 −5.440 −0.1431
Table 2.4: Coefficients of the power-law fitting of Upl vs a, as expressed
in Equations (2.10) and (2.11). The plastic energy Upl is in [mJ], the crack
Figure 2.18: Plastic energy dissipation computed by the model for different adhesive thicknesses.
(1 layer) to 0.20 mm (1.5 layers) results in a plastic dissipation which is 1.6 times the original value; an additional increase to 0.28 mm only increases the dissipation of about 10%.
2.9
Discussion of experimental and numerical
results
A comparison between Figures 2.4 and 2.10 shows that despite the higher G∗ for higher Gmax, the crack growth rate is also higher. That is to say:
although more energy is being dissipated per unit of crack growth, the crack growth rate is also higher. That faster crack growth requires more energy dissipation per unit of growth has been observed previously [40], though not to the extent seen here. This implies that increasing Gmaxnot only increases
the resistance (in terms of required energy per unit crack growth), but also the amount of energy available for crack growth.
In particular, it appears that the secondary crack growth seen during experiments G-008-I and H-006-I is driven by an extra amount of energy that is not available for normal crack growth. Otherwise it cannot be explained that the same crack growth rate is achieved for much higher G∗ values.
Although no secondary crack growth was seen for experiments G-006-III (2 layers, R = 0.036), B-001-II (1 layer, R = 0.61), and H-003-I (1.5 layers,
2.9. DISCUSSION 33 R = 0.29), the similarity in the shape of the G∗ vs G
max curves to those
for G-008-I and H-006-I suggests that also for these specimens there is some form of dissipative mechanism that is activated at high Gmax values. What
mechanism this is could not be determined during the present research. Pos-sibilities include void formation that is not in line with the main crack (and therefore does not contribute to crack advance), or secondary crack forma-tion that was not visible from the side of the specimen. Further research is required to investigate these possibilities.
The experimental results show that the adhesive thickness has little effect on the energy dissipated per unit of crack surface created, as illustrated in Figure2.10. At the same time, Figure2.12 shows that the adhesive thickness does affect the total amount of energy dissipated for a given load cycle.
Together Figures2.10 and2.12give an insight on the mechanism of crack growth. The energy dissipation required per unit crack growth for a given load cycle, i.e. combination of Gmaxand Ucyc, is not affected by the thickness.
On the other hand, an increase in adhesive thickness results in a larger total amount of energy dissipation dU
dN, implying more energy is available for crack
growth. As a result, for G∗ to be constant, the crack growth rate must be
higher for higher adhesive thickness. This explains why a thicker adhesive results in a higher da
dN for a given Gmax, as shown in Figure 2.4.
The numerical results confirm that increasing the adhesive thickness yields no substantial difference in the strain energy release rate. Considering the thickness-independent correlation between Gmaxand G∗shown in Figure2.10,
this means that the resistance to crack growth is also independent on the thickness.
Conversely, more plastic dissipation was found in specimens with thicker adhesive. Comparing this with experimental results shows that the increased plasticity has a favourable effect on crack growth.
It seems likely that plastic deformation is related to some form of damage (e.g. voids and crazes) that contributes to crack growth. A recent investiga-tion [41] using in-situ SEM observations of crack growth tests on carbon fibre reinforced polymers suggests that even under mode I loading crack growth occurs by link-up of micro-cracks nucleating ahead of the crack tip. If plastic deformation prompted the formation of micro-cracks around the crack tip, that would explain why more crack growth was observed with thicker adhe-sive, as well as why secondary cracks developed in the thick specimens only in the first part of the test. In fact, from Figure 2.18 we can see that most plasticity is produced when the applied Ucyc is high, i.e. at the beginning of
the test, possibly resulting in micro-cracks formed at the sides of the crack tip, which link up creating secondary cracks. The formation of secondary cracks would then stop when the plastic deformation decreases under a
cer-tain level. Further investigations of the micro-mechanics of fatigue crack growth are required to test this hypothesis.
The effect of increasing the thickness is opposite to most of the fatigue results from literature discussed above, including e.g. the results of Azari et al. [11], Mall and Ramamurthy [16] and Chai [13]. In fact, the damaging mechanism associated to plasticity would be obviously material dependent, and furthermore the thicknesses investigated here were lower than those used in previous studies, which could explain why opposite results are reported in the literature, i.e. decreased crack growth rate with increasing adhesive thickness.
This suggests that also in fatigue there is an optimum thickness, such as found by Kinloch and Shaw [6] and Yan et al. [10] for the (quasi-static) fracture toughness. In the quasi-static case increasing the thickness above this optimum results in a lower fracture toughness; similarly, in fatigue it might result in a higher crack growth rate for a given load cycle. Kinloch and Shaw [6], and Bascom and Cottington [7] suggest that the highest GIc
value is obtained when the plastic zone size at the critical load is equal to the adhesive thickness. Since the plastic zone size depends on the yield strength, this would make the optimum thickness material dependant.
This leads to the hypothesis that, for the FM94 epoxy tested here, the bond line thicknesses were greater than the optimum thickness, whereas for the other adhesives reported in literature the thicknesses were still below the optimum thickness.
2.10
Conclusions
A combination of experiments and numerical calculations was used to inves-tigate the effect of adhesive thickness on fatigue crack growth in an FM94 epoxy adhesive bond.
For the range of thicknesses investigated in this research, increasing the adhesive thickness results in an increase of the crack growth rate. The re-sistance to crack growth (energy dissipation per unit crack growth) is not affected by changes in the adhesive thickness. However, the amount of en-ergy available per unit crack growth, for a given load, increases when the adhesive thickness is increased. The net result is an increased crack growth rate.
The numerical results confirm that the resistance to crack growth is not affected by the adhesive thickness, although more plastic dissipation is found in thicker specimens. It is hypothesised that this plastic deformation pro-motes the formation of micro-cracks around the crack tip, which result in