DOI 10.1393/ncc/i2020-20138-8
Colloquia: SIRR 2020
Radiation dose estimates in DBT compared with FFDM:
A brief analysis
Fulvio Coppola(1)(4)(∗), Leopoldo Angrisani(5), Vittoria D’Avino(1),
Teresa Fronzino(4), Giuseppe La Verde(1)(2), Marco La Commara(1)(2), Giuseppe Sabatino(4) and Mariagabriella Pugliese(1)(3)
(1) National Institute for Nuclear Physics INFN - Naples, Italy (2) Department of Pharmacy, Federico II University - Naples, Italy
(3) Department of Physics “E. Pancini”, Federico II University - Naples, Italy (4) Centre for Advanced Metrology and Technological Services (CeSMA),
Federico II University - Naples, Italy
(5) Department of Computer Science and Electrical Engineering,
Federico II University - Naples, Italy
received 25 January 2021
Summary. — Breast cancer is reported as the second most common cancer in the world. The estimate for 2018 is 59 700 new cases of breast cancer (Bray F. et al.,
Cancer. J. Clin., 68 (2018) 394). The distribution of the incidence of breast cancer
is high especially in industrialized countries, followed by developing countries. The development of effective screening programs allows to lead the survival to 84% in developed countries. Early diagnosis, in the context of these programs, is carried out using X-rays and the equipment used for this purpose is constantly updated to improve the detection capability for the same dose delivered. Nowadays, next to full-field digital mammography (FFDM), 3D technology is available on modern mammography devices, such as Digital Breast Tomosynthesis (DBT). Some studies show that the use of DBT, combined with FFDM, or as a stand-alone technology, allows for a better diagnostic performance than FFDM alone (Skaane P. et al.,
Radiology, 267 (2013) 47; Ciatto S. et al., Lancet Oncol., 14 (2013) 583). In
ad-dition to the diagnostic capacity, of course, the dose to the population participating in the screening programs must also be investigated. Considering that the differ-ent manufacturers of digital mammography systems use differdiffer-ent technologies to reconstruct pseudo-3D images, it is essential to check the radiation dose of various equipment available in healthcare facilities. The purpose of this work is to verify the radiation dose for a specific mammography unit used in both FFDM and DBT procedures.
(∗) E-mail: [email protected]
1. – Introduction
Breast cancer is one of the most frequently diagnosed cancers among women. Breast cancer screenings with digital mammography, in conjunction with effective therapies, have shown to reduce breast-cancer–related mortality, leading to a survival of 84% in de-veloped countries [1]. However digital mammography has a moderate sensitivity which is estimated to vary from 67.3% to 93.3% [2]. Limited sensitivity and specificity in 2D mammography are determined by breast density, which can reduce the ability to detect a lesion (loss of sensitivity), and by the superposition of fibro-glandular tissues which can be misinterpreted as a lesion while it is not present (loss of specificity). 3D breast imag-ing technologies have been developed to increase the detection rate and overcome tissue overlap. Digital Breast Tomosynthesis (DBT) is a 3D imaging technology, widespread nowadays in healthcare facilities, based on the movement along an arc over the com-pressed breast of the X-ray tube. The system performs a series of a low-dose exposures, each from a different angle, and uses the projection images to reconstruct the volume of the breast providing images, usually 1 mm thick, placed on planes parallel to the detector surface.
Many studies in the literature demonstrate the clinical benefits of using DBT tech-nique. Some population-based breast screening trials and research studies indicate that DBT examinations increase the cancer detection rate and reduce the recall rate [3-5].
Although some scientific works indicate that the use of DBT is feasible [6] also as a stand-alone screening modality, the use of digital mammography in full field is still very widespread in the two CC and MLO projections and in some cases the DBT supports this technique and is under further analysis.
On the other hand, some studies, even recent ones, put doubts on the real improve-ment introduced of the DBT modality in the context of population-based breast cancer screenings [7]. The possibility of using DBT in combination with 2D mammography or as a single technique for screening or diagnosis is still an open topic. On the other hand, the combined use implies a higher radiation dose.
Different manufacturers have implemented different solutions to achieve tomosynthe-sis technique, using different anode/filter combinations, type of detector, scan angle and scan geometry. The use of this technique on a large scale, therefore, requires more in-depth analysis as regards the dose to the patient and the quality of the images for the different system on the market.
The purpose of this work is to study the average glandular dose of a specific mam-mograph produced by Fujifilm (Amulet Innovality).
The mammograph below investigation is characterized by a double tomosynthesis modality and three levels of dose provided by the automatic exposure control (AEC). Dose measurements were carried out and compared with those of the 2D modality.
All measurements were performed based on the EUREF protocol for the quality con-trol for DBT systems [8].
2. – Materials and methods
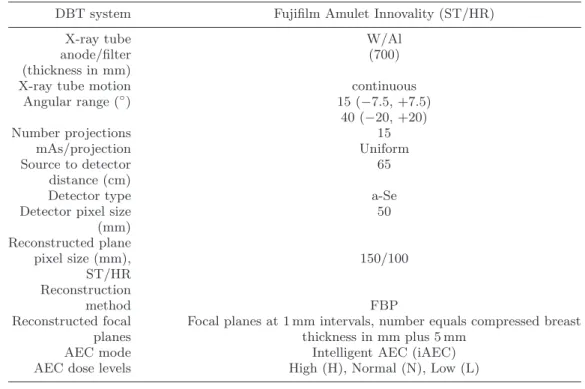
2.1. DBT system. – The DBT system analysed in this study, used in clinical prac-tice, was the Fujifilm Amulet Innovality (Fujifilm Corp, Japan). The main technical characteristics of this DBT systems are included in table I. The system uses a full-field Flat Panel Detector (FPD) with direct conversion (a-Se) and, for the DBT mode, al-ways uses the anode-filter combination W/Al, with a thickness of Al equal to 700 μm.
TableI. – Technical characteristics of the system employed in the study.
DBT system Fujifilm Amulet Innovality (ST/HR)
X-ray tube W/Al
anode/filter (700)
(thickness in mm)
X-ray tube motion continuous
Angular range (◦) 15 (−7.5, +7.5) 40 (−20, +20) Number projections 15 mAs/projection Uniform Source to detector 65 distance (cm)
Detector type a-Se
Detector pixel size 50
(mm) Reconstructed plane pixel size (mm), 150/100 ST/HR Reconstruction method FBP
Reconstructed focal Focal planes at 1 mm intervals, number equals compressed breast
planes thickness in mm plus 5 mm
AEC mode Intelligent AEC (iAEC)
AEC dose levels High (H), Normal (N), Low (L)
The system uses two tomosynthesis modes, Standard (ST) and High Resolution (HR) which use two different angular range for projections, 15◦ and 40◦, respectively. Amulet Innovality acquires 15 projections, in both modalities, with a continuous tube motion and uses a uniform distribution of mAs for projection. With this system it is possible to conduct exposures in a combined way by making 2D and tomosynthesis exams with a single compression.
The system, in both 2D and tomosynthesis modes, uses two automatic exposure con-trol settings, AEC and iAEC, but the latter setting was always used for the measurements reported in this work. Moreover, the automatic exposure control, in both 2D and in to-mosynthesis mode, can be set on three dose levels, normal (N), high (H) and low (L). Although the iAEC low mode is rarely used in clinical practice, it was included in the present study for completeness.
2.2. DBT average glandular dose. – Measurements were made of entrance surface air kerma (ESAK), KT, to obtain the average glandular dose (AGD):
(1) AGD = KTcgsT,
where c, g and s are the well-known conversion factors accounting for different spectra and different tissue composition, and the T -factor accounts for tube motion during image acquisition. These factors were taken form EUREF protocol.
Exposures of thicknesses of polymethyl methacrylate (PMMA), in the range 20– 70 mm, were made under AEC (iAEC mode) and for three different levels of dose: normal, high and low. These measurements were performed in both 2D and tomosynthesis modal-ities. For the latter both ST and HR modes were used. For each exposure the height of the compression paddle was set at the equivalent breast thickness for that thickness of PMMA, as described in the EUREF protocol. At each step the exposure factors (anode/filter, kV and mAs) chosen by the AEC were recorded.
ESAK measurements were performed in manual exposition modality using the ex-posure parameters as close as possible to those chosen by the AEC system. In the tomosynthesis mode the stationary mode (0◦ DBT) was used. Measurements of the half-value layer (HVL) were also made, in the clinically relevant range of kV and filter combination.
For all the above measurements the dosimeter was placed 60 mm above the breast support in contact with compression paddle, 60 mm from the chest wall edge and laterally centred on the breast support.
The output measurements were performed with a digital multimeter equipped with ion chamber and kV-probe (Radcal multimeter, Accu-pro, with ion chamber 10× 6-6M, with 6 cm3 active volume, and kV-probe 40× M). The ionization chamber is subjected to periodic calibrations at a reference dosimetry laboratory.
2.3. Signal-difference-to-noise ratio. – In order to analyse the performance of the automatic exposure control, signal-difference-to-noise ratio (SDNR) measurements were performed in the standard range of breast thickness (20–70 mm). For these measurements the DBT-processed reconstructed images were used. SDNR was measured for both ST and HR tomosynthesis modalities and in 2D mode for reference purpose.
For these measurements a 10 mm× 10 mm and 0.2 mm thick aluminium sheet was placed between two plates 10 mm thick of PMMA. This stack was placed on the breast support and imaged in manual exposition mode using the exposure parameters as close as possible to those chosen by the AEC system, for the equivalent breast thickness. The aluminium sheet was positioned 60 mm from the chest wall edge and laterally centred on the breast support. The exposures were repeated for the PMMA thicknesses in the range 20–70 mm. The SDNR was calculated according to:
(2) SDNR = |MPVAl− MPVbg|
SDbg
,
where MPVAl is the mean pixel value measured in a 5 mm× 5 mm ROI centred in the aluminium foil, and MPVbgand DSbg is the mean pixel value and standard deviation, respectively, measured in two 5 mm×5 mm ROIs located in the background, on the chest wall and nipple sides of the aluminium foil. The measurements in tomosynthesis mode were performed in the image in which the aluminium foil was in focus.
3. – Results and discussion
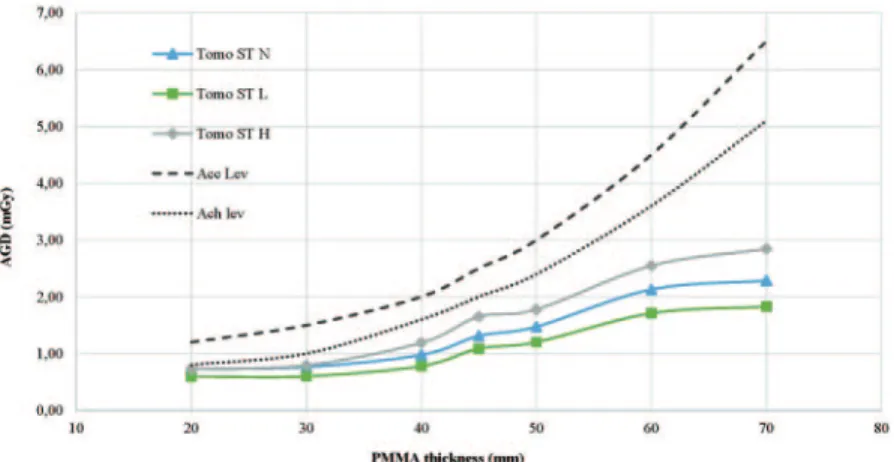
3.1. Average glandular dose. – The average glandular doses calculated for the 2D mode are shown in table II. All calculated doses comply with acceptable and achievable levels, for 2D mammography, indicated in the updated protocol for digital mammography (EUREF, 2017). The average glandular dose for standard and high-resolution tomosyn-thesis modes are shown in table III and table IV, together with the ratios between the
Table II. – Exposure parameters and average glandular doses evaluated for different PMMA
thickness, in 2D mode, using iAEC mode, with three levels of dose (N, L and H).
PMMA (mm) Anode/filter kV mAs AGD (mGy)
2D iAEC - N 20 W/Rh 26 24 0.42 30 W/Rh 28 33 0.52 40 W/Rh 28 51 0.74 45 W/Rh 29 58 1.02 50 W/Rh 30 79 1.26 60 W/Rh 31 102 1.53 70 W/Rh 33 119 1.73 2D iAEC - L 20 W/Rh 26 14 0.26 30 W/Rh 27 28 0.38 40 W/Rh 28 27 0.43 45 W/Rh 29 33 0.54 50 W/Rh 30 46 0.82 60 W/Rh 31 56 0.91 70 W/Rh 33 68 1.14 2D iAEC - H 20 W/Rh 26 36 0.62 30 W/Rh 27 70 0.79 40 W/Rh 28 75 1.27 45 W/Rh 29 86 1.49 50 W/Rh 30 117 1.82 60 W/Rh 31 144 2.25 70 W/Rh 33 180 2.83
doses obtained in the tomosynthesis and 2D modes as a function of PMMA thickness. All the above-reported dose measurements for the tomosynthesis mode are plotted in fig. 1 and fig. 2.
In standard tomosynthesis mode the computed average glandular doses comply with acceptable and achievable levels for 2D mammography, for PMMA thickness ranging from
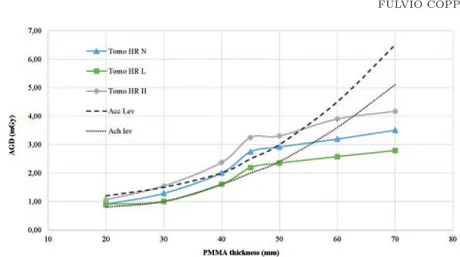
Fig. 2. – Dose measurements for the high-resolution tomosynthesis mode.
20 to 70 mm. The ratio of AGD in standard tomosynthesis mode and AGD in 2D mode range from 1.46 to 2.31 for iAEC low setting, from 1.17 to 1.71 for iAEC normal setting and from 0.94 to 1.17 for iAEC high setting. The values of the ratios agree with those measured in other studies, even if not all the AEC settings have been investigated [9].
TableIII. – Exposure parameters and average glandular doses evaluated for different PMMA
thickness, in standard mode, using iAEC mode, with three levels of dose (N, L and H).
PMMA (mm) Anode/filter kV mAs AGD (mGy) Tomo/2D
(mGy/mGy) TOMO ST iAEC N 20 W/Al 27 19 0.72 1.71 30 W/Al 29 20 0.76 1.46 40 W/Al 31 22.5 0.98 1.32 45 W/Al 33 27.2 1.31 1.28 50 W/Al 34 26.6 1.47 1.17 60 W/Al 37 33.2 2.13 1.39 70 W/Al 38 37.4 2.29 1.32 TOMO ST iAEC L 20 W/Al 27 19 0.60 2.31 30 W/Al 29 16.5 0.60 1.58 40 W/Al 31 20 0.78 1.81 45 W/Al 33 27.2 1.09 2.02 50 W/Al 34 26.6 1.20 1.46 60 W/Al 37 28.7 1.71 1.87 70 W/Al 38 29.9 1.83 1.60 TOMO ST iAEC H 20 W/Al 27 19 0.72 1.17 30 W/Al 29 20 0.79 1.01 40 W/Al 31 27.2 1.19 0.94 45 W/Al 33 32.7 1.65 1.11 50 W/Al 34 32.1 1.78 0.97 60 W/Al 37 39.8 2.55 1.13 70 W/Al 38 45.1 2.84 1.01
TableIV. – Exposure parameters and average glandular doses evaluated for different PMMA
thickness, in high-resolution mode, using iAEC mode, with three levels of dose (N, L and H).
PMMA (mm) Anode/filter kV mAs AGD (mGy) Tomo/2D
(mGy/mGy) TOMO HR iAEC N 20 W/Al 27 24 0.90 2.14 30 W/Al 29 32.6 1.29 2.47 40 W/Al 31 46.7 2.00 2.71 45 W/Al 33 53 2.74 2.68 50 W/Al 34 52 2.92 2.31 60 W/Al 36 54.9 3.19 2.09 70 W/Al 37 62 3.50 2.03 TOMO HR iAEC L 20 W/Al 27 24 0.90 3.48 30 W/Al 29 25.6 1.00 2.64 40 W/Al 31 37.4 1.60 3.72 45 W/Al 33 42.3 2.19 4.08 50 W/Al 34 41.6 2.35 2.85 60 W/Al 36 43.7 2.58 2.82 70 W/Al 37 49.7 2.79 2.45 TOMO HR iAEC H 20 W/Al 27 28 1.06 1.72 30 W/Al 29 39.2 1.55 1.96 40 W/Al 31 55.5 2.38 1.87 45 W/Al 33 63.4 3.25 2.17 50 W/Al 34 61.5 3.30 1.81 60 W/Al 36 65.8 3.90 1.73 70 W/Al 37 74.7 4.17 1.47
In high-resolution tomosynthesis mode the computed average glandular doses do not comply with achievable levels for 2D mammography, for almost all thicknesses. Only for high thicknesses, 60–70 mm in iAEC normal and low settings and 70 mm in iAEC high setting, the doses are below these levels. The acceptable dose levels are exceeded for thicknesses of 40–50 mm, in iAEC high setting, and for 45 mm thickness in iAEC normal setting. The ratios of AGD in high-resolution tomosynthesis mode and AGD in 2D mode range from 2.45 to 4.08 for iAEC low setting, from 2.03 to 2.71 for iAEC normal setting and from 1.47 to 2.17 for iAEC high setting. These values, too, agree with those measured in other studies, even if not all the AEC settings have been investigated.
As expected, as the thickness of PMMA increases, the glandular dose also increases, but in all the AEC settings the dose levels for the thickness of 45 mm and 50 mm have approximately the same value.
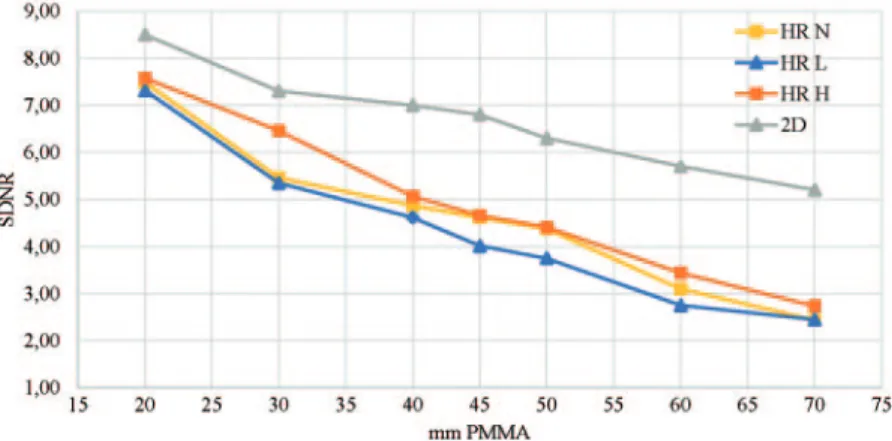
The SDNR values for different PMMA thickness are shown in fig. 3 and fig. 4, for standard and high-resolution tomosynthesis modalities and for three AEC settings (N, L and H). The SDNR value for 2D mammography is shown for comparison.
As expected, SDNR values for tomosynthesis are smaller than those for 2D mam-mography for all thicknesses (20–70 mm) and decrease clearly with increasing PMMA thickness [10]. This is probably due to an increased contribution of X-ray scattering for large thicknesses and therefore to an increased contribution of noise.
Fig. 3. – SDNR computed in the processed reconstructed image in which the Al foil is in focus, in the standard tomosynthesis mode. SDNR in 2D is shown for comparison.
4. – Conclusions
Several works in the literature confirm that DBT can improve the effectiveness of screening programs and the diagnosis of breast cancer. The DBT system studied in the present work has some peculiar characteristics such as a double modality of tomosyn-thesis. In both modalities, the system uses a different X-ray spectrum than that used in 2D mammography and with a higher average energy by appropriately choosing filter and kV values. This is probably due to the need to keep the signal to noise ratio high in low dose exposures of the projection images.
Although the dose levels in DBT, for the studied system, are higher than those mea-sured in 2D mammography for thicknesses of PMMA, except for some thicknesses in standard tomosynthesis with a low AEC setting, from the works present in the literature it is clear that the dose does not represent a determining limit to the use of this tech-nique, but the real diagnostic efficacy still needs to be investigated. The most important contribution introduced with DBT seems to be the higher detection rate. On the other
Fig. 4. – SDNR computed in the processed reconstructed image in which the Al foil is in focus, in the high-resolution tomosynthesis mode. SDNR in 2D is shown for comparison.
hand, it is necessary to characterize these systems from the point of view of dose to patient and of image quality and therefore a subsequent purpose is to investigate the system studied here on the basis of the parameters that influence the image quality.
REFERENCES
[1] Berry D. A., Cronin K. A., Plevritis S. K. et al., N. Engl. J. Med., 353 (2005) 1784. [2] Souza F. H., Wendland E. M., Rosa M. I. and Polanczyk C. A., Breast, 22 (2013)
217.
[3] McCarthy A. M., Kontos D. et al., J. Natl. Cancer Inst. (2014) https://doi.org/10.1093/jnci/dju316.
[4] Rafferty E. A., Park J. M., Philpotts L. E. et al., Radiology, 266 (2013) 104. [5] Bernardi D., Belli P. et al., Radiol. Med., 122 (2017) 723.
[6] Lang K., Andersson I., Rosso A. et al., Eur. Radiol., 26 (2016) 184. [7] Giampietro R. R., Cabral M. V. G. et al., Sci. Rep., 10 (2020) 7991.
[8] European Reference Organization for Quality Assured Breast Screening and Diagnostic Services, Protocol for the quality control of the physical and technical aspects
of digital breast tomosynthesis systems, Version 1.03 (2018).
[9] Strudley C. J., Hadjipanteli A., Oduko J. M. and Young K. C., National Health Services Report 2017807 (2018).