SCUOLA DI DOTTORATO UNIVERSITÀ DEGLI STUDI MEDITERRANEA DI REGGIO CALABRIA DIPARTIMENTO DI INGEGNERIA CIVILE, DELL’ENERGIA, DELL’AMBIENTE E DEI MATERIALI (DICEAM)
DOTTORATO DI RICERCA IN INGEGNERIA DELLE INFRASTRUTTURE E DELLA MOBILITÀ S.S.D.ICAR/04
XXIX CICLO
R
EVIEW OF DESIGN METHODS AND FEM ANALYSIS OF
UNPAVED ROADS REINFORCED WITH GEOSYNTHETICS
PHD STUDENT:
Rocco Palamara
TUTOR:
Prof. Giovanni Leonardi
CO-TUTOR: PROF. NICOLA MORACI PHD. LIDIA SARAH CALVARANO
HEAD OF THE DOCTORAL SCHOOL Prof. Felice Arena
R
OCCOP
ALAMARAR
EVIEW OF DESIGN METHODS AND FEM ANALYSIS OF
Abstract
The geosynthetics are widely used in mechanically stabilization of unpaved roads with a low volume of traffic. The practical use of geosynthetics above a weak subgrade or within a base course has demonstrated the benefit of reducing rut depths and prolonging pavement life. Alternatively, for the same traffic conditions and allowable rut depth, the use of geogrid reinforcement allows a reduction of the construction cost by decreasing the base layer thickness in comparison with the thickness required when the base layer is unreinforced (if the cost of the geosynthetic reinforcement is less than the cost of the base material).The main purpose of this study is to analyze design criteria currently available for reinforced unpaved roads comparing the results obtained by different design procedures aimed at estimating the base thickness required for reinforced unpaved roads, underlining their improvements and limits. Furthermore, a parametric analysis varying design parameters such as soils and geosynthetics mechanical properties, allowable rut depth and traffic conditions, has been conducted.
Moreover, to predict the behavior of unpaved roads, both in unreinforced system and reinforced with geosynthetics configuration, a finite element models have been implemented in ABAQUS program. The focus of this approach is to assess the geogrid reinforcement contribution to reduce the rut depth under repeated wheel traffic load conditions.
Abstract (Italian)
I geosintetici sono ampiamente utilizzati nella stabilizzazione meccanica delle strade non pavimentate con un basso volume di traffico. L'utilizzo di geosintetici posti sopra un sottofondo debole o all'interno dello strato di base ha dimostrato il vantaggio di ridurre la profondità di ormaia e di prolungare la vita della pavimentazione. In alternativa, per le stesse condizioni del traffico e di profondità di ormaia consentita, l'uso dei geosintetici come rinforzo permette una riduzione del costo di costruzione diminuendo lo spessore dello strato di base rispetto allo spessore richiesto quando lo strato di base non è rinforzato (se il costo del geosintetico di rinforzo è inferiore al costo del materiale di base).Lo scopo principale del lavoro svolto è stato quello di analizzare i metodi di progettazione attualmente disponibile per le strade non pavimentate rinforzate con geosintetici e di confrontare i risultati ottenuti dalle differenti procedure di progettazione volte a stimare lo spessore dello strato di base richiesto, sottolineando i loro miglioramenti e limiti. Inoltre, è stata condotta un’analisi parametrica variando i parametri di progetto quali le proprietà meccaniche dei terreni e dei geosintetici, la profondità di ormaia ammissibile e le condizioni del traffico.
Inoltre, per prevedere il comportamento di strade non pavimentate, sia nel sistema non rinforzato che in quello rinforzato con geosintetici è stato implementato in ambiente ABAQUS un modello agli elementi finiti. L’obiettivo di questa analisi è stato quello di valutare il contributo di rinforzo offerto dalla geogriglia nella riduzione della profondità dell’ormaia a seguito di carichi di traffico ciclici.
Abstract ... 5
Abstract (Italian) ... 7
Introduction ... 19
1. Pavement Deterioration and Pavement Management System ... 23
1.1. Importance of road in modern society... 23
1.2. Factors affecting pavement system ... 24
1.2.1. Drainage ... 24
1.2.2. Environmental ... 25
1.2.3. Traffic and loading ... 25
1.2.4. Subgrade ... 26 1.3. Pavement deterioration ... 28 1.3.1. Cracking ... 28 1.3.1.1. Fatigue cracking ... 29 1.3.1.2. Longitudinal Cracking ... 30 a) b) ... 31 1.3.1.3. Transverse cracking ... 31 1.3.1.4. Block cracking ... 32 1.3.1.5. Reflective cracking ... 33 1.3.2. Surface deformation ... 34 1.3.2.1. Rutting ... 35
1.3.2.2. Shoving and corrugations... 37
1.3.2.3. Depression ... 37
1.3.2.4. Potholes ... 38
1.4. Road Pavement Maintenance ... 39
1.4.1. Preventive Maintenance ... 41
1.4.2. Routine maintenance... 42
1.4.3. Corrective Maintenance ... 43
1.4.4. Emergency Maintenance ... 43
1.5. Pavement management system ... 44
1.5.1. Inventory data ... 45
1.5.2. Pavement condition assessment ... 46
1.5.3. Prediction models for pavement deterioration ... 47
1.5.4. Optimization models ... 47
2. Mechanism of geosynthetic reinforcement in road pavement ... 51
2.1. Geosynthetics in civil engineering ... 51
2.1.1. Geotextile (GTX) ... 52
2.1.2. Geogrid (GG) ... 54
2.1.3. Geocell (GCL) ... 55
2.1.5. Geomembrane (GM)... 57
2.1.6. Geocomposite (GC) ... 57
2.2. Geosynthetics in pavement road application ... 58
2.2.1. Separation ... 59
2.2.2. Filtration ... 60
2.2.3. Reinforcement ... 61
2.2.3.1. Lateral restraint ... 61
2.2.3.2. Improved bearing capacity ... 62
2.2.3.3. Tensioned membrane effect ... 63
2.3. Geosynthetics in paved road ... 64
2.3.1. Reinforcement of unbound layer ... 65
2.3.2. Reinforcement in asphalt overlays ... 66
2.4. Geosynthetics in unpaved road ... 68
2.4.1. Separation between base and subgrade ... 70
2.4.2. Lateral restraint and improvement of load distribution ... 71
2.4.3. Tension membrane effect ... 72
2.5. Overview of Previous Studies ... 73
2.5.1. Previous study for paved road ... 73
2.5.2. Finite element analysis for reinforced pavement system... 83
2.5.3. Previous study for unpaved road ... 86
3. Design method for unpaved road reinforced with geosynthetic... 97
3.1. Design method for unpaved roads ... 97
3.2. Method proposed by Barenberg et al. (1975) ... 98
3.3. Method proposed by Giroud e Noiray (1981) ... 101
3.4. Method proposed by Giroud e Han (2004)... 107
3.4.1. Base layer and wheel load ... 108
3.4.2. Properties of base and subgrade materials ... 109
3.4.3. Bearing capacity factor ... 110
3.4.4. Effect of base and subgrade resilient modulus on stress distribution angle ... 110
3.4.5. Effect of traffic on stress distribution angle ... 110
3.4.6. Limit case bearing capacity ... 111
3.5. Method proposed by Leng e Gabr (2005) ... 111
3.5.1. Equivalent thickness for base course layer ... 112
3.5.2. Base layer degradation analysis ... 112
3.5.3. Contribution of geogrid reinforcement ... 113
4. Analysis and discussion of results obtained by unpaved roads design methods and by unpaved roads FEM implementations ... 119
4.2. Unpaved roads design procedure by Barenberg et al. (1975): analysis of results and discussion 120
4.3. Unpaved roads design procedure by Giroud and Noiray (1981): analysis of results and
discussion... 131
4.4. Comparison between Barenberg et al. (1975) and Giroud and Noiray (1981) unpaved roads design procedures: analysis of results and discussion ... 146
4.5. Unpaved roads design procedure by Giroud and Han (2004): analysis of results and discussion 151 4.6. Unpaved roads design procedure by Leng and Gabr (2005): analysis of results ... 161
4.7. Comparison between Giroud and Han (2004) and Leng and Gabr (2005) unpaved roads design procedures: analysis of results ... 171
4.8. 3D-FEM analysis of a reinforced unpaved road ... 176
4.9. 3D FEM modeling of unpaved structure ... 179
4.9.1. Part Module ... 180
4.9.2. Material property module ... 181
4.9.3. Assembly and interaction module ... 183
4.9.4. Load and boundary module ... 184
4.9.5. Mesh module ... 187
4.9.6. Job module ... 189
4.9.7. Results and discussion ... 189
Conclusions ... 193
List of figures
Figure 1.1 Load equivalency factor (www.pavementinteractive.org) ... 26
Figure 1.2 Fatigue cracking ... 30
Figure 1.3 Longitudinal cracking in a) Non wheel path b) wheel path ... 31
Figure 1.4 Transverse cracking (www.pavementinteractive.org) ... 31
Figure 1.5 Block cracking (www.lgam.info) ... 32
Figure 1.6 mechanism of reflective cracking ... 33
Figure 1.7 Propagation of cracking ... 34
Figure 1.8 Rutting in a)paved road, b) unpaved road ... 35
Figure 1.9 Permanent deformation vs rutting ... 36
Figure 1.10 Corrugations in asphalt layer ... 37
Figure 1.11 Depressions in asphalt layer ... 38
Figure 1.12 Pothole distress ... 39
Figure 1.13 Categories of pavement maintenance (Johanns and Craig, 2002) ... 40
Figure 1.14 Pavement maintenance vs. time deterioration ... 41
Figure 2.1 Geotextile in road application ... 52
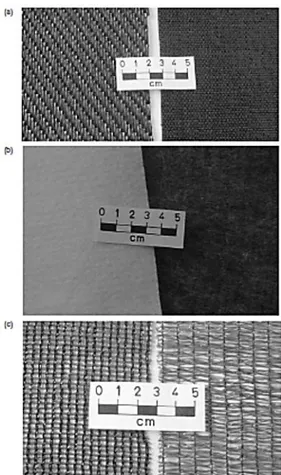
Figure 2.2 Typical geotextiles: (a) woven; (b) nonwoven; (c) knitted ... 53
Figure 2.3 Typical geogrids: (a) extruded – (i) uniaxial; (ii) biaxial; (b) welded; (c) woven. ... 54
Figure 2.4 Geogrid with interlocking phenomena (www.tenax.net) ... 55
Figure 2.5 Geocells in road application ... 56
Figure 2.6 - Geonets structure types: a) biplanar; b) triplanar. ... 57
Figure 2.7 - Geomembrane ... 57
Figure 2.8 Geocomposite (www.geofabrics.co.nz) ... 58
Figure 2.9 Separation function (Stephen Archer, 2013) ... 60
Figure 2.10 Lateral restraint reinforcement mechanism (Stephen Archer, 2013) ... 62
Figure 2.11 Improved bearing capacity mechanism(Stephen Archer, 2013) ... 63
Figure 2.12 Tensioned membrane effect ... 63
Figure 2.13 Cracking mechanism ... 66
Figure 2.14 Geosynthetic installation in asphalt layer ... 67
Figure 2.15 Separation phenomena ... 70
Figure 2.16 Load distribution in unpaved road ... 71
Figure 2.17 Tensioned membrane effect ... 73
Figure 2.18 Design chart obtain by Haas et al. (1988) ... 74
Figure 2.19 Test box used by Cancelli et al. (1996) ... 74
Figure 2.20 Result for CBR=3 by Cancelli et al. (1996) ... 75
Figure 2.21 Layer coefficient ratio vs CBR ... 76
Figure 2.22 Chang et al. (1998) laboratory test ... 77
Figure 2.23 Perkins et al. (1998) laboratory test ... 77
Figure 2.24 Various instruments used by Perkins (1999). ... 78
Figure 2.25 Result obtain by Perkins (1999) ... 78
Figure 2.26 Test in asphalt concrete beams (a) unreinforced beam (b) geogrid-reinforced beam ... 79
Figure 2.27 Laboratory section test by Wathugala et al. (1996) ... 80
Figure 2.28 Finite element mesh by Wathugala et al. (1996) ... 81
Figure 2.29 Flexural laboratory tests: (a) repeated loading four point bending; (b) permanent deformation results ... 81
Figure 2.31 Pavement section by Graziani et al. (2014) ... 83
Figure 2.32 Axisymmetric finite element model (FEM) ... 86
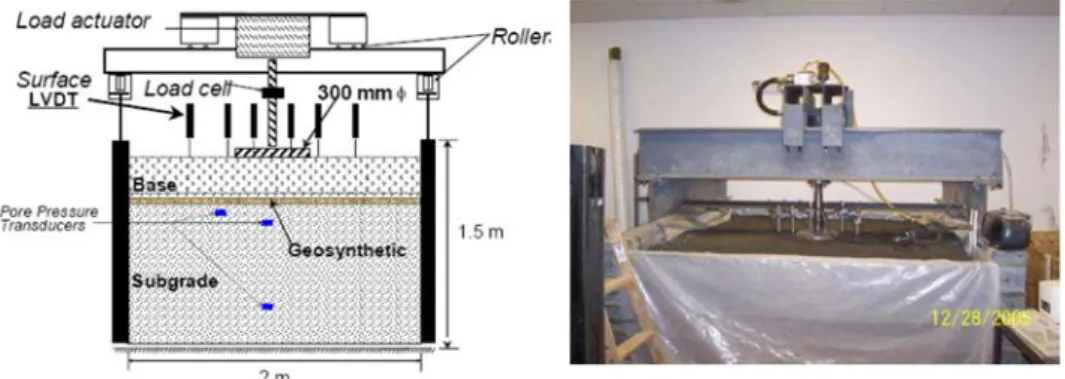
Figure 2.33 Test box and load configuration ... 88
Figure 2.34 Surface deformation with 152 mm aggregate base thicknesses ... 89
Figure 2.35 Asymmetric mesh for FEM analysis ... 90
Figure 2.36 Some results obtained by Leng and Gabr (2005) ... 90
Figure 2.37 Laboratory test box ... 91
Figure 2.38 Permanent surface deformation vs cyclic load ... 92
Figure 2.39 Laboratory test box ... 92
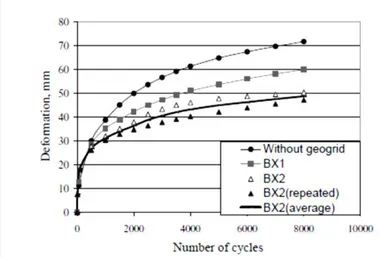
Figure 2.40 Permanent deformation vs load cycles ... 93
Figure 2.41 Numerical model with geogrid reinforcement ... 93
Figure 3.1 Rut geometry (Barenberg 1975) ... 99
Figure 3.2 Deformed shape of base course-subgrade interface (Barenberg 1975)... 100
Figure 3.3 Wheel load distribution by aggregate layer to subgrade (Giroud and Noiray 1981) ... 102
Figure 3.4 Vehicle axle and contact area (Giroud and Noiray, 1981) ... 103
Figure 3.5 Pyramidal load distribution in both unreinforced and reinforced sections (Giroud and Noiray, 1981) ... 104
Figure 3.6 Plastic zone (Giroud and Noiray 1981) ... 105
Figure 3.7 Hypothesis of subgrade incompressible ... 106
Figure 4.1 Unpaved roads design procedure by Barenberg et al. (1975): unreinforced and reinforced base aggregate thickness versus subgrade undrained shear strength, for each geogrids chosen and for a fixed allowable rut depth equal to: a) 0.025m; b) 0.075m; and c) 0,100m... 122
Figure 4.2 Unpaved roads design procedure by Barenberg et al. (1975): unreinforced and reinforced base aggregate thickness varying the subgrade undrained shear strength, for each allowable rut depth values and for a fixed geogrid tensile stiffness a) J2%=315 kN/m; b) J2%=2100 kN/m. ... 124
Figure 4.3 Unpaved roads design procedure by Barenberg et al.: unreinforced and reinforced base aggregate thickness varying the geogrid tensile stiffness, for each allowable rut depth values and for a fixed subgrade undrained shear strength a) Cu=5 kN/m2; b) Cu=35 kN/m2. ... 126
Figure 4.4 Unpaved roads design procedure by Barenberg et al.: percentage reduction of the reinforced base layer thickness varying the geogrid tensile stiffness, for each allowable rut depth values and for a fixed subgrade undrained shear strength a) Cu=5 kN/m2; b) Cu=35 kN/m2. ... 127
Figure 4.5 Unpaved roads design procedure by Barenberg et al.: unreinforced and reinforced base aggregate thickness varying the allowable rut depth values, for each geogrid tensile stiffness and for a fixed subgrade undrained shear strength equal to 5 kN/m2... 129
Figure 4.6 Unpaved roads design procedure by Barenberg et al.: percentage reduction of the reinforced base layer thickness varying the allowable rut depth values, for each geogrid tensile stiffness and for a fixed subgrade undrained shear strength equal to 5 kN/m2 ... 129
Figure 4.7 Unpaved roads design procedure by Barenberg et al.: unreinforced and reinforced base aggregate thickness varying the allowable rut depth values, for each subgrade undrained shear strength and for a fixed geogrid tensile stiffness equal to 2100 kN/m ... 130
Figure 4.8 Unpaved roads design procedure by Barenberg et al.: unreinforced and reinforced base aggregate thickness varying the geogrid tensile stiffness, for each subgrade undrained shear strength and for a fixed allowable rut depth values equal to 0.100 m ... 130
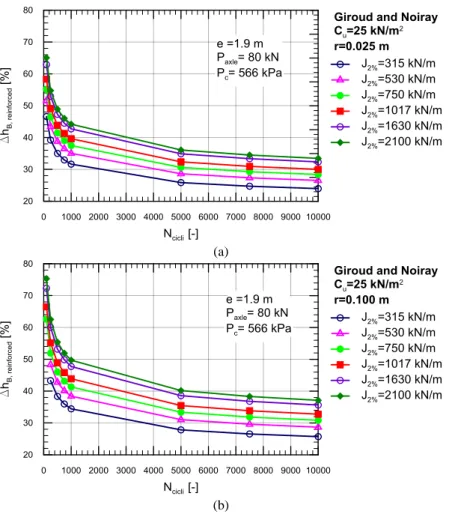
Figure 4.9 Unpaved roads design procedure by Giroud and Noiray: unreinforced and reinforced base aggregate thickness versus number of wheel passes for a fixed value subgrade undrained shear strength (Cu=25 kN/m2) and for each geogrids chosen, when the allowable rut depth is: a) 0.025 m; b) 0.1 m. ... 132
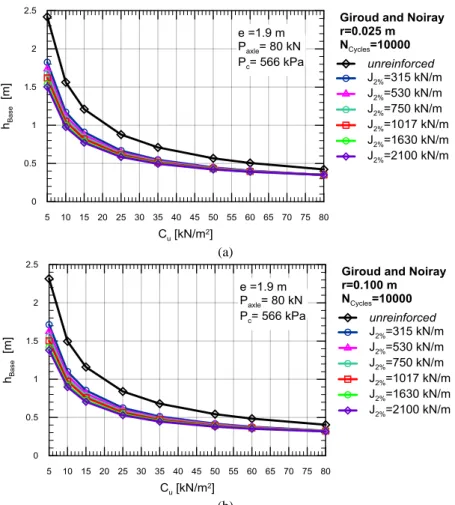
Figure 4.10 Unpaved roads design procedure by Giroud and Noiray (1981): percentage reduction of base aggregate thickness versus number of wheel passes for a fixed value subgrade undrained shear strength (Cu=25 kN/m2) and for each geogrids chosen, when the allowable rut depth is: a) 0.25 m; b) 0.1m;. ... 133 Figure 4.11 Unpaved roads design procedure by Giroud and Noiray (1981) : unreinforced and reinforced base aggregate thickness versus number of wheel passes for a fixed value of the allowable rut depth and for each geogrids chosen, when the subgrade undrained shear strength is: a) Cu=5 kN/m2; b) Cu=35 kN/m2; c) Cu=80 kN/m2. ... 135 Figure 4.12 Unpaved roads design procedure by Giroud and Noiray (1981) : unreinforced and reinforced base aggregate thickness versus subgrade undrained shear strength, at the same traffic conditions (Ncycles=10000), for each geogrids chosen and for extremal allowable rut depth values: a) r= 0.025m; b) 0.100m. ... 137 Figure 4.13 Unpaved roads design procedure by Giroud and Noiray (1981) : unreinforced and reinforced base aggregate thickness varying the subgrade undrained shear strength, for each allowable rut depth values and for a fixed geogrid tensile stiffness a) J2%=315 kN/m; b) J2%=2100 kN/m. ... 139
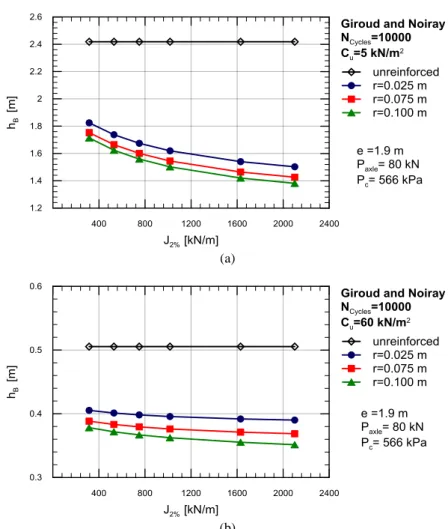
Figure 4.14 Unpaved roads design procedure by Giroud and Noiray (1981) unreinforced and reinforced base aggregate thickness varying the geogrid tensile stiffness, at the same traffic conditions (Ncycles=10000),
for each allowable rut depth values and for a fixed subgrade undrained shear strength a) Cu=5 kN/m2; b) Cu=60 kN/m2. ... 141 Figure 4.15 Unpaved roads design procedure by Giroud and Noiray (1981) percentage reduction of reinforced base aggregate thickness varying the geogrid tensile stiffness, at the same traffic conditions (Ncycles=10000), for each allowable rut depth values and for a fixed subgrade undrained shear strength a)
Cu=5 kN/m2; b) ) Cu=60 kN/m2. ... 142 Figure 4.16 Unpaved roads design procedure by Giroud and Noiray (1981) : unreinforced and reinforced base aggregate thickness varying the allowable rut depth values, at the same traffic conditions (Ncycles=10000),for each geogrid tensile stiffness and for a fixed subgrade undrained shear strength equal to
5 kN/m2... 144 Figure 4.17 Unpaved roads design procedure by Giroud and Noiray (1981): percentage reduction of the reinforced base layer thickness varying the allowable rut depth values, at the same traffic conditions (Ncycles=10000), for each geogrid tensile stiffness and for a fixed subgrade undrained shear strength equal to
5 kN/m2... 145 Figure 4.18 Unpaved roads design procedure Giroud and Noiray (1981): unreinforced and reinforced base aggregate thickness varying the allowable rut depth values, at the same traffic conditions (Ncycles=10000),
for each subgrade undrained shear strength and for a fixed geogrid tensile stiffness equal to 2100 kN/m . 145 Figure 4.19 Unpaved roads design procedure by Giroud and Noiray (1981): unreinforced and reinforced base aggregate thickness varying the geogrid tensile stiffness, at the same traffic conditions (Ncycles=10000),
for each subgrade undrained shear strength and for a fixed allowable rut depth values equal to 0.100 m .. 145 Figure 4.20 Comparison between Barenberg et al. (1975) et al. and Giroud and Noiray (1981) (Ncycles,G-N=
100) unpaved roads design procedure: Iso-rutting curves relating to the reinforced base aggregate thickness varying reinforcement stiffness, at the same traffic conditions (NcyclesG-N=100) and subgrade undrained shear strength (at Cu = 5 kN/m2 )and for each allowable rut depth ... 148
Figure 4.21 Comparison between Barenberg et al. (1975) et al. and Giroud and Noiray (1981) (Ncycles,G-N=
100) unpaved roads design procedure: Iso-rutting curves Base Course Reduction factor (BCR) varying reinforcement stiffness, at the same traffic conditions (NcyclesG-N=100) and subgrade undrained shear
strength (at Cu = 5 kN/m2 ). ... 148 Figure 4.22 Comparison between design procedures proposed by Barenberg et al. (1975) et al. and by Giroud and Noiray (1981) : a) influence of rut depth; b) influence of the reinforcement tensile stiffness; c) influence of the undrained subgrade shear strength. ... 150
Figure 4.23 Comparison between design procedures proposed by Barenberg et al. (1975) et al. and by Giroud and Noiray (1981) in term Performance Index (PI). ... 151 Figure 4.24 Unpaved roads design procedure by Giroud and Han: unreinforced and reinforced base aggregate thickness versus number of wheel passes for fixed value of Subgrade CBR ( CBRs=1%) and for each geogrids chosen, when the allowable rut is: a) 0.050 m; b) 0.075m; c) 0.100 m. ... 153 Figure 4.25 Unpaved roads design procedure by Giroud and Han: percentage reduction of the reinforced base layer thickness versus number of wheel passes for fixed value of Subgrade CBR ( CBRs=1%) and for each geogrids chosen, when the allowable rut is: a) 0.050 m; b) 0.075m;c) 0.100 m. ... 155 Figure 4.26 Unpaved roads design procedure by Giroud and Han: unreinforced and reinforced base aggregate thickness versus allowable rut depth for fixed value of subgrade CBR (CBRs=1%) and the number of wheel passes (Ncycles=10000) and for each geogrids chosen. ... 157
Figure 4.27 Unpaved roads design procedure by Giroud and Han: percentage reduction of the reinforced base layer thickness versus allowable rut depth for fixed value of subgrade CBR (CBRs=1%) and the number of wheel passes (Ncycles=10000) and for each geogrids chosen. ... 157
Figure 4.28 Unpaved roads design procedure by Giroud and Han: unreinforced and reinforced base aggregate thickness versus geogrid aperture stability modulus for fixed value of subgrade CBR (CBRs=1%) and the number of wheel passes (Ncycles=10000) and for each allowable rut depth chosen. ... 159
Figure 4.29 Unpaved roads design procedure by Giroud and Han: percentage reduction of the reinforced base layer thickness versus geogrid aperture stability modulus for fixed value of subgrade CBR (CBRs=1%) and the number of wheel passes (Ncycles=10000) and for each allowable rut depth chosen. ... 160
Figure 4.30 Unpaved roads design procedure by Giroud and Han: unreinforced and reinforced base aggregate thickness versus subgrade CBR at the same value of allowable rut depth (r=0.075m) for each geogrids chosen and at the same number of wheel passes: a) Ncycles= 100; b) Ncycles= 1000; c) Ncycles= 10000.
... 161 Figure 4.31 Unpaved roads design procedure by Leng and Gabr: unreinforced and reinforced base aggregate thickness versus number of wheel passes for fixed value of Subgrade CBR ( CBRs=1%) and for each geogrids chosen, when the allowable rut is: a) 0.050 m; b) 0.075m; c) 0.100 m. ... 164 Figure 4.32 Unpaved roads design procedure by Leng and Gabr (2005): percentage reduction of the reinforced base layer thickness versus number of wheel passes for fixed value of Subgrade CBR ( CBRs=1%) and for each geogrids chosen, when the allowable rut is: a) 0.050 m; b) 0.075m; c) 0.100 m. 165 Figure 4.33 Unpaved roads design procedure by Leng and Gabr: unreinforced and reinforced base aggregate thickness versus allowable rut depth for fixed value of subgrade CBR (CBRs=1%) and the number of wheel passes (Ncycles=10000) and for each geogrids chosen. ... 167
Figure 4.34 Unpaved roads design procedure by Leng and Gabr: percentage reduction of the reinforced base layer thickness versus allowable rut depth for fixed value of subgrade CBR (CBRs=1%) and the number of wheel passes (Ncycles=10000) and for each geogrids chosen. ... 167
Figure 4.35 Unpaved roads design procedure by Leng and Gabr: unreinforced and reinforced base aggregate thickness versus geogrid tensile load at 2% of deformations, for fixed value of subgrade CBR (CBRs=1%) and the number of wheel passes (Ncycles=10000) and for each allowable rut depth chosen. ... 169
Figure 4.36 Unpaved roads design procedure by Leng and Gabr: percentage reduction of the reinforced base layer thickness versus geogrid tensile load at 2% of deformations, for fixed value of subgrade CBR (CBRs=1%) and the number of wheel passes (Ncycles=10000) and for each allowable rut depth chosen. ... 170
Figure 4.37 Unpaved roads design procedure by Leng and Gabr: unreinforced and reinforced base aggregate thickness versus subgrade CBR at the same value of allowable rut depth (r=0.075m) for each geogrids chosen and for a number of wheel passes equal to: a) 100; b) 1000; c) 10000. ... 171 Figure 4.38 Comparison between Giroud and Han and Leng and Gabr unpaved road design procedures: reinforced base aggregate thickness versus number of wheel passes for fixed value of Subgrade CBR (
CBRs=1%) and for extremal values of geogrids’ mechanical properties, when the allowable rut depth is
0.075 m ... 173
Figure 4.39 Comparison between Giroud and Han and Leng and Gabr unpaved road design procedures: unreinforced and reinforced base aggregate thickness reduction versus number of wheel passes for fixed value of Subgrade CBR ( CBRs=1%) and for each geogrids chosen, when the allowable rut depth is 0.075 m ... 173
Figure 4.40 Comparison between Giroud and Han and Leng and Gabr unpaved road design procedures: reinforced base aggregate thickness reduction versus allowable rut depth, at the same traffic conditions (Ncyles=1000), for fixed value of Subgrade CBR (CBRs=1%) and for each geogrids chosen ... 173
Figure 4.41 Comparison between Giroud and Han and Leng and Gabr unpaved road design procedures: reinforced base aggregate thickness reduction varying the geogrids’ mechanical properties, at the same traffic conditions (Ncyles=1000) and allowable rut depth and for each Subgrade CBR chosen ... 174
Figure 4.42 Comparison between Giroud and Han and Leng and Gabr unpaved road design procedures in term Performance Index (PI). ... 175
Figure 4.43 Comparison between theoretical results obtained by above procedures and experimental field data obtained by Fannin (1966). ... 175
Figure 4.44 ABAQUS modules... 178
Figure 4.45 Unpaved road system created in ABAQUS CAE ... 180
Figure 4.46 Geogrid element realized in part module... 181
Figure 4.47 Yield surface in Drucker-Pracker model ... 182
Figure 4.48 Geogrid placed at the top of subgrade in assembly module ... 184
Figure 4.49 Load pressure applied ... 185
Figure 4.50 Loading pattern used to traffic load simulation ... 186
Figure 4.51 Load area and boundary conditions ... 186
Figure 4.52 Element families in ABAQUS ... 187
Figure 4.53 Linear and quadratic elements ... 187
Figure 4.54 Element mesh for base course and subgrade ... 188
Figure 4.55 Element mesh for geogrid ... 188
Figure 4.56 Vertical surface displacements computed using finite element analysis for unreinforced test section... 189
Figure 4.57 Vertical surface displacements computed using finite element analysis for reinforced test section... 190
Figure 4.58 Geogrid configuration after 500 traffic load ... 190
List of tables
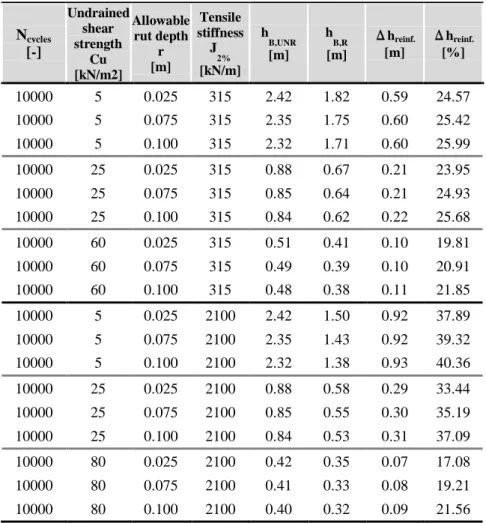
Table 1.1 Type of inventory data ... 46 Table 2.1 Geosynthetic products most used. ... 51 Table 4.1 Design parameters of Barenberg et al. (1975) design method ... 121 Table 4.2 Results of Barenberg et al. (1975) unpaved roads design procedure in terms of unreinforced and reinforced base aggregate thickness, reduction and percentage reduction of the reinforced base layer thickness, for extreme values of geogrid tensile stiffness and allowable rut depth and varying the subgrade undrained shear strength ... 123 Table 4.3 Results of Barenberg et al. (1975) unpaved roads design procedure in terms of unreinforced and reinforced base aggregate thickness and reduction and percentage reduction of the reinforced base layer thickness, for extreme values of geogrid tensile stiffness and varying the subgrade undrained shear strength and allowable rut depth. ... 125 Table 4.4 Results of Barenberg et al. unpaved roads design procedure in terms of unreinforced and reinforced base aggregate thickness, reduction and percentage reduction of the reinforced base layer thickness, for extreme values of geogrid tensile stiffness for each and allowable rut depth and for the subgrade undrained shear strength equal to 5 kN/m2 and 35 kN/m2. ... 128 Table 4.5 Design parameters of Giroud and Noiray (1981) design method ... 132 Table 4.6 Results of Giroud and Noiray (1981) unpaved roads design procedure in terms of: unreinforced and reinforced base aggregate thickness and percentage reduction of the reinforced base layer thickness, when the subgrade undrained shear strength is equal to 25 kN/m2 and varying the number of wheel passes. The limit values of allowable rut depth and the geogrids’ tensile stiffness were selected... 134 Table 4.7 Results of Giroud and Noiray (1981) unpaved roads design procedure in terms of: unreinforced and reinforced base aggregate thickness and percentage reduction of the reinforced base layer thickness, at the same values of allowable rut depth equal to 0.075 m, varying the number of wheel passes and the subgrade undrained shear strength. The limit values of geogrids’ tensile stiffness the were selected. ... 136 Table 4.8 Results of Giroud and Noiray (1981) unpaved roads design procedure in terms of unreinforced and reinforced base aggregate thickness, absolute reduction and percentage reduction of the reinforced base layer thickness, at the same traffic conditions (Ncycles=10000), for extreme values of geogrid tensile stiffness and allowable rut depth and varying the subgrade undrained shear strength ... 138 Table 4.9 Results of Giroud and Noiray (1981) et al. unpaved roads design procedure in terms of unreinforced and reinforced base aggregate thickness, absolute and percentage reduction of the reinforced base layer thickness , at the same traffic conditions (Ncycles=10000), for extremal values of geogrid tensile stiffness and varying the subgrade undrained shear strength and allowable rut depth. ... 140 Table 4.10 Results of Giroud and Noiray (1981) unpaved roads design procedure in terms of unreinforced and reinforced base aggregate thickness, reduction and percentage reduction of the reinforced base layer thickness, at the same traffic conditions (Ncycles=10000), for extreme values of geogrid tensile stiffness for
each and allowable rut depth and for the subgrade undrained shear strength equal to 5 kN/m2 and 60 kN/m2. ... 143 Table 4.11 Design parameters ... 146 Table 4.12 Results of Barenberg et al. (1975) et al. and Giroud and Noiray (1981) unpaved roads design procedures in terms of unreinforced and reinforced base aggregate thickness, reduction and percentage reduction of the reinforced base layer thickness, at the same traffic conditions (Ncycles G-N =100), for each
geogrid tensile stiffness and allowable rut depth when the subgrade undrained shear strength is equal to 5 kN/m2. ... 149 Table 4.13 Design parameters of Giroud and Han (2004) design method ... 152
Table 4.14 Results of Giroud and Han unpaved roads design procedure in terms of: unreinforced and reinforced base aggregate thickness and percentage reduction of the reinforced base layer thickness, when the subgrade CBR is equal to 1.0% and varying the number of wheel passes, the allowable rut depth and the geogrids’ aperture stability modulus ... 156 Table 4.15 Results of Giroud and Han unpaved roads design procedure in terms of unreinforced and reinforced base aggregate thickness and percentage reduction of the reinforced base layer thickness, when the subgrade CBR is equal to 1.0% and varying the number of wheel passes, the allowable rut depth and the geogrids’ aperture stability modulus ... 158 Table 4.16 Mechanical properties of the geogrids, commercially available, used in Leng and Gabr (2005) design procedures. ... 163 Table 4.17 Design parameters of Leng and Gabr (2005) design method ... 163 Table 4.18 Results of Leng and Gabr unpaved roads design procedure in terms of: unreinforced and reinforced base aggregate thickness and percentage reduction of the reinforced base layer thickness, when the subgrade CBR is equal to 1.0% and varying the number of wheel passes, the allowable rut depth and the geogrids’ aperture stability modulus ... 166 Table 4.19 Results of Leng and Gabr unpaved roads design procedure in terms of unreinforced and reinforced base aggregate thickness and percentage reduction of the reinforced base layer thickness, when the subgrade CBR is equal to 1.0% and varying the number of wheel passes, the allowable rut depth and the geogrids’ aperture stability modulus ... 168 Table 4.20 Mechanical properties of the geogrids, commercially available, used in design procedures. ... 172 Table 4.21 Mechanical characteristics using for unpaved section ... 183
Introduction
In the last decades geosynthetics have been proposed and used as reinforcement for paved and unpaved roads in order to improve the performance and/or to allow for the reduction of the base course thickness.The technique of soil-improvement using geosynthetics is extensively used in the construction of unpaved roads. Unpaved roads are usually used for temporary roads and they remain in service for only short periods (often less than 1 year), and are subjected to low volume traffic (less than 10000 load applications). Unpaved roads typically consist of an aggregate layer resting on the subgrade. When the subgrade is weak, due to its poor consistency and high compressibility, generally, a geosynthetic reinforcement is placed at the base/subgrade interface to improve the road performance.
The use of a geosynthetic as reinforcement material in the unpaved roads base course layer has been shown to improve the performance in terms of increased pavement service life, reductions in the base course thickness, rut depth and fatigue strain.
For properly designed unpaved roads, improvement is typically seen for all rut depths in addition to rut depths that make the pavement inoperable. Geosynthetics used in unpaved road are essentially geotextiles and geogrids.
The improvement has been attributed mainly to the prevention of lateral restraint of the aggregate base course. The interaction between the geosynthetic and the aggregate base course (interlocking) are required to prevent lateral spreading of base course soil. For this reason, geogrids offer a greater improvement in performance as compared to geotextiles.
The effect of interlocking with aggregate offered by a geogrid minimizes the lateral movement of aggregate particles and increases the modulus of the base course, which leads to a wider vertical stress distribution over the subgrade and consequently a reduction of vertical subgrade deformations. The degree of interlocking depends on the relationship between the geogrid aperture size and the aggregate particle size; the geogrid aperture shape; the ribs shape and stiffness. The effectiveness of interlocking depends on the in-plane stiffness (more than strength) of the geogrid and the stability of the geogrid ribs and junctions. Two are the main reinforcement mechanisms in unpaved roads: lateral confinement effect and tension membrane effect. They require different depth values of rutting in order to be mobilized. At small permanent deformation magnitudes, the lateral restraint mechanism is developed by the ability of the base aggregate to interlock with the geogrid. As the permanent deformations increase the tension membrane mechanism develops. If the geosynthetic has a sufficiently high tensile modulus, tensile stresses will be mobilized in the reinforcement, and a vertical component of this tensile membrane resistance will help to support the applied wheel loads.
In Chapter 1 of the present thesis the road pavement degradation in time has been talked about, highlighting the importance of the maintenance operation which should be planned and frequently done on the paved roads.
In Chapter 2 several geosynthetics types employed for civil engineering applications have been presented, focusing on those used for roads pavement, and the reinforce mechanisms offered by the
presence of geosynthetics in road pavement have been discussed. Therefore the researches and studies available in literature on the reinforcement of road pavement by means of geosynthetic have been briefly described.
In Chapter 3 several methods for the design of reinforced through geosynthetics unpaved roads have been reported and analyzed in details. All the considered methods aim at the determination of the base course layer thickness for an unpaved road. The phases to develop the model and to obtain as a result the base course layer thickness required for unpaved road have been schematized for the Barenberg (1975), Giroud and Noiray (1981), Giroud and Han (2004) and Leng and Gabr (2005) methods.
In Chapter 4 the previously described methods have been implemented in Matlab environment considering different values for the input variables. The obtained results have been then plotted in graphs aiming at better analyzing and understanding the reinforce mechanism taken into account for by each method, so to evaluate the improvement offered by the presence of the reinforcement in terms of surface vertical displacement reduction.
Furthermore it has been possible to evaluate the variables effect on the models and assess the reinforcement importance and the functionality.
Finally an unpaved road reinforced by a geogrid has been modelled through a 3D FEM model using the ABAQUS software.
A comparison has been done between an unreinforced road section and the same road section reinforced thanks to the presence of a geogrid in order to evaluate the improvement offered by the geogrid in terms of superficial rut reduction under the cyclic load.
C
HAPTER1
C
HAPTER1
1. Pavement Deterioration and Pavement Management System
1.1. Importance of road in modern societyTransportation infrastructure plays a vital role in the economic, social, and state of all countries and this role cannot be neglected. Roads are important infrastructures that play a very efficient role in populations’ development, allowing the easy mobility of people and goods. This mobility create a better access to jobs, health, education, resources and markets, among other amenities, supporting the growth of quality of life and reducing poverty. The importance of roadways can be reassumed in the followings points:
1. Allow a comfortable, fast and cheap way to travel from one place to another;
2. Connect several different places not only inside the cities, shortening their distance, but also between cities as well as between different countries, easing the mobility of people; 3. Have a strong impact on the economic growth, due to the fact that roads promote tourism
and supply a quick way for the distribution and trading of goods.
Transportation has always played an important role in influencing the formation of urban societies. Although other facilities like availability of food and water, played a major role, the contribution of transportation can be seen clearly from the formation, size and pattern, and the development of societies, especially urban centers. In fact, people depend upon the natural resources to satisfy the needs of life but due to non uniform surface of earth and due to difference in local resources, there is a lot of difference in standard of living in different societies. So, there is an immense requirement of transport of resources from one particular society to other. These resources can range from material things to knowledge and skills.
The quality and efficiency of road surface affects the quality of life, the health of the social system and the continuity of economic and business activities, but road pavement surface exhibits distresses due to their constant usage.
If an appropriate maintenance policy is not applied, the road security quality can be compromised of the road pavement surface degrades. Road pavement surfaces are often composed by asphalt, although there may be other types, like unpaved road with an unbound aggregate base course as surface. So, Several distinct types of pavement can be identified, based on their structure.
The primary functions of a pavement system are to provide a reasonably smooth riding surface that was essential for riding comfort, and over the years it has become the measure of how road users perceive a road. Roughness can arise from a number of causes, most often however it is from pavement distress due to structural deformation. In addition to a smooth riding surface the pavement must provide adequate surface friction, especially during wet conditions it can be linked to a loss of surface friction between the tire and the pavement surface. A pavement must therefore provide sufficient surface friction and texture to ensure road user safety under all conditions.
Pavements are complex structures involving many variables, such as materials, construction, loads, environment, performance, maintenance, and economics. Thus, various technical and economic factors
must be well understood to design pavements, to build pavements, and to maintain better pavements. Moreover, the problems relating to road maintenance are still more complex due to the dynamic nature of road networks where elements of the network are constantly changing, being added or removed. These elements deteriorate with time and have to, therefore be maintained in good condition and it requires substantial expenditure. Moreover, the preparation and evaluation of the best ways to direct this expenditure is an extremely difficult task due to many factors that affect the deterioration of these elements.
Hence, the maintenance of road networks is an essential task to ensure the correct pavement performance, taking into account all the principles involved in its project, resulting in loss of asset value, poor quality of service and failure to provide access to affected areas (like cities, villages, among others) in case of neglected maintenance policies. To this end, good maintenance policies of road networks are required, relying on adequate management of rehabilitation procedures (Muhamma Mubarak,2010).
There are also many negative effects of transportation. There are three principal categories into which the environmental effects have been categorized:
- Safety;
- Pollution (noise, air);
- Energy consumption.
1.2. Factors affecting pavement system
There are many factors that affect pavement design which can be classified into four categories as drainage, environmental, traffic and loading and subgrade .
1.2.1. Drainage
Moisture sources are typically rainwater, runoff and high groundwater. These sources are prevented from entering the pavement structure or accumulating in the subgrade through surface drainage and subsurface drainage. This factor is important and have a significant impact on the pavement condition, in particular on the urban network, in fact the availability of a drainage system can affect the condition of a pavement.
Correct drainage is important to ensure a high quality long lived pavement; moisture accumulation in any pavement structural layer can cause problems. Moisture in the subgrade and aggregate base layer can weak these materials by increasing pore pressure and reducing the materials’ resistance to shear. Additionally, some soils expand when moist, causing many deteriorations.
Excess moisture presence in pavement structures usually results in accelerated pavement distresses, In particular when combined with heavy axle loads. Both fiel observations and laboratory based research studies have shown that proper drainage can greatly improve pavement performance and increase its service life.
It is expected that pavement sections with a drainage system will have a better condition than pavement sections without a drainage system.
1.2.2. Environmental
Pavement structures and environment are in continuous interaction. Environmental conditions have been found to exert significant impact on the performance of flexible pavements.
The environment factors in pavement system can be divided in:
1) External factors: such as precipitation, temperature, humidity, freeze-thaw cycles, and depth of water table are the main environmental factors that exerted principal influences on the pavement system performance.
2) Internal factors: such as the susceptibility of the pavement materials to moisture and freeze-thaw damage, infiltration potential of the pavement.
These parameters undergo daily and seasonal variations as well as a spatial distribution as they are interconnected to the constantly evolving environment that surrounds the pavement system. The two main environmental factors in pavement engineering are temperature and moisture content.
Both internal and external factors are associated with the seasonal variation.
The effect of environmental conditions on performance can be broken in two separate categories: • weather conditions when the marking is placed
• year-round climate.
Each of the above factors may affect marking performance. Air and pavement temperatures are important because most pavement marking materials require a minimum temperature for proper drying or curing. Humidity also affects the drying and curing times. Wind velocity affects drying times, but more importantly it affects the on bead dispersion. Strong winds can prevent a high percentage of the drop-on beads from uniformly reaching the binder material. Pavement surface moisture at the time of applicatidrop-on can have a severe effect on the bonding capabilities of the marking material to the pavement surface. Most materials require that the pavement surface be devoid of surface moisture prior to application to achieve bonding. Year-round climatic conditions can also affect the long-term performance of a pavement materials. Area that receive heavy snowfall are often exposed to heavy abrasion on their pavement markings due to snowplow, sanding, and chemical activity. States in sun-belt regions due to intense ultraviolet exposure may experience color fading and cracking of certain pavement marking materials (Lopez, 2004).
1.2.3. Traffic and loading
Traffic loading is considered as the primary factor that affects both pavement design and performance. The performance of pavements is mostly influenced by the loading magnitude, configuration and the number of load repetitions by heavy vehicles. The service lives of nearly all pavement marking materials are decreased when exposed to higher traffic volumes. Under extremely high-traffic conditions or other locations where a high number of wheel hits on the markings are likely to occur, such as weaving areas or transverse markings, materials of the utmost durability are desirable.
Loads are the vehicle forces exerted on the pavement (e.g., by trucks, heavy machinery, airplanes). Since one of the primary functions of a pavement is load distribution, pavement design must account for the
expected lifetime traffic loads. Traffic loading, the vehicle forces exerted on the pavement (e.g., by trucks, heavy machinery, airplanes), include tire loads, axle and tire configurations, load repetition, traffic distribution across the pavement and vehicle speed.
Tire loads are the fundamental loads at the actual tire-pavement contact points. For most pavement analyses, it is assumed that the tire load is uniformly applied over a circular area. Moreover, it is generally assumed that tire inflation and contact pressures are the same.
Generally, the design of the roadways requires that the areas of influence of wheels loads is no longer relating to two isolated single tire, but rather the combined effect of all the interacting tire load. Of course, slower speeds and stop conditions allow a particular load to be applied to a given pavement area for a longer period of time resulting in greater damage.
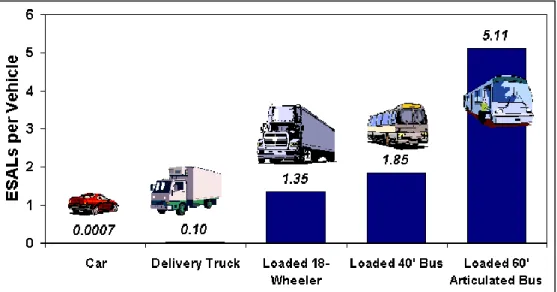
The damage caused per pass to a pavement by an axle is defined relative to the damage per pass of a standard axle load, which is defined as an 80 kN single axle load. This approach converts wheel loads of various magnitudes and repetitions to an equivalent number of “standard” or “equivalent” loads based on the amount of damage they do to the pavement. The commonly used standard load is the 18,000 lb. equivalent single axle load. Using the ESAL method, all loads are converted to an equivalent number of 18,000 lb. single axle loads and this number is then used for design. A “load equivalency factor” (Figure 1.1) represents the equivalent number of ESALs for the given weight-axle combination.
Thus, a pavement is designed to withstand a certain number of standard axle load repetitions that will result in a certain terminal condition of deterioration. Since loadings are one of the most important factors that affects damages of most pavement section, it is often used as an independent variable in developed condition prediction equations.
Figure 1.1 Load equivalency factor (www.pavementinteractive.org)
1.2.4. Subgrade
The “subgrade” is the in situ material upon which the pavement structure is placed. The subgrade is the underlying soil that supports the applied wheel loads. If the subgrade is too weak to support the wheel
loads, the pavement system will flex excessively which ultimately causes the pavement to fail. If natural variations in the composition of the subgrade are not adequately addressed by the pavement design, significant differences in pavement performance will be experienced, so it can often be the overriding factor in pavement system performance. Properties of the subgrade soil and its water content are not directly considered in assessing the performance or serviceability of pavements. However was recognize that the increased water content in subgrade soils (especially the cohesive ones) combined with increased traffic volumes and loads often leads to premature pavement distresses. Subgrade strength has the greatest effect in determining pavement thickness, weaker subgrades require thicker layers in pavement system to adequately bear traffic loads. A subgrade’s strength generally depends on two interrelated characteristics:
- Load bearing capacity: the subgrade must be able to support loads transmitted from the pavement structure. This load bearing capacity is often affected by degree of compaction, moisture content, and soil type. A subgrade that can support a high amount of loading without excessive permanent deformation is considered good.
- Volume changes: most soils undergo some amount of volume change when exposed to excessive moisture or freezing conditions. Some clay soils shrink and swell depending upon their moisture content, while soils with excessive fines may be susceptible to frost heave in freezing areas.
Subgrade materials are typically characterized by their resistance to deformation under load. In general, the more resistant to deformation a subgrade is, the more load it can support before reaching a critical deformation value. There are two basic subgrade stiffness/strength characterizations commonly used:
- California bearing ratio (CBR): a simple test that compares the bearing capacity of a material with that of a well-graded crushed stone (thus, a high quality crushed stone material should have a CBR of about 100%). The CBR rating was developed for measuring the load-bearing capacity of soils used for building roads but it can also be used for measuring the load-bearing capacity of airstrips. The harder the surface, the higher the CBR rating. A CBR of 3 equates to tilled farmland, a CBR of 4.75 equates to turf or moist clay, while moist sand may have a CBR of 10. High quality crushed rock has a CBR over 80. The standard material for this test is crushed California limestone which has a value of 100, meaning that it is not unusual to see CBR values of over 100 in well compacted areas.
- Resilient Modulus (Mr) is a fundamental material property used to characterize unbound pavement materials. It is a measure of material stiffness and provides a mean to analyze stiffness of materials under different conditions, such as moisture, density and stress level. A material’s resilient modulus is actually an estimate of its modulus of elasticity (E). While the modulus of elasticity is stress divided by strain for a slowly applied load, resilient modulus is stress divided by strain for rapidly applied loads (cyclic loads), like those experienced by pavements.
Resilient modulus is determined using the cyclic triaxial test. The test applies a repeated axial cyclic stress of fixed magnitude (amplitude) and load cycle duration (frequency) to a cylindrical test
specimen. While the specimen is subjected to this dynamic cyclic stress, it is also subjected to a static confining stress provided by a triaxial pressure chamber. It is essentially a cyclic version of a triaxial compression test; the cyclic load application is thought to more accurately simulate actual traffic loaging.
1.3. Pavement deterioration
Pavement deterioration is the process by which defects develop in the pavement under the combined effects of traffic loading and environmental conditions. Deterioration of pavement greatly affects on serviceability, safety, and riding quality of the road. After construction, roads deteriorate with age as a result of use and therefore, they need to be maintained to ensure that the requirements for safety, efficiency and durability are satisfied. Typically, pavement deteriorates at an ever-increasing rate. .Normally, new paved roads deteriorate very slowly in the first ten to fifteen years of their life and the pavement stays in relatively good condition, but as it ages more distresses develop with each distress making it easier for subsequent distresses to develop. Therefore, deterioration of asphalt pavements can also be due to factors that go beyond just normal wear and tear causing premature deterioration. The premature deterioration of asphalt pavement is usually due to failures in construction or human error. This can be due to a number of factors including:
- insufficient or improperly compacted base below the asphalt; - over or under compaction of asphalt;
- improper temperature of asphalt when applied; - poor drainage;
Pavement surface distresses can be divided using four classes. For each class several distress types can be considered, and for almost all distress types several criteria and parameters (some quantitative and others of qualitative nature), are used to grade them into severity levels but in some cases, only the distress type is important to record, as grading them into severity levels is not relevant.
The five classes considered for distresses are: - Cracking;
- Surface deformation; - Disintegration; - Surface defects; 1.3.1. Cracking
Cracking is the most common distress class that appears in asphalt pavement surfaces roads (Hot-Mix Asphalt, HMA) and for this reason in many countries, the cracking performances are incorporated into pavement road design and maintenance systems. The causes are due mainly to the fatigue of the asphaltic pavement layers but other important causes include: adverse atmospheric conditions (shrinkage due to extremely low atmospheric temperatures); bad quality in the asphaltic mixtures production; weakness in the structural pavement resistance.
Cracking distresses can be subdivided into five types: 1) Fatigue cracking
2) Longitudinal cracking 3) Transverse cracking 4) Block cracking 5) Reflective cracking
1.3.1.1. Fatigue cracking
Fatigue cracking (Figure 1.2) is the principal structural distress which occurs in asphalt pavements with granular and weakly stabilized bases. It is a single crack or a series of interconnected cracks caused by fatigue failure of the asphalt concrete and it is commonly called alligator cracking. An important parameter associated with this crack type is the mesh width. This type of cracking is a consequence of a cracking ramification process, since the evolution of several isolated cracks comes to make several connections among themselves over time.
Factors which influence the development of alligator cracking are: - the number and magnitude of applied loads;
- the structural design of the pavement like layer materials and thicknesses; - the quality and uniformity of foundation support;
- the air voids;
- the climate of the site.
Alligator Cracking is measured in square feet. The major difficulty in measuring this type of distress is that more levels of severity often exist within one distressed area. Different criteria are used for the classification of alligator cracking into severity levels. Three severity levels can be defined according to the cracks width and the presence of degraded edges. The three levels of classification are:
1. low severity level, for alligator pattern cracking with crack widths lower than 2 mm; 2. moderate severity level, for alligator pattern cracking with crack widths higher than 2 mm
and an initial state of degraded edges;
3. high severity level, for alligator pattern cracking with crack widths higher than 2 mm, plus degraded edges or the beginning of potholes formation.
The causes of fatigue cracking are the repetitive traffic loads and high deflection often due to wet bases or subgrade but also maybe present anywhere in the lane due to traffic wander. Alligator cracking may progress further, In particular in areas where the support is weakest to potholes and localized failures.
Figure 1.2 Fatigue cracking
1.3.1.2. Longitudinal Cracking
Longitudinal cracks (Errore. L'origine riferimento non è stata trovata.Figure 1.3) are long racks that usually occur near the pavement shoulder or sometimes near the pavement centerline. Longitudinal cracks are usually caused by fatigue failure under repeated traffic loading and it can consist of a single crack or as a series of parallel cracks.. In thin pavements, cracking starts at the bottom of the bituminous layer where the tensile stress is the highest and then it spreads to the surface as one or more longitudinal cracks. Understanding the cause of this phenomena is critical to selecting the proper repair. Multiple parallel cracks may be eventually formed by the initial crack. The principal causes for this phenomena are:
- The reflection of a crack or joint in the road pavement; - Poorly constructed joints in the asphalt surface; - Asphalt hardening;
- Diurnal temperature fluctuations.
Location within lane is significant to understand the phenomena
There are two types of longitudinal cracking: wheel path and non-wheel path longitudinal cracking. While wheel path Longitudinal cracking may also be produced in the wheel paths by the application of heavy loads or high tire pressures. Non-wheel path longitudinal cracking in an asphalt pavement, instead ,may reflect up from the edges of an underlying old pavement or from edges and cracks in a stabilized base, or may be due to poor compaction at the edges of longitudinal paving lanes.
Should be noted that only wheel path longitudinal cracking should be considered along with alligator cracking in assessing the extent of load-related damage.
a) b)
Figure 1.3 Longitudinal cracking in a) Non wheel path b) wheel path
1.3.1.3. Transverse cracking
Transverse cracking (Figure 1.4) is cracks that are predominantly perpendicular to pavement centerline. Transverse cracks are essentially caused by shrinkage of the HMA pavement surface due to low temperatures or asphalt binder hardening, reflective crack caused by cracks beneath the surface HMA layer and top-down cracking. When the tensile stress due to shrinkage exceeds the tensile strength of the asphalt pavement surface, the crack occurs (Ainalem Nega,2015).
As in fatigue cracking cases, the classification into severity levels takes into account the crack width and the presence of degraded edges. The three severity levels are:
1. Low severity level, for transversal joints cracks with a width lower than 2 mm; 2. Moderate severity level, for transversal joints cracks with a width higher than 2 mm;
3. High severity level, for transversal joints cracks with a width higher than 2 mm, plus degraded edges.
The reasons for transverse cracking, and their repairs, are similar to those for longitudinal cracking. In addition, thermal issues can lead to low-temperature cracking if the asphalt is too hard.
1.3.1.4. Block cracking
Block cracking is an interconnected series of cracks that divides the pavement into rectangular pieces with cracks that intersect at about 90 degrees. The blocks usually range from 30 by 30 cm to 300 by 300 cm (Errore. L'origine riferimento non è stata trovata.Figure 1.5).Block cracking, unlike fatigue cracking, will occur throughout of the pavement width, not only in the wheel paths and this phenomena is sometimes the result of transverse and longitudinal cracks intersecting.
Furthermore this type of distress differs from alligator cracking in that alligator cracks form smaller, irregular shaped pieces with sharp angles. Moreover, alligator cracks are caused by repeated traffic loadings and are, therefore, generally located in traffic areas. These cracks are the result of age hardening of the asphalt coupled with shrinkage during cold weather, and can be effectively treated with crack sealants, or they can also be due to lack of compaction during construction. So, it is not a load-associated distress, although load can increase the severity of individual cracks.
In particular, block cracking can be caused by oxidative hardening of the asphalt if mixed too long in the mill, mixed too hot, or stored too long in silos. All these above reasons make the asphalt cement especially susceptible to tensile strains, which can exceed the tensile strain capacity of the asphalt mixture and cause the block cracking.
Low severity block cracking may be repaired by a thin wearing course but if the cracking gets more severe overlays or recycling may be needed; if base problems are found, reclamation or reconstruction may be needed. Because the cracks can be closely spaced, the underlying layers can be exposed to significant quantities of infiltrating surface water. These cracks should be sealed to prevent or minimize intrusion of water.
1.3.1.5. Reflective cracking
Asphalt overlays are commonly applied on existing flexible and rigid pavements when pavement conditions (structural and functional) have reached an unacceptable level of service. Overlays are designed to resist fatigue and/or rutting failure mechanisms; however, overlays may still show cracking patterns similar to the ones, which existed in the old pavement after a short period of time. This distress is known as ‘reflection cracking’ (Nirmal Dhakala, 2016).
Reflection cracking (Figure 1.6) is one of the most important factors causing premature failure of asphalt layer overlays and hence the pavements. Reflection cracking occurs in asphalt layer because of their inability to withstand (or resist) tensile and shear stresses created by vertical and horizontal movements of cracked or jointed pavements underneath. The vertical movement of the pavement is mainly caused by moving traffic and the horizontal movement of cracks and joints is caused by temperature and/or moisture changes. The vertical movement in the overlay induces a shear stress in the asphalt overlay while the horizontal movement of cracked or jointed slabs causes high tensile stresses and strains at the bottom of the asphalt overlay and results is reflection cracking. The factors that influence the rate at which reflection cracks deteriorate are the number and magnitude of applied loads. The mechanism of reflective cracking is show in Errore. L'origine riferimento non è stata trovata.
In another attempt to understand the process of reflection cracking, Francken et al. (1997) described different factors contributing to the development of reflection cracking. Traffic load can produce two types of movement in the cracked concrete slab that generate shear stresses (Figure 1.7a and Figure 1.7c) due to relative vertical movement of cracked slabs and flexural stresses (Figure 1.7b) in the HMA overlay. In addition, due to temperature and/or moisture changes, the cracked concrete slab contracts and expands, inducing large tensile stress at the bottom of asphalt overlay and causing progressive opening-up of joints and cracks (Figure 1.7d).
Figure 1.7 Propagation of cracking
Reflection cracking is a serious challenge associated with pavement rehabilitation as it leads to premature failure of the overlay and allows water infiltration through the cracks, which causes stripping in asphalt layers and weakening and deterioration in the base and/or subgrade.
The systems in order to delay reflection cracking are based on two mechanisms: (i) reflection cracking can be retarded by using reinforcement systems, which are stiffer than surrounded materials, such as geosynthetics or steel reinforcement and (ii) a low modulus material is used to create a stress absorption layer.
The major types of treatment methods that have been evaluated to control reflection cracking are: - use of geosynthetic or geogrid as reinforcement;
- use of steel as reinforcement;
- stress absorbing membrane as an interlayer between overlay and concrete or old asphalt layer;
- using modified asphalt for overlay; - using large thickness of asphalt overlay. 1.3.2. Surface deformation
Pavement deformation is the result of weakness in one or more layers of the pavement that has caused by traffic load after construction or to failures during construction. Surface distortions can be a traffic hazard and they interest both paved and unpaved roads.
The major types of surface deformation are: 1. Rutting
3. Depressions 4. Potholes
1.3.2.1. Rutting
Rutting is one of the major distress mechanisms in flexible pavements (both paved Figure1.8aErrore. L'origine riferimento non è stata trovata. and unpaved Errore. L'origine riferimento non è stata trovata.Figure 1.8b). Because of the increase in tire pressure and axle loads in recent years, rutting has become the dominant mode of failure of flexible pavements in many countries.
Rutting is defined as the longitudinal permanent deformation or plastic movement of the surface pavement under the action of repeated loadings over the wheel path but also a inadequate compaction can lead to rutting. Rutting can occur in all layers of the pavement structure and results from lateral distortion and densification. The width of the rut is a sign of which layer has failed, a very narrow rut is usually a surface failure, while a wide one is indicative of a subgrade failure. The width and depth of the rutting profile usually depends highly by the pavement structure (layer thickness and quality), traffic volume and composition as well as on the environment.
a) b)
Figure 1.8 Rutting in a)paved road, b) unpaved road
Deformation which occurs only in the asphalt layer may be the result of either consolidation or plastic flow. Consolidation is the continued compaction of asphalt layer by traffic loads applied after construction. Consolidation may produce significant rutting in asphalt layers which are very thick and which are compacted during construction to initial air void contents considerably higher than the long-term air void contents for which the mixes were designed.
According to Eisemann and Hilma (1987) that studied asphalt pavement deformation phenomenon using wheel tracking device and measuring the average rut depth as well as the volume of displaced materials below the tires and in the zones adjacent to them it is possible say that in the initial stages of trafficking the increase of irreversible deformation below the tires is distinctly greater than the increase in the failed zones. Therefore, in the initial phase, traffic compaction or densification is the primary mechanism of rut development. After the volume decrease below the tires is approximately equal to the volume increase in the adjacent failed zones. This indicates that most of the compaction under traffic is
completed and further rutting is caused essentially by shear deformation. Thus, it can consider the shear deformation the primary mechanism of rutting for the greater part of the lifetime of the pavement.
Generally there are three causes of rutting in asphalt pavements:
- Accumulation of permanent deformation in the asphalt surfacing layer: Rutting resulting from accumulation of permanent deformation in the asphalt layer is now considered to be the principal component of flexible pavement rutting. Rutting in asphalt layers is caused by an asphalt mixture that is too low in shear strength to resist the repeated heavy loads to which it is subjected. It is thus abundantly clear that rutting caused by accumulation of permanent deformation in asphalt layers is the primary cause of flexible pavement deterioration. To reduce this form of deterioration it is necessary to pay more attention to the selection of materials and mix design.
- Permanent deformation of subgrade: In this type of rutting, the permanent deformation occurs in the subgrade. Thus this type of rutting is considered to be more of a structural problem than a materials problem and is often referred to as structural rutting. Intrusion of moisture can also be the cause for weakening of the subgrade.
- Wear of pavements caused by studded tires: Studded tires damage hot mix asphalt and concrete pavements, wearing away the pavement and eventually forming ruts on the pavement surface. This type of rut damage is called “raveling.” The studded tires, used in nordic countries, cause significant wear of the pavements, which results in longitudinal depression in the wheel path. Because of this, wear resistance mixtures, which are usually of high binder content and low void content are specified for high volume roads of studded tires. Therefore the observed rutting in the field would most probably be the combined effect of wear and permanent deformation.
-
Figure 1.9 Permanent deformation vs rutting
Permanent deformation and rutting are sometimes used interchangeably, because they are both depressions that occur on a wheel path after traffic loading, the difference is accounted by the measurement method. Permanent deformation is measured as the depth of depression with reference to the original profile, while rutting is measured using a straight bar, as the depth between the highest and deepest points on a profile (Errore. L'origine riferimento non è stata trovata.Figure 1.9). For this dissertation, permanent deformation measurement method is referred.
To analyze the rutting importance three severity levels can be consider for HMA paved roads: 1. low severity level, for rutting distresses with a depth lower than 10 mm;