This content has been downloaded from IOPscience. Please scroll down to see the full text.
Download details:
IP Address: 192.167.23.210
This content was downloaded on 24/10/2016 at 14:14
Please note that terms and conditions apply.
You may also be interested in:
Commissioning of the CMS High-Level Trigger with cosmic rays CMS Collaboration
Commissioning of the CMS experiment and the cosmic run at four tesla CMS Collaboration
Performance of the CMS Level-1 trigger during commissioning with cosmic ray muons and LHC beams CMS Collaboration
Performance study of the CMS barrel resistive plate chambers with cosmic rays CMS Collaboration
Fine synchronization of the CMS muon drift-tube local trigger using cosmic rays CMS Collaboration
Performance of CMS muon reconstruction in cosmic-ray events
CMS data processing workflows during an extended cosmic ray run
View the table of contents for this issue, or go to the journal homepage for more 2010 JINST 5 T03006
(http://iopscience.iop.org/1748-0221/5/03/T03006)
2010 JINST 5 T03006
PUBLISHED BYIOP PUBLISHING FORSISSA
RECEIVED: November 26, 2009 ACCEPTED: January 19, 2010 PUBLISHED: March 19, 2010 COMMISSIONING OF THECMS EXPERIMENT WITHCOSMIC RAYS
CMS data processing workflows during an extended
cosmic ray run
CMS Collaboration
ABSTRACT: The CMS Collaboration conducted a month-long data taking exercise, the Cosmic Run At Four Tesla, during October-November 2008, with the goal of commissioning the experiment for extended operation. With all installed detector systems participating, CMS recorded 270 million cosmic ray events with the solenoid at a magnetic field strength of 3.8 T. This paper describes the data flow from the detector through the various online and offline computing systems, as well as the workflows used for recording the data, for aligning and calibrating the detector, and for analysis of the data.
KEYWORDS: Detector control systems (detector and experiment monitoring and slow-control sys-tems, architecture, hardware, algorithms, databases); Data acquisition concepts
2010 JINST 5 T03006
Contents1 Introduction 2
2 Online system 2
3 High level trigger and data streams 3
3.1 Streams and primary datasets in CRAFT 4
4 Data handling 5
4.1 Tier-0 workflows 5
4.2 Data storage and transfers 6
4.3 Tier-1 processing 8
5 Reconstruction software 10
5.1 Dedicated reconstruction algorithms for cosmic ray events 10
5.2 Deployment of software updates during prompt reconstruction 12
5.3 Evolution of Tier-1 reprocessing 12
6 Data quality monitoring and prompt feedback 13
6.1 Online monitoring 14
6.2 Offline monitoring 14
6.3 Data certification 14
6.4 Prompt data analysis and feedback 15
7 Alignment and calibration 15
7.1 AlCaRaw streams 17
7.2 AlCaReco skims 18
7.3 Alignment and calibration workflows, validation and sign-off of constants 18
7.4 Conditions used for reprocessing campaigns 19
8 Conditions 19
8.1 Interval of validity for conditions data and the global tag 20
8.2 Population of the conditions database 20
8.3 Database population during CRAFT 20
9 Analysis model and tool 21
9.1 CRAB architecture 22
9.2 CRAFT analysis activity 22
9.3 Analysed data volume 22
10 Summary 23
2010 JINST 5 T03006
1 IntroductionThe primary goal of the Compact Muon Solenoid (CMS) experiment [1] is to explore physics at
the TeV energy scale, exploiting the collisions delivered by the Large Hadron Collider (LHC) [2].
The central feature of the CMS apparatus is a superconducting solenoid, of 6 m internal diam-eter. Within the field volume are the silicon pixel and strip tracker, the crystal electromagnetic calorimeter (ECAL) and the brass-scintillator hadronic calorimeter (HCAL). Muons are measured in drift tube chambers (DT), resistive plate chambers (RPC), and cathode strip chambers (CSC) embedded in the steel return yoke. A detailed description of the experimental apparatus can be
found elsewhere [1].
A key element to the success of the experiment is the adequate design, implementation and smooth operation of the data processing workflows from the detector to the end user analysis. The
month-long data taking exercise known as the Cosmic Run At Four Tesla (CRAFT) [3] represented
a major test for these workflows. This paper describes the technical details of the data flow from the detector to the final analysis. It explains the data acquisition system and the various online and offline computing systems, and describes the software and the workflows used in the data taking chain.
Section 2 describes the online data taking environment and section 3 the high-level trigger
chain including the binary raw detector output content. The computing infrastructure used to handle
the recorded data is detailed in section4, and the software and its special setup for reconstructing
cosmic ray events in section5. This is followed by the description of the data quality monitoring
and the various validation steps performed during data taking in section 6. The recorded data
have been used to derive alignment and calibration constants, which are described in section 7.
The management and distribution of the constants via the CMS conditions database system are
addressed in section8, while the analysis of the recorded cosmic ray muon data is described in
section9.
2 Online system
The CMS trigger and data acquisition (DAQ) system is designed to collect and analyse the detector information at the LHC bunch-crossing frequency of 40 MHz. The rate of events to be recorded for offline processing and analysis is about a few hundred Hz. The first-level trigger (L1) is designed to reduce the incoming data rate to a maximum of 100 kHz, by processing fast trigger information coming from the calorimeters and the muon chambers, and selecting events with interesting signa-tures. The DAQ system must sustain a maximum input rate of 100 kHz, or a data flow of about 100 GB/s, coming from approximately 650 data sources from the different detector components. The
DAQ system then reduces this rate by a factor of 1000 using a high-level trigger (HLT, section3),
a software filtering system running on a large processor farm.
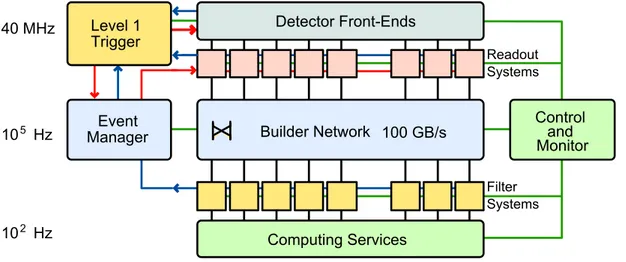
The architecture of the CMS DAQ system, described in detail elsewhere [1, 4], is shown
schematically in figure1. The sub-detector front-end systems store data continuously in 40
MHz-pipelined buffers. Synchronous L1 accept signals are distributed to the front-ends via the timing, trigger, and control system. When an accept signal is received, the corresponding data are ex-tracted from the buffers in the front-ends and pushed into the DAQ system through the links in
2010 JINST 5 T03006
Detector Front-Ends Computing Services Readout Systems Filter Systems Event Manager Level 1 Trigger Control and Monitor Builder Network 40 MHz 105 Hz 102 Hz 100 GB/sFigure 1. Simplified schematic view of the CMS Data Acquisition System architecture. Shown are the key building blocks for a single slice of the DAQ system.
the readout systems. The various readout fragments coming from different parts of the apparatus are subsequently assembled into complete events (event building) in two stages inside the high-performance builder network. Firstly, the front-end fragments are assembled into larger groups called super fragments, which are delivered to readout units organised in eight independent sets (DAQ slices). All super fragments belonging to the same event are given to the same slice which are fed with events in a round-robin fashion. In each slice, individual events are assigned to event buffers (builder units) by an event manager, and each builder unit assembles single events after having obtained all its super fragments from the readout units in the slice. The builder unit hands over complete events to the filter systems running individual filter units upon request. The filter unit runs the HLT algorithms to select events to be accepted for storage, and eventually hands over accepted events to the computing services. In the end, storage managers, one for each slice, stream
event data to disk and transfer complete data files to the CMS Tier-0 (section4). More details about
the HLT and data logging are discussed in the following section.
3 High level trigger and data streams
The CMS high-level trigger algorithms are executed in a farm comprising 720 computing nodes, the event filter farm, executing the HLT reconstruction and selection algorithm sequence on individual events in parallel. The products of the HLT execution (e.g. reconstructed physics objects, tracks, etc.) can be added to the event before it is sent to storage, thus facilitating later debugging and analysis of the HLT performance.
The HLT reconstruction uses the same framework as the offline reconstruction [5]. The HLT
configuration (menu) is delivered to the individual processes by the run control system [6]. HLT
configurations are managed by a configuration system designed around a relational database abstraction of the individual components (reconstruction modules, filters, etc.) and their
2010 JINST 5 T03006
reconstruction and selection modules. Each path is normally designed to select a specific physics signature (e.g. inclusive muon events). Calibration and other conditions data are retrieved from the online database and distributed to the HLT processes by a hierarchy of cache servers, connecting
to a redundant FroNTier server [8] that provides uncomplicated web access to databases. It is used
by the CMS software, on all tiers of the distributed-computing infrastructure of CMS, to retrieve
calibration and alignment constants (section4).
Events accepted by the HLT are delivered to the storage manager system (SM) via the same switched network, used for event building. The SM consists of 16 independent processes running on independent computers, and connected through a fibre-channel switch to eight disk arrays, for a total of 320 TB of disk space. The SM is capable of an aggregate maximum throughput to disk of up to 2 GB/s while concurrently transferring complete data files to the Tier-0 at up to 800 MB/s.
For CRAFT, CMS operated 4 slices of the DAQ system using 275 computing nodes and 320 TB of available disk capacity for the SM system.
Routing of individual event data to files in the SM is driven by the definition of output streams, which group events selected by specific HLT paths. Several different streams are normally defined to group together events according to their offline usage (e.g. primary “physics” stream, “express” stream, calibration streams, etc.). The same path can feed multiple streams and hence, in general, individual streams can overlap. Within a stream, sets of paths selecting similar signatures (e.g. “inclusive muons”, etc.) can be further grouped into primary datasets (PDs). A PD is defined as a subset of the stream consisting of the events satisfying a certain group of paths selected by that stream. The PD definition is subsequently used by the Tier-0 repacking step to split the contents of a
stream into its component PDs (section4). Overlaps between streams affect the transfer bandwidth
to the Tier-0 while overlaps between PDs primarily affect the disk and tape space consumption of the recorded data. Both the stream and PD definition are intimately connected with the HLT menu, and hence the three are handled as a unit. The same configuration management system is used to maintain and distribute them, and a single identification key is used by the HLT, the SM, and the Tier-0 to retrieve the relevant portion of the configuration from the database.
3.1 Streams and primary datasets in CRAFT
For CRAFT a primary physics stream and several alignment and calibration streams had been
defined (see section 7) based on L1 and HLT trigger decisions. The physics stream was divided
up into three main physics primary datasets and several “technical” datasets, used for subdetector specific commissioning analyses.
The three physics primary datasets were:
• Cosmics: all events satisfying at least one of the muon trigger paths. Those events are mainly used in cosmic ray data analyses. Its rate was around 300 Hz.
• Calo: all events satisfying all other L1 physics trigger paths. There was no explicit exclusion of the cosmic ray events trigger path in the Calo dataset, but the overlap was minimal. The Calo dataset was mainly populated by detector noise events and amounted to about 300 Hz. • MinimumBias: all events selected either by a forward hadronic calorimeter technical
2010 JINST 5 T03006
contained also a fraction of random triggers, useful for commissioning studies. Its rate was about 10 Hz.
The processing of the output streams and their splitting in primary datasets is described in the next section.
4 Data handling
The computing centre at CERN hosts the Tier-0 of the distributed computing system of CMS [9].
The CMS computing system relies on a distributed infrastructure of Grid resources, services and toolkits, to cope with computing requirements for storage, processing, and analysis. It is based
on building blocks provided by the Worldwide LHC Computing Grid project (WLCG) [10]. The
distributed computing centres available to CMS around the world are configured in a tiered
ar-chitecture (as proposed in the MONARC [11] working group), that behaves as a single coherent
system. The Tier-0 hosts the initial processing of data coming from the detector and corresponds to about 20% of all computing resources available to CMS. The Tier-1 level takes care of
sub-sequent processing and re-processing workflows (section4.3) and has approximately 40% of the
CMS computing resources available, while the Tier-2 level hosts Monte Carlo (MC) simulation and analysis and uses the remaining ∼ 40% of all CMS computing resources.
All streams defined by the online system (section2) and the HLT (section3) are written in a
binary data format, referred to as streamer files. A transfer system copies the streamer files from the online systems at the detector site to the main CERN computing centre to be converted to
a ROOT-based event data format [5, 12], split into primary datasets and stored on tape. A first
reconstruction is performed and its output is stored in separate datasets. The event content of the detector measurements is called the RAW data-tier and the output of the reconstruction pass is called the RECO data-tier.
The primary datasets are distributed amongst seven Tier-1 sites available to CMS for
cus-todial storage and further processing. They are located in France (T1 FR IN2P3), Germany
(T1 DE FZK), Italy (T1 IT CNAF), Spain (T1 ES PIC), Taiwan (T1 TW ASGC), the United
King-dom (T1 UK RAL), and the United States (T1 US FNAL).
In a final step, datasets stored at the Tier-1 sites are served to Tier-2 centres, where the final analysis to extract physics results is performed.
4.1 Tier-0 workflows
The Tier-0 performs the conversion of the streamer files into the ROOT-based event data format
(repacking) and splits the streams into primary datasets (section 3). This is followed by the
re-construction of the primary datasets. In the case of CRAFT, only the three main physics primary datasets were reconstructed at the Tier-0.
A Python-based processing system [13] with an ORACLE database schema for state tracking
(T0AST) is used to control a dedicated batch system queue (managed by LSF [14]) to split and
process the data. The input and output files are handled by the CERN Advanced STORage manager
(CASTOR) mass storage system [15]. Table1gives an overview of the volumes of data produced
2010 JINST 5 T03006
Table 1. Overview of data produced during the CRAFT run, from the central data-handling perspective.Number of primary datasets produced 11
Number of events recorded 2 ×10⁹
Number of events in Cosmics primary dataset 370 ×106
Number of runs recorded 239
Total data volume recorded and produced 396 TB
Total data volume recorded and produced in Cosmics primary dataset 133 TB
including technical events for monitoring and calibrations purposes. During data taking, CMS recorded events without magnetic field and with the solenoid at a magnetic field strength of 3.8 T.
In subsequent steps, the output of the reconstruction is used to derive specialised alignment
and calibration datasets (section7) and data quality information is extracted and uploaded to a web
server (see section6).
For these two processing steps, the system normally used for MC production and central
pro-cessing at the Tier-1 sites was used as a temporary solution ([16], section4.3). The processing
of newly recorded data was triggered periodically during data taking to produce alignment and calibration datasets and upload quality information to a web server. These functionalities are now integrated in the Python-based Tier-0 processing system.
The LSF queue at the Tier-0 was dimensioned for early data taking in Sept. 2008 and allowed
for a maximum of 2250 jobs running in parallel. As shown in figure2, this capacity was never
used completely owing to the short reconstruction time of the low-occupancy cosmic ray events. The average reconstruction time in CRAFT was about 0.75 seconds per event. This should be compared to the reconstruction time of proton-proton collision events, which is estimated to be about 5 seconds per event. This estimate was derived from events producing top quark pairs, which do not represent the bulk of the expected events but resemble many of the physics processes of interest for analysis.
The in-bound and out-bound network data rates to the Tier-0 CASTOR disk pool are shown in
figure3. The reading rate peaked at 5 GB/s while the writing rate was always below 1 GB/s. The
available network bandwidth was able to support all Tier-0 cosmic ray data taking workflows. Overall, the Tier-0 infrastructure performed stably and reliably, and was sufficiently provi-sioned for cosmic ray data taking.
4.2 Data storage and transfers
The CMS computing model foresees at least two copies of all data on independent storage media, for example on tape at two different sites. To fulfill this requirement, all output datasets in ROOT format are stored on tape at the Tier-0. This copy, called the archival copy of the data, is only stored for backup purposes and is not accessible for processing workflows. A further copy is distributed amongst the Tier-1 sites for custodial storage on tape. This copy is called the primary copy and
2010 JINST 5 T03006
Figure 2. Utilization of the Tier-0 LSF batch queue during CRAFT. The maximum of 2250 batch slots were never fully utilized and all jobs started promptly after submission. (Taken from monitoring sources).
Figure 3. In-bound and out-bound network data rates to the Tier-0 CASTOR disk pool at CERN. The reading rate peaked at 5 GB/s while the writing rate was always below 1 GB/s. (Taken from monitoring sources).
access is provided for further processing on the Tier-1 level (section4.3) and analysis on the Tier-2
level. As a safety measure during CRAFT, all streamer files were stored temporarily on tape as well.
A data-transfer management system named PhEDEx (Physics Experiment Data Export) [17] is
used to handle the movement of data between these computing centres. Deployed at all CMS sites, PhEDEx automates many low-level tasks, such as large-scale data replication and tape migration, and guarantees consistency of the dataset copies. PhEDEx uses standard WLCG transfer tools
such as FTS [18] and SRM [19], which interface with the mass storage systems at 1 and
Tier-2 centres. PhEDEx provides site managers and users with a centralised system for making data movement requests and provides status and overview information.
During CRAFT, the recorded and processed primary datasets were distributed amongst the Tier-1 sites according to available free tape space taking into account processing capacity and reliability of the Tier-1 sites. For the Cosmics primary dataset, the average size per event for the RAW data tier was 105 kB/event and for the RECO data tier 125 kB/event.
Figure4shows the transfer rate during CRAFT from the Tier-0 to the Tier-1 sites. The transfers
2010 JINST 5 T03006
T1_US_FNAL T1_FR_IN2P3 T1_UK_RAL T1_DE_FZK T1_ES_PIC T1_TW_ASGC T1_IT_CNAF 15.10. 2008 18.10.2008 21.10.2008 24.10.2008 27.10.2008 30.10.2008 02.11.2008 05.11.2008 08.11.2008 11.11.2008 14.11.2008 Date 100 200 300 400 500 Tra ns fer Ra te [M B/ s] CMS 2008Figure 4. Transfer rates from Tier-0 to Tier-1 centres over the duration of CRAFT. The average was about 240 MB/s. (Taken from monitoring sources).
T1_US_FNAL T1_FR_IN2P3 T1_UK_RAL T1_DE_FZK T1_ES_PIC T1_TW_ASGC T1_IT_CNAF 15.10. 2008 18.10.2008 21.10.2008 24.10.2008 27.10.2008 30.10.2008 02.11.2008 05.11.2008 08.11.2008 11.11.2008 14.11.2008 Date 100 Da ta tra ns fer red [TB] 200 300 500 400 600 CMS 2008
Figure 5. Cumulative transfer volume from Tier-0 to Tier-1 centres over the duration of CRAFT. (Taken from monitoring sources).
During CRAFT, a total of 600 TB was transferred out of CERN to the Tier-1 sites. Figure 5
shows the cumulative transfer volume per Tier-1 site.
Overall, the transfer system performed very well and transferred all CRAFT data reliably to the Tier-1 sites. There was one very large 200 GB file failing transfer to the US Tier-1 site. Being about 20 times larger than the average file size in the dataset, a timeout occurred during each transfer attempt and caused a short delay in analysis of the dataset. Later analysis on the file was performed and safeguards have since been put into place to prevent similar failures from occurring.
4.3 Tier-1 processing
The central processing at the Tier-1 sites was performed using the current MC production
sys-tem [16]. The system is written in Python [20] and uses a MySQL database [21] to schedule jobs
by interfacing with different Grid middlewares [22–24]. However, compared to the Tier-0
2010 JINST 5 T03006
Table 2. List of skims exercised during CRAFT, showing for each skim the parent primary dataset,ac-ceptance of the skim event selection and output event content combined from different data tiers. The RAW data-tier consists of all detector measurements while the RECO data-tier contains all reconstructed properties of an event.
Skim name Prim. Dataset Acceptance Event Content
SuperPointing Cosmics 0.27% RAW-RECO
TrackerPointing Cosmics 4.50% RAW-RECO
MultiMuon Cosmics 0.44% RECO
PtMinSelector Cosmics 0.68% RECO
CSC Skim Cosmics 3.84% RAW-RECO
CSC Skim BFieldStudies Cosmics 0.04% RAW-RECO
HCALHighEnergy Cosmics/Calo/MinBias 0.09% (on Cosmics) RAW-RECO
ECALSkim Cosmics/Calo 0.40% (on Cosmics) RECO
of Monte Carlo samples, for which 100% accountability is not a primary concern because more events can be easily generated in the case of failures or infrastructure problems.
The requirements for the Tier-1 processing workflows are in fact very different compared to MC production workflows. During processing on the Tier-1 level, an input RAW or RECO dataset is processed to either prepare a new reconstruction pass with updated software and/or conditions and alignment constants (re-reconstruction) or to extract events of interest from the total dataset to reduce the amount of data to be analysed (skimming). Accounting of the processing of every single input event is of highest priority as all events have to be accounted for in order to correctly calculate the luminosity for the processed LHC collisions.
In the near future, the used Monte Carlo production system will be completely redesigned based on the state tracking technology of the Tier-0 processing system. Guaranteeing 100% ac-countability, the new system is planned to be put into operation in spring 2010.
In CRAFT, the physics primary datasets were skimmed to reduce the amount of data for physics analyses to process, still keeping full physics content. Some skims combined the RAW and RECO event content in the same dataset to simplify debugging of the software and low-level analysis of the events. In addition, many skims were used for re-reconstruction to validate new algorithms or new derived alignment and calibrations conditions thus reducing the number of full reprocessings.
The list of skims exercised during CRAFT is shown in table 2by listing the parent primary
dataset and acceptance of the skim event selection as well as the output event content of each skim. The SuperPointing and TrackerPointing skims preferentially selected events containing muons whose propagation loosely traversed the Pixel and Strip tracker regions, respectively. The
Multi-Muonskim contained events with more than four reconstructed muons for muon shower analyses,
while the PtMinSelector skim retained only events with high-energy muons (pT > 50 GeV/c).
The CSC Skim skim selected events with activity in the CSC endcap muon detectors. In ad-dition, good segments from CSC hits were selected in the CSC Skim BFieldStudies skim, which were used in a measurement of the magnetic field in the endcap yoke regions.
2010 JINST 5 T03006
The HCAL skim selected events with high energy deposits in the HCAL and the ECAL skim was selecting events with high energy deposits in the ECAL due to either showering muons or noise activity.
Two re-reconstruction passes of all data taken in CRAFT were made after the data taking period ended. The first pass was started in November 2008 and finished in January 2009. It suffered significantly from infrastructure and technical problems. After improvements, a second pass was
performed from the 12th to the 25th of February 2009. Both re-reconstruction passes produced the
associated alignment and calibration datasets, as was done for the Tier-0 processing.
The major issue observed during the re-reconstruction was the lack of complete accountability of the reprocessing system. This complicated the task of identifying job failures, which had to be done manually. The net result was that a very small fraction (about a few percent) of the final processing was incomplete.
This will be addressed in the future by the new Tier-1 processing system, developed for LHC collision running.
5 Reconstruction software
The main goals of event reconstruction in the context of CRAFT were to provide a reliable cos-mic ray event reconstruction in order to support detector performance, calibration, and alignment studies, as well as testing as much as possible the software components to be used in proton-proton collision events with the LHC.
In order to accomplish these objectives, a dedicated configuration of the reconstruction soft-ware tools was prepared and optimised for cosmic ray muon events. While some part of the re-construction code developed for proton-proton collisions could be basically re-used, many key elements needed additional code development to support the reconstruction of cosmic ray muon events. The code developed for proton-proton collision events is nevertheless used and tested wherever possible. In several cases, two or more reconstruction algorithms performing similar
tasks have been run in parallel to gain experience (table3).
In the following section we briefly describe the major changes in reconstruction code during the CRAFT data taking period.
5.1 Dedicated reconstruction algorithms for cosmic ray events
Local reconstruction in the electromagnetic calorimeter. In parallel with the standard ECAL
local reconstruction, an additional algorithm has been used to provide a better measurement of the
energy deposited by a cosmic ray muon [25]. The standard algorithm is optimised for particles
reaching the ECAL crystals within a very narrow time window, as appropriate for LHC collisions, while in case of cosmic ray muons the actual time of arrival is spread over the 25 ns of the bunch clock interval. The modified algorithm performs a fit of the pulse shape, sampled tenfold by the ECAL hardware, and thus provides a precise measurement of both the energy and the arrival time of the cosmic ray muon. While particles from LHC interactions release energy in only a few crystals, cosmic ray muons cross the ECAL surface at a wide range of incidence angles, which can spread the energy deposit over a sizable number of crystals. A dedicated version of the clustering algorithm has been used to collect this energy most efficiently.
2010 JINST 5 T03006
Table 3. Summary of the different reconstruction algorithms used during CRAFT. The central columnindicates the main algorithm executed as input to subsequent steps. The right column shows the alternative algorithms performed in parallel. See section5.1for details.
Component Default Code/Configuration Alternative versions
Tracker local standard none
ECAL pulse fit based standard weight based
HCAL threshold for cosmic ray events none
DT standard no-drift (coarse hits) , t0fitting
CSC standard none
RPC standard none
Tracking dedicated seeding Road Search (cosmic version)
and navigation Cosmic Track Finder (no pattern reco)
track splitting (up/down)
Muon dedicated cosmic barrel/endcap only
muon reconstruction different DT local reco
LHC vs. Cosmic navigation and fit single-leg vs. two-leg
Jet and MET standard none
Electron/Photon subset of standard none
B tagging not run none
Particle Flow and not run none
Tau reconstruction
Track reconstruction within the Tracker. The track reconstruction for CRAFT is largely
based on the methods already employed for the Magnet Test and Cosmic Challenge (MTCC) in
2006 [26,27], and the Tracker Integration Facility (TIF) sector test [28] in Spring 2007. The main
differences compared to standard tracking for collisions are in the seeding and in the navigation steps. Seeding combines hits from several neighbouring layers to generate the starting point for the track pattern recognition and is mainly based on the pixel system in case of LHC collision events; this has been modified to be able to reconstruct those trajectories not crossing the very small pixel volume. The modified seeding mainly uses those layers of the silicon strip tracker that provide a three dimensional position measurement. Navigation, on the other hand, provides the set of the paths the particle can possibly have taken between one tracking layer and another; these sets differ considerably between cosmic ray muons and particles originating from the central interaction point. For diagnostic purposes, the concept of top-bottom track splitting has been introduced, in which the incoming and outgoing part of the cosmic ray muon trajectory, with respect to the point of closest approach to the beam line, are reconstructed as separate tracks. Comparison of the pa-rameters of these two legs serves as a powerful instrument for alignment and tracking performance
2010 JINST 5 T03006
Reconstruction of muons. This section describes the reconstruction of muon trajectories in the
CMS muon system. When possible, the muon system part of the trajectory is combined with a track reconstructed within the tracker, resulting in a global muon track.
Several different flavours of muon reconstruction are used combining different configurations
of the various components. As described in ref. [30] it is possible to perform dedicated cosmic ray
muon reconstruction as a single track (referred to as single leg mode), or split the trajectory into an incoming and outgoing track (two legs). Alternatively, the standard reconstruction for collision events can be used, in which optionally the reconstruction can be restricted to either the barrel or the endcap regions.
Muon reconstruction also depends on the local reconstruction of the DT, RPC, and CSC sub-detectors, for which different variants are available. For reconstruction of the DT track segments, two options are addressing the fact that cosmic ray muons, contrary to those from collisions, arrive
at an arbitrary time not correlated to the bunch clock. The t0-corrected segment reconstruction
treats the arrival time t0as an additional free parameter in the fit, while the no-drift variant does not
use drift time information at all, resulting in relatively coarse point resolution.
The final reconstructed muon object combines all the information available for a reconstructed muon, including standalone muon reconstruction (using only DT, RPC, CSC), global muon recon-struction (matching the track from standalone muon reconrecon-struction with the silicon tracker track), and tracker-based reconstruction (matching the tracker tracks with muon segments).
5.2 Deployment of software updates during prompt reconstruction
In view of the large-scale commissioning nature of CRAFT, prompt reconstruction is one of the workflows for which a low latency of code corrections is important. Fast deployment of bug fixes may generally become necessary when new major releases have been deployed for the first time, when running conditions change drastically, or in the early stage of a data taking period. Most of the problems encountered during CRAFT were related to unexpected detector inputs and lack of corresponding protections in the code to handle them properly.
The procedure for deploying an update was handled by several different shift roles with differ-ent responsibilities. The prompt reconstruction operator reported job failures. These failures were investigated by the offline run manager who identified the code to be fixed and contacted the appro-priate experts. A minimal bug fix was usually provided within a few hours; if no correction could be achieved on this time scale, the corresponding reconstruction feature was disabled to restore Tier-0 operations. This update was provided either as a new configuration or as a new software release.
The CRAFT experience has been a driving element for CMS to introduce a patch-release system to reduce the time required for deployment of new code. It is also seen as an advantage to be able to pause the Tier-0 processing for about 24 hours if necessary to take actions. These two points, combined with the fast feedback that an additional express stream processing will provide, should allow minimising the Tier-0 inefficiency due to reconstruction software failures in future data taking.
5.3 Evolution of Tier-1 reprocessing
The two reprocessing cycles executed at Tier-1 centres allowed the reconstruction to be rerun with
2010 JINST 5 T03006
On lin e Offl ineTier-0
Tier-1s
Tier-2s
Release
Validation
CAF
Certi ficati on Visualisation Data Processing Run Registry DQM GUI DQM GUI HLT DQM SMFigure 6. Sketch of the DQM system, consisting of branches for online and offline monitoring.
In addition, these reprocessing steps were used to tailor slightly the content of the reconstruction output files according to requests from the commissioning and alignment groups. The biggest changes concerned the muon reconstruction and the track reconstruction in the tracker.
6 Data quality monitoring and prompt feedback
Data quality monitoring is critically important for ensuring a good detector and operation efficiency, and for the reliable certification of the recorded data for physics analyses. The CMS-wide DQM system comprises:
• tools for creating, filling, transporting, and archiving of histograms and scalar monitor ele-ments, with standardised algorithms for performing automated quality and validity tests on distributions;
• online monitoring systems for the detector, trigger, and DAQ hardware status and data throughput;
• offline monitoring systems for reconstruction and for validating calibration results, software releases, and simulated data;
• visualisation of the monitoring results; • certification of datasets for physics analyses.
The main features of the DQM system, as operated during the CRAFT data taking period, are
shown in figure6. A detailed experience report can be found elsewhere [31]. DQM for data taking
is performed in two different stages, with very small latency during the data taking (online) and after prompt reconstruction of the events (offline).
2010 JINST 5 T03006
6.1 Online monitoring
The online DQM system consists of a number of consumer applications, labelled as DQM in
fig-ure6, usually one per subsystem, which receive event data through a storage manager event server
and fill histograms at an event rate of 10–15 Hz.
In addition, a small number of histograms is filled in the HLT filter units, which process events at up to 100 kHz. These histograms are shipped out to DQM consumer applications periodically. Identical histograms are summed up across different filter units in the storage manager.
All the histogram data, including alarm states based on quality test results, are made available
to a central DQM graphical user interface server (GUI) for visualisation in real time [32], and are
stored in a ROOT file periodically during the run. At the end of the run the final archived results are uploaded to a large disk pool. Eventually, the files are merged and backed up to tape.
All DQM data processing components and the event display start and stop automatically
under centralised CMS run control [33]. The web servers for the DQM GUI [32] and web-based
conditions monitoring (WBM) [34] are long-lived server systems which are independent of the
run control.
6.2 Offline monitoring
The offline DQM system accumulates monitoring data from several workflows in CMS, namely Tier-0 prompt reconstruction, re-reconstruction at the Tier-1s and the validation of the alignment and calibration results, the software releases, and all the simulated data.
CMS has standardised the monitoring of the event data processing into a two-step workflow: 1. The histogram monitor elements are created and filled with CMS event data information. The
histograms are stored along with the processed events into the normal output event data files. When the CMS data processing systems merge output files, the histograms are automatically summed to form the first partial result.
2. At the end of the data processing the histograms are extracted from the job output data files and summed together across entire runs to yield full event statistics. The final histograms are then used to calculate efficiencies and are checked for quality, by making comparisons with reference distributions. The histograms, certification results, and quality test results are saved into a ROOT file, which is then uploaded to a central DQM GUI web server. In the web server, the files are merged and backed up to tape; recent data are kept cached on disk for several months.
Online and offline DQM GUI web servers provide a common interface, and are linked together as one entity, giving the entire world-wide collaboration access to inspection and analysis of all DQM data at one central location.
6.3 Data certification
CMS uses a database with a front-end web application, the run registry, as the central workflow tracking and bookkeeping tool to manage the creation of the final physics dataset certification
2010 JINST 5 T03006
result. The run registry is both a user interface managing the workflow and a persistent storage of the information.
The work to evaluate the detector and physics object data quality is organised in shifts. The shift persons follow instructions specifically tailored to catch problems. The observations are en-tered in the run registry database where they are available to detector and physics object groups, as well as the whole collaboration, for inspection and confirmation. Final certification results are pro-duced at regular sign-off meetings, typically once per week, before they are delivered to the
experi-ment by storage in the data bookkeeping system (DBS) [35]. The information in DBS is associated
with the primary datasets and is input to the creation of analysis datasets by analysis groups. Online shifts take place continuously during detector operation at the CMS detector site.
Of-fline DQM shifts are carried out at daytime at the CMS centre [36] on the main CERN site. The
shift activities are also supported by regular remote shifts, two shifts per day at Fermilab and one
shift per day at DESY, at the local CMS centres [37].
6.4 Prompt data analysis and feedback
The central DQM shift activity is complemented by the prompt feedback groups, one for each subsystem, which consist of subsystem experts located at the CMS centre. These groups analyse the prompt reconstruction output and integrate the data quality information in a timely way. The
CMS CERN Analysis Facility (CAF) [38], providing large CPU power and fast access to the data
stored on a local CASTOR disk pool [15], was heavily used for such analyses.
The run-by-run DQM results were used to monitor the time evolution of the detector behaviour.
Any observed change was carefully checked and tracked. As an example, figure 7 shows the
evolution of the relative number of hits on tracks in the tracker inner barrel detector as a function of the run number. The step in the distribution is due to improved alignment parameter errors applied to the later data. During reprocessing, the improved parameters were applied to all data, thus removing the step.
Table4shows the number of good events in the Cosmics primary dataset, based on the quality
assignment described above. The breakdown for each subsystem is given when operating nomi-nally and passing the offline selection criteria. Most of the subsystems declared individually more than 85% of the recorded data in the Cosmics primary datasets as good. Having declared a detector component as good does not entail having detected a cosmic ray muon within its fiducial volume.
Figure8shows the accumulated number of cosmic ray triggered events as a function of run
num-ber with the magnet at its operating central field of 3.8 T, where the minimal configuration of the silicon strip tracker and the DT muon system delivering data certified for further offline analysis was required. It was not required to keep the other systems in the configuration. A total of 270 million such events were collected.
7 Alignment and calibration
This section describes the workflows used to compute and improve the alignment and calibration constants. While some calibrations are already performed online at the CMS detector site, this section will focus on the workflows performed at the Tier-0 site and at the CAF.
2010 JINST 5 T03006
Table 4. Cosmic ray triggered events collected during CRAFT in the Cosmics primary dataset in periodswhen the magnetic field was at the nominal value of 3.8 T with the listed detector system (or combination of systems) operating nominally and passing offline quality criteria. The minimum configuration required for data taking was that at least the DT barrel muon chambers and the strip tracker passed the quality criteria. The other subdetectors were allowed to go out of data taking for tests.
Quality flag Events (millions)
(none) 315 Trigger 240 Pixel Tracker 290 Strip Tracker 270 ECAL 230 HCAL 290 RPC 270 CSC 275 DT 310 DT+Strip 270 All 130 66703 66722 66783 67147 67541 67647 68021 68276 68926 69382 69797 70036 0 Run No. 0.02 0.04 0.06 0.08 0.1 0.12 0.14 0.16 0.18 F ra ct io n o f m u o n s wi th T IB h it s CMS 2008 66612
Figure 7. Evolution of the relative number of hits on muon tracks in the tracker inner barrel detector. The step in the distribution is due to improved alignment parameter errors applied to the later data.
66662 66709 66733 66757 67126 67219 67544 67818 68124 68279 68949 69276 69382 69997 0 50 100 150 200 250 66604 x106 Run No. CMS 2008 Ev e n ts Tot. Events: ~270M
Figure 8. Integrated statistics vs. run collected during CRAFT in the Cosmics dataset for runs with good quality flags from the drift tubes and the silicon strip tracker. Only runs with magnetic field of 3.8 T have been considered.
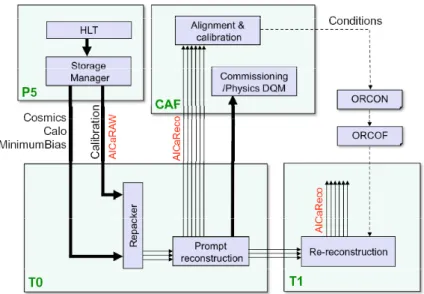
The basic offline workflow for alignment and calibration in CRAFT was a slightly simplified
version of the full model for collisions, and it is illustrated in figure9. Commissioning
experi-ence from this workflow in the context of a challenge with simulated events has been reported
elsewhere [39]. Event information relevant for alignment and calibration was streamed from the
CMS detector site via the standard physics event stream (section3), and via a special calibration
2010 JINST 5 T03006
Figure 9. Offline workflow for alignment and calibration used during CRAFT.
particular calibration procedures. Events from these streams passed the conversion to the
ROOT-based event data format at the Tier-0 (section 4.1) and in the case of the physics stream entered
the prompt reconstruction process. The reconstructed data were then skimmed to create a series of “AlCaReco” datasets that were transferred to the CAF to be used as input to alignment and cal-ibration algorithms. The AlCaReco datasets are designed to contain only the minimal amount of information required by the associated alignment and calibration workflows. The skims producing them performed both event selection, starting from a selection based on HLT bits, and reduction of event content. The alignment and calibration workflows, performed at the CAF, used the Al-CaReco datasets to generate alignment and calibration constants that were validated and uploaded to the conditions database. Re-reconstruction at the Tier-1 sites, using the new constants, also gen-erated new AlCaReco datasets that were used in turn as input to the next series of improvements on alignment and calibration constants.
7.1 AlCaRaw streams
Some calibration procedures in CMS require a very high event rate of typically a few kHz in order to achieve the targeted precision in the time scale of a few days. These events would saturate the available bandwidth between the CMS cavern and the Tier-0 site if the full event content were transferred. This concerns in particular the φ symmetry calibration procedures for ECAL and HCAL, and the ECAL calibration with neutral pion decays. The solution is the creation of special data streams called AlCaRaw already within dedicated high-rate triggers at the HLT farm, which contain only the minimal information needed for these workflows. These AlCaRaw streams have been successfully generated for a significant part of the CRAFT run, accumulating over 160 million events (for each, ECAL and HCAL) for the φ -symmetry streams. Detailed information about the
2010 JINST 5 T03006
Table 5. AlCaReco datasets produced in CRAFT.Dataset Number of events Purpose
TkAlCosmicsHLT 4.3 M Tracker alignment
TkAlCosmics0T 4.9 M Tracker alignment (no pTcut)
MuAlStandaloneCosmics 288 M Muon standalone alignment
MuAlBeamHaloOverlaps 3.3 M Muon endcap alignment
MuAlGlobalCosmics 5.5 M Muon system alignment w.r.t. tracker
HcalCalHOCosmics 313 M HCAL HO calibration
HcalCalDiJets 67 M HCAL calibration
MuAlCalIsolatedMu 52 M Muon system alignment, DT calibration
RpcCalHLT 241 M DT calibration, RPC monitoring
7.2 AlCaReco skims
During the global runs that CMS performed in 2008, the number of AlCaReco skims produced as part of prompt Tier-0 processing has been steadily increased. The set of AlCaReco datasets that
have been produced in CRAFT is listed in table 5. This list also contains datasets that are not
meaningful for calibration with cosmic muon data and have been included only for commissioning the production system. As a result, nine AlCaReco skims have been created in parallel, which is comparable with the maximum number anticipated for a given PD during LHC collisions, thus con-stituting an important scaling test for the CMS alignment and calibration framework. The number of events given in the table, which corresponds to the output of the prompt processing, reflects the selection mechanism. For example, the MuAlStandaloneCosmics dataset did not require tracker in-formation and thus selected a large part of the overall CRAFT event sample. The TkAlCosmics0T dataset, which was originally designed for runs without field, required a trajectory reconstructed in the tracker and thus selected slightly more than one percent of the standalone muon sample. The TkAlCosmicsHLT skim required the corresponding HLT trigger bit and selected only particles with a transverse momentum cut above 4 GeV/c, which resulted in a slightly smaller sample. Low noise thresholds allowed the population of the HcalCalDiJets sample.
7.3 Alignment and calibration workflows, validation and sign-off of constants
All workflows deriving alignment and calibration constants have been performed at the CAF based on the AlCaReco datasets. The derived constants have been uploaded to the CMS conditions database. The management of conditions within the database is explained in more detail in
sec-tion8. Standardised validation procedures have been applied to certify the correctness of the
con-stants. The validation results have been reviewed in a formalised sign-off procedure, to ensure the quality of database constants that are used for any central processing. Special care has been taken regarding the interdependencies of the various workflows.
2010 JINST 5 T03006
7.4 Conditions used for reprocessing campaigns
The first comprehensive alignment and calibration campaign started immediately after the end of data taking. The set of constants used for the first reprocessing of the full CRAFT dataset included the following: tracker alignment and alignment error estimates, strip tracker gain calibration, bad strip and bad fiber maps, pixel tracker gain and pedestal constants, internal track-based alignment
constants for the barrel muon DT chambers [41], global longitudinal positions and tilt angles from
the optical alignment systems for most of the endcap muon chambers [42], muon DT inter channel
synchronization, time pedestal and noise calibration constants [43], gain and pedestal calibration
constants for both ECAL and HCAL. All constants were ready, validated, signed-off and included in the official set of conditions on 20 November 2008, about two weeks after the end of data taking. The second pass of alignment and calibration was performed after the results of the first repro-cessing became available around the middle of January 2009. Tracker gain calibration was updated
and calibration of the Lorentz angle was added. Tracker alignment was further improved [29],
benefiting also from the Lorentz angle calibration, and from an increased number of pixel hits available due to the updated alignment error estimates. The muon chambers were aligned
rela-tive to the tracker with global tracks [41]; in addition, the optical alignment of the endcap system
was extended [42]. Drift-tube calibration was updated following an improved reconstruction in
the inner chambers of the wheels closest to the endcaps in the presence of the magnetic field [43].
HCAL pedestals and gains were improved, and inter-calibration constants for the ECAL endcaps were updated based on laboratory measurements combined with information from laser data taken
during CRAFT [44]. These constants were used in the second reprocessing of the CRAFT data.
8 Conditions
The CMS conditions database system relies on three databases for storing non-event data:
1. OMDS (Online Master Database System) is in the online network at the detector site; it stores the data needed for the configuration and proper settings of the detector (configuration data), and the conditions data produced directly from the front-end electronics. For example, the Data Control System (DCS) information is stored with the ORACLE interface provided by
PVSS [45].
2. ORCON (Offline Reconstruction Condition DB Online subset) is also located at the detec-tor site. It sdetec-tores all the condition data, including calibration and alignment constants, that are needed for the reconstruction of physics quantities in the HLT, as well as for detector performance studies. These are a small subset of all the online constants. These data are
written using the POOL-ORA [46] technology and are retrieved by the HLT programs as
C++ objects.
3. ORCOFF (Offline Reconstruction Condition DB Offline subset) is located at the CERN com-puting centre. It contains a copy of the information in ORCON, kept in sync through
2010 JINST 5 T03006
In order to guarantee consistency of the data in ORCON and ORCOFF, it is one of the CMS policies to write any condition data needed for offline purposes to the ORCON database. ORACLE streaming provides the transfer from ORCON to ORCOFF.
8.1 Interval of validity for conditions data and the global tag
All conditions data are organised by condition database tags. A tag points to one or more instances of a given type of condition data (e.g. ECAL pedestals), each of which has an associated interval of validity (IOV). The IOV is a range of events which is contiguous in time, for which that ver-sion of the condition data is valid. This range is normally defined in terms of run numbers, but can also be defined in terms of absolute time. While some conditions are only valid for the spe-cific run for which they are measured (e.g. beamspot, pedestals), other conditions can be valid for any run (e.g. calorimeter intercalibration constants). Each payload object in ORCON/ORCOFF is unambiguously indexed by its IOV and a tag.
The full consistent set of conditions which needs to be accessed by the HLT and offline recon-struction software is defined in a global tag, which consists of one tag for each type of condition data. For a given event, the reconstruction algorithms query the corresponding conditions data by means of the global tag.
8.2 Population of the conditions database
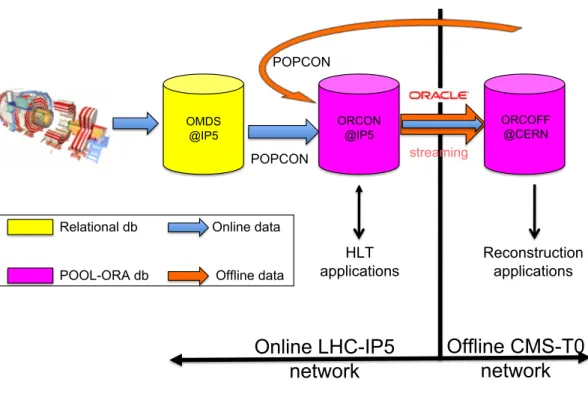
The flow of conditions data is illustrated in figure10. Conditions data that are produced online are
initially stored in OMDS. The subset of online conditions that are required for the HLT and offline reconstruction is extracted and sent to ORCON. This data transfer is operated using a framework
named PopCon (Populator of Condition [48]). PopCon encapsulates the relational data as
POOL-ORA objects and adds meta-data information (the tag to which the object belongs and the IOV), so that the data is correctly indexed for reading by the HLT and offline software. Moreover, PopCon has the additional functionality of logging specific information about any transaction writing to the ORCON database.
Further conditions are produced by the alignment and calibration workflows operated offline,
as described in section7; these are directly uploaded to the ORCON database, again using PopCon.
Finally, all data in ORCON are transferred to ORCOFF, which is the database used for all offline processing and analysis, via ORACLE streaming.
For massively parallel read-access, the ORCON and ORCOFF databases are interfaced with a cache system referred to as “FroNTier,” which in the case of ORCOFF is the mechanism used to distribute conditions data to the Tier-1 and Tier-2 centres outside CERN. Caching servers are used to cache requested objects to avoid repeated access to the same data, thus significantly improving the performance and greatly reducing the load on the central database servers. Further details can
be found in ref. [8].
8.3 Database population during CRAFT
During the CRAFT run, the majority of conditions data were transferred into the offline database using the PopCon application. A central procedure, based on an automatic uploader via a dedicated
2010 JINST 5 T03006
Online LHC-IP5
network
Offline CMS-T0
network
OMDS @IP5 ORCON @IP5 HLT applications POPCON Reconstruction applicationsRelational db Online data POOL-ORA db Offline data
ORCOFF @CERN
POPCON streaming
Figure 10. Conditions databases architecture.
A set of automatic jobs was set up for each sub-detector, in order to both populate the ORCON database and monitor any transaction to it. Each automatic job is associated with a “watchdog” tool that monitors its status. A dedicated web interface was set up on a CMS web server in order to monitor all database transactions. PopCon was used by almost all sub-detectors and an average of one hundred PopCon applications per day were run during CRAFT.
During the entire duration of CRAFT the total amount of conditions data written to ORCON was about 1 TB. ORCON-ORCOFF streaming and the FroNTier caching mechanism operated smoothly throughout CRAFT.
9 Analysis model and tool
In this section, the model and the tool to analyse the recorded and reconstructed data are described.
CMS uses a distributed data-analysis model [9] mostly based on the WLCG Grid infrastructure.
It also supports low-latency access to data on the CAF for prompt analysis and calibration. The CMS analysis model is data-location driven, i.e. the user analysis runs where data are located. The related workflow is mainly characterised by the following steps: interactive code development using small data samples; job preparation and configuration to run over higher statistics (hence to access the whole dataset or a significant part of it); and interactive analysis of the obtained results. With the increasing complexity of the computing infrastructure, the implementation of such a workflow became more and more difficult for the end user. In order to provide the physicists an efficient access to the distributed data while hiding the underlying complexity, CMS developed and
deployed a dedicated tool named CMS Remote Analysis Builder (CRAB) [49], which is described
2010 JINST 5 T03006
Figure 11. CRAFT jobs distributions as a function of time. Left: Daily distribution of analysis jobssub-mitted using CRAB and accessing CRAFT data. Grid (dark shading, red) and CAF (light shading, yellow) activities are shown. (Taken from monitoring sources). Right: CRAFT jobs submitted only at CAF (with and without CRAB). The upper line shows the cumulative number of jobs, the lower line shows the number of jobs submitted each week. The time window extends well beyond the end of CRAFT data taking to cover the extensive period of analysis.
9.1 CRAB architecture
CRAB is the official CMS tool for distributed analysis. The system, which guarantees interoper-ability with the various grid flavours and batch submission systems, has evolved into a client-server
architecture. The client provides the user interface and is a command line Python [20] application
which mainly takes care of the local environment interaction and packages private user library and code, in order to replicate remotely the very same local configuration. The server is the intermediate service responsible to automate the user analysis workflow with resubmissions, error handling, and output retrieval thus leaving to the user just the preparation of the configuration file. The server also notifies the user of the output availability. The server architecture is made of a set of independent components communicating asynchronously through a shared messaging service and cooperating to carry out the analysis workflow.
9.2 CRAFT analysis activity
The CRAFT data have been analysed both at CERN (using the local batch system at the CAF), and on the Grid making use of distributed resources (Tier-2). While access to data on Tier-2 sites has been performed exclusively by CRAB, the CAF queues have been used to run both CRAB and non-CRAB jobs. The large fraction of non-CRAB jobs executed at the CAF is partially due to calibration and alignment workflows, which are for the time being not integrated within the CRAB framework. The collaboration is currently evaluating the best strategy for a proper integration of such workflows.
9.3 Analysed data volume
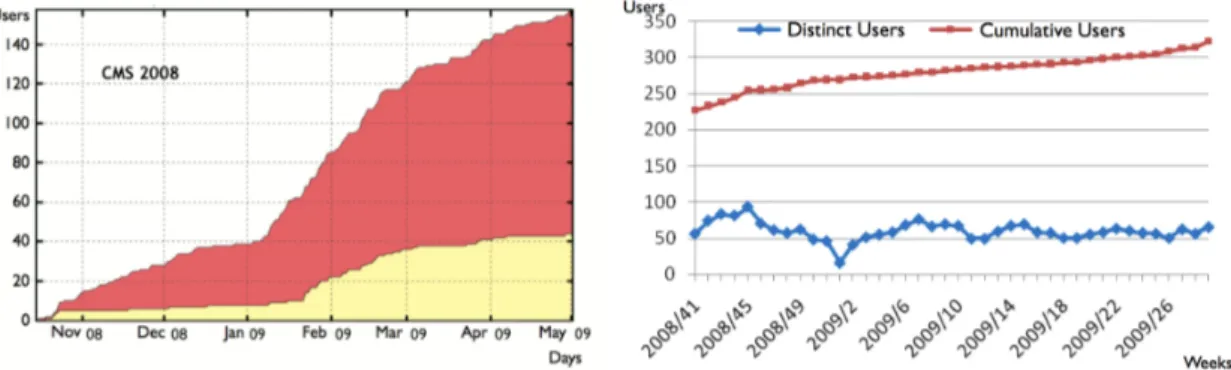
From October 2008 to the beginning of May 2009 more than 2 million analysis jobs accessed CRAFT data, including both CRAB and non-CRAB jobs. The quoted value takes into account both
CAF and Grid activity (figure11). Figure12shows the cumulative numbers of distinct users which
2010 JINST 5 T03006
Figure 12. Cumulative plot of number of different users accessing CRAFT data as a function of time. Left:users using CRAB to submit Grid (dark shading, red) and CAF (light shading, yellow) jobs. (Taken from monitoring sources). Right: number of users submitting jobs only at CAF (with and without CRAB). The lower line shows the number of users per week, the upper line the integrated number over a long period. The time window extends well beyond the end of CRAFT data taking to cover the extensive period of analysis.
Figure 13. Success rate of CRAFT analysis jobs submitted using CRAB. Left: jobs submitted only at CAF. Right: jobs submitted through the Grid.
jobs distribution, give a clear indication of how the user community increased continuously. Re-ferring to the same time interval it is estimated that more than 200 distinct users in total performed
CRAFT analysis activities. As shown in figure13, the overall efficiency of CRAFT analysis jobs is
approximately 60%. Local submissions on the CAF were 85% efficient. The main source of fail-ures of Grid CRAFT jobs are remote stage-out problems, which will be addressed in the future by a new workload management infrastructure. In general, there is a 10% failure rate due to problems within the user code. No relevant bottlenecks were experienced by the system during CRAFT.
10 Summary
Data taking with cosmic ray muons during the CRAFT exercise in 2008, which lasted about a month, has provided a wealth of experience in operating the workflows from recording to analysing the data. The online system and the high level trigger have been operated continuously, and besides stress-testing the general reliability, major functionalities have been exercised. These include the
2010 JINST 5 T03006
definition of streams and primary datasets, and the interaction with associated HLT menus, for which efficient online-offline interplay is essential.
Data handling has been confronted with almost the full qualitative complexity expected for collisions. Most of the Tier-0 related processing has been handled with the final software infra-structure and performed very well. The setup for collisions will still require the ramp-up of the express stream infrastructure for prompt calibration and monitoring, and inclusion of alignment and calibration skims into the Tier-0 processing system. Data distribution via the PhEDEx system performed very well overall. Re-reconstruction at the Tier-1 sites was performed with adequate turn-around time, but showed the need of a system with full accountability, which will be intro-duced by spring 2010.
Event reconstruction has used various algorithms dedicated to cosmic ray muons, but in addi-tion used CRAFT to commission the methodology for collisions. A comprehensive set of recon-structed objects has been provided to support the analysis of the CRAFT data. The workflow for fast deployment of code corrections presented some organisational challenges, and while solutions were generally available quickly, several improvements for future operation were implemented. Data quality monitoring was performed both at the online and offline levels, and regular DQM shifts were run continuously. Remote CMS centres fully participated in this process. Further certification and validation of the data were performed by prompt feedback groups who analysed the output of the prompt reconstruction, and discovered time-dependent developments which were correlated to intentional changes in the detector conditions.
Essentially all alignment and calibration constants accessible with cosmic ray muon data tak-ing have been determined durtak-ing CRAFT, thus putttak-ing the correspondtak-ing framework through a very comprehensive test. The associated organizational challenges with a large number of concur-rent workflows, properly respecting the interdependencies, were successfully addressed. Several reprocessing campaigns with successively improved constants have been performed, which pro-vided a very high data-quality sample for cosmic ray analysis. The conditions database, which is a sophisticated network of commercial relational database management servers with proxies and mechanisms to provide distributed access, proved to be a solid basis for all conditions-related op-erations.
The large sample of cosmic ray data also provided a realistic test of the distributed analysis system. Limitations in job execution efficiency were traced to remote file staging issues, which will be addressed by future improvements in the workload management system. Overall, CRAFT has shown that CMS has highly reliable methods at its disposal to make data samples available with short latency for analysis at remote centres.
In conclusion, CRAFT has demonstrated the proper functioning of the overall CMS workflow machinery to a very high degree. While the challenge has been instrumental in identifying indi-vidual areas which need some further improvements, the overall system is well designed and is expected to scale smoothly to data taking with LHC collisions.
Acknowledgments
We thank the technical and administrative staff at CERN and other CMS Institutes, and ac-knowledge support from: FMSR (Austria); FNRS and FWO (Belgium); CNPq, CAPES, FAPERJ,
2010 JINST 5 T03006
and FAPESP (Brazil); MES (Bulgaria); CERN; CAS, MoST, and NSFC (China); COLCIEN-CIAS (Colombia); MSES (Croatia); RPF (Cyprus); Academy of Sciences and NICPB (Estonia); Academy of Finland, ME, and HIP (Finland); CEA and CNRS/IN2P3 (France); BMBF, DFG, and HGF (Germany); GSRT (Greece); OTKA and NKTH (Hungary); DAE and DST (India); IPM (Iran); SFI (Ireland); INFN (Italy); NRF (Korea); LAS (Lithuania); CINVESTAV, CONACYT, SEP, and UASLP-FAI (Mexico); PAEC (Pakistan); SCSR (Poland); FCT (Portugal); JINR (Arme-nia, Belarus, Georgia, Ukraine, Uzbekistan); MST and MAE (Russia); MSTDS (Serbia); MICINN and CPAN (Spain); Swiss Funding Agencies (Switzerland); NSC (Taipei); TUBITAK and TAEK (Turkey); STFC (United Kingdom); DOE and NSF (USA). Individuals have received support from the Marie-Curie IEF program (European Union); the Leventis Foundation; the A. P. Sloan Founda-tion; and the Alexander von Humboldt Foundation.
References
[1] CMS collaboration, The CMS experiment at the CERN LHC,2008 JINST 3 S08004. [2] L. Evans and P. Bryant eds., LHC Machine,2008 JINST 3 S08001.
[3] CMS collaboration, Commissioning of the CMS experiment and the cosmic run at four tesla,2010 JINST 5 T03001.
[4] P. Sphicas ed., CMS: The TriDAS project. Technical design report, Vol. 2: Data acquisition and high-level trigger,CERN-LHCC-2002-026.
[5] C. Jones et al., “The new CMS event data model and framework”, in Proceedings for Computing in High-Energy Physics (CHEP ’06), Mumbai, India, February 2006.
[6] G. Bauer et al., The run control and monitoring system of the CMS experiment,J. Phys. Conf. Ser. 119 (2008) 022010[PoS(ACAT)026].
[7] E. Meschi, High level trigger configuration and handling of trigger tables in the CMS filter farm,J. Phys. Conf. Ser.119 (2008) 022011.
[8] B.J. Blumenfeld, D. Dykstra, L. Lueking and E. Wicklund, CMS conditions data access using FroNTier,J. Phys. Conf. Ser.119 (2008) 072007.
[9] CMS collaboration, CMS: The computing project. Technical design report,CERN-LHCC-2005-023. [10] Worldwide LHC Computing Grid (WLCG),http://lcg.web.cern.ch/LCG/public/default.htm.
[11] M. Aderholz et al., Models of networked analysis at regional centres for LHC experiments (MONARC). Phase 2 report,CERN-LCB-2000-001.
[12] R. Brun and F. Rademakers, ROOT: an object oriented data analysis framework,Nucl. Instrum. Meth. A 389 (1997) 81;
see alsohttp://root.cern.ch.
[13] D. Mason, Remote Operation of the global CMS Data and Workflows, talk given at the Computing in High-Energy Physics Conference (CHEP ’09), Prague, Czech Republic, March 2009.
[14] CERN Batch Services (LSF),http://batch.web.cern.ch/batch.
[15] CERN Advanced STORage Manager 2 (CASTOR2),http://castor.web.cern.ch/castor/.
[16] S. Wakefield et al., Large Scale Job Management and Experience in Recent Data Challenges within the LHC CMS experiment, in Proceedings for XII Advanced Computing and Analysis Techniques in Physics Research, Erice, Italy, November 2008.
2010 JINST 5 T03006
[17] R. Egeland et al., Data transfer infrastructure for CMS data taking, in Proceedings for XII AdvancedComputing and Analysis Techniques in Physics Research, Erice, Italy, November 2008. [18] The gLite File Transfer Service,http://egee-jra1-dm.web.cern.ch/egee-jra1-dm/FTS/. [19] Storage Resource Management (SRM) Working Group,https://sdm.lbl.gov/srm-wg/. [20] Python Programming Language,http://www.python.org.
[21] MySQL,http://www.mysql.com.
[22] Enabling Grids for E-sciencE (EGEE),http://www.eu-egee.org. [23] Nordugrid,http://www.nordugrid.org.
[24] Open Science Grid,http://www.opensciencegrid.org.
[25] CMS collaboration, Time reconstruction and performance of the CMS electromagnetic calorimeter,
2010 JINST 5 T03011.
[26] D. Benedetti et al., Tracking and Alignment with the Silicon Strip Tracker at the CMS Magnet Test Cosmic Challenge,CMS-NOTE-2007-030(2007),
http://cms.cern.ch/iCMS/jsp/openfile.jsp?type=NOTE&year=2007&files=NOTE2007 030.pdf. [27] T. Christiansen, The CMS magnet test and cosmic challenge,arXiv:0805.1882.
[28] W. Adams et al., Track Reconstruction with Cosmic Ray Data at the Tracker Integration Facility, CMS-NOTE-2009-003 (2009),
http://cms.cern.ch/iCMS/jsp/openfile.jsp?type=NOTE&year=2009&files=NOTE2009 003.pdf. [29] CMS collaboration, Alignment of the CMS silicon tracker during commissioning with cosmic rays,
2010 JINST 5 T03009.
[30] CMS collaboration, Performance of CMS muon reconstruction in cosmic-ray events,2010 JINST 5 T03022.
[31] L. Tuura et al., CMS data quality monitoring: systems and experiences, in Proceedings for Computing in High-Energy Physics (CHEP ’09), Prague, Czech Republic, March 2009. [32] L. Tuura et al., CMS data quality monitoring web service, in Proceedings for Computing in
High-Energy Physics (CHEP ’09), Prague, Czech Republic, March 2009.
[33] G. Bauer et al., The Run Control System of the CMS Experiment, in Proceedings for Computing in High-Energy Physics (CHEP ’07), Victoria B.C., Canada, September 2007.
[34] W. Badgett et al., CMS Online Web-Based Monitoring and Remote Operations, in Proceedings for Computing in High-Energy Physics (CHEP ’07), Victoria B.C., Canada, September 2007. [35] A. Afaq et al., The CMS dataset bookkeeping service,J. Phys. Conf. Ser.119 (2008) 072001.
[36] E. Gottschalk et al., CMS Centres Worldwide: a New Collaborative Infrastructure, in Proceedings for Computing in High-Energy Physics (CHEP ’09), Prague, Czech Republic, March 2009.
[37] E. Gottschalk et al., “Collaborating at a Distance: Operations Centres, Tools, and Trends”, in Proceedings for Computing in High-Energy Physics (CHEP ’09), Prague, Czech Republic, March 2009.
[38] P. Kreuzer et al., Building and Commissioning of the CMS CERN Analysis Facility (CAF), in Proceedings for Computing in High-Energy Physics (CHEP ’09), Prague, Czech Republic, March 2009.
[39] D. Futyan et al., “The CMS Computing, Software and Analysis Challenge”, in Proceedings for Computing in High-Energy Physics (CHEP ’09), Prague, Czech Republic, March 2009.
2010 JINST 5 T03006
[40] CMS collaboration, Commissioning of the CMS High-Level Trigger with cosmic rays,2010 JINST 5T03005.
[41] CMS collaboration, Alignment of the CMS muon system with cosmic-ray and beam-halo muons,2010 JINST 5 T03020.
[42] CMS collaboration, Aligning the CMS muon chambers with the muon alignment system during an extended cosmic ray run,2010 JINST 5 T03019.
[43] CMS collaboration, Calibration of the CMS drift tube chambers and measurement of the drift velocity with cosmic rays,2010 JINST 5 T03016.
[44] CMS collaboration, Performance and operation of the CMS electromagnetic calorimeter,2010 JINST 5 T03010.
[45] M. Gonzalez-Berges, The joint controls project framework,physics/0305128.
[46] Z. Xie et al., Pool persistency framework for LHC: New developments and CMS applications, in Proceedings for 4th International Workshop on Frontier Science, Milan Biococca, Italy, September 2005.
[47] R. Urbano, Oracle Database 2 Day + Data Replication and Integration Guide, 11g, Oracle, release 1 (11.1) edition (2008).
[48] M. De Gruttola et al., First experience in operating the population of the condition database of the CMS experiment, in Proceedings for Computing in High-Energy Physics (CHEP ’09), Prague, Czech Republic, March 2009.
[49] D. Spiga et al., The CMS Remote Analysis Builder (CRAB),Lect. Notes Comput. Sci.4873 (2007) 580.