ISPRS Int. J. Geo-Inf. 2018, 7, x; doi: FOR PEER REVIEW www.mdpi.com/journal/ijgi Article
1
A Field Data Acquisition Method and Tools for
2Hazard Evaluation of Earthquake-Induced
3Landslides with Open Source Mobile GIS
4Mauro De Donatis 1,*, Giulio F. Pappafico 1 and Roberto W. Romeo 1
5
1 Department of Pure and Applied Sciences, University of Urbino ‘Carlo Bo’, Urbino, Italy
6
* Correspondence: [email protected]; Tel.: +390722304295
7
Received: date; Accepted: date; Published: date
8
Abstract: The PARSIFAL (Probabilistic Approach to pRovide Scenarios of
9
earthquake Induced slope FAiLures) method was applied to the survey of post-10
earthquake landslides in central Italy for seismic microzonation purposes. In order 11
to optimize time and resources, while also reducing errors, the paper-based method 12
of survey data sheets was translated into digital formats using such instruments as 13
Tablet PCs, GPS and open source software (QGIS). To the base mapping consisting 14
of Technical Regional Map (Carta Tecnica Regionale - CTRs) at the scale of 1:10000, 15
layers were added with such sensitive information as the Inventory of Landslide 16
Phenomena in Italy (Inventario dei Fenomeni Franosi in Italia - IFFI), for example. 17
A database was designed and implemented in the SQLite/SpatiaLite Relational 18
DataBase Management System (RDBMS) to store data related to such elements as 19
landslides, rock masses, discontinuities and covers (as provided by PARSIFAL). To 20
facilitate capture of the datum on the ground, data entry forms were created with 21
Qt Designer. In addition to this, the employment of some QGIS plug-ins, developed 22
for digital surveying andenabling of quick annotations on the map and the import 23
of images from external cameras, was found to be of considerable use. 24
Keywords: field mapping; QGIS; NMEA GPS; RDBMS
25 26
1. Introduction and Aims
27
Acquiring data in the field is a common practice for geologists. The traditional 28
system, which is still in use, involves data collecting on maps and on paper 29
notebooks, and from this the transition is being made to digital gathering of data 30
and information. When timing, accuracy, and group work are of the essence, digital 31
methods allow quick, shared, and accurate results to be achieved [1]. 32
For the seismic microzonation work of the area between Arquata and Pescara 33
del Tronto, carried out following the seismic event of 24 August 2016 in central Italy, 34
geological/technical surveys were completed on the earthquake-induced landslides. 35
For this purpose, the PARSIFAL (Probabilistic Approach to pRovide Scenarios 36
of earthquake Induced slope FaiLures) method [2,3,4] was used to analyse the data 37
that were initially acquired using paper survey data sheets, and then transferred this 38
information into a GIS database. At any rate, considering that, for a number of years, 39
a variety of systems have been in use for the digital acquisition of data in the field 40
[5,6,7]), mobile GIS was subsequently adopted in order to be able to digitally survey 41
and archive data and information directly in the field. The digital survey system, 42
which has been in use for years for landslide mapping [8,9,10,11], was prepared as 43
needed, providing it with a database and forms to acquire data ready for subsequent 44
processing. 45
The aim of this paper is to explain a new relational database (SQLite/SpatiaLite) 46
and provide a free field digital tool based on an open source GIS (see Appendix) for 47
any surveyor working with the PARSIFAL method. 48
2. The PARSIFAL Method
49
Different methods of hazard assessment for earthquake-induced landslides are 50
proposed in the scientific and technical literature [12,13,14]. 51
The PARSIFAL method was elaborated by CERI-Sapienza (Centre for Research 52
in Forecasting, Prevention and Control of Geological Risks of “La Sapienza” 53
University) in collaboration with Università di Urbino and ENEA (National Agency 54
for New Technologies, Energy and Sustainable Economic Development). Firstly, it 55
was trialled in certain municipalities of southern Lazio [2]. Then, it was applied in 56
the territory of the municipality of Accumoli (Central Italy) after the series of quakes 57
of 2016-2017 [3] and in the basin of Alcoy (Alicante, South Spain) [4]. 58
The PARSIFAL method has the following main characteristics: 59
- it is set up to assess the hazard posed by first- and second-generation landslides (which
60
is to say landslides that are newly activated, typically coseismic, and reactivations of
pre-61
existing landslides, and as such ones that can already be censused prior to a seismic event);
62
- it performs analyses differentiated by the landslide mechanism (e.g. sliding and
63
overturning of blocks of stone, sliding in the earth, etc.);
64
- it plots summary mapping with indications on the probability of going beyond the
65
thresholds of the coseismic shift if they are exceeded, or on the margins of safety in
66
inappreciable seismic conditions due to shifting, or purely roto-translational kinematics
67
(overturning);
68
- it permits a probabilistic analysis, weighted for each map unit, of the expected effects
69
in terms of the landslide mechanism and its intensity.
70
In particular, the elements required for assessment using PARSIFAL are the data 71
on: i. “rock masses” of the geological substratum present in the survey area; ii. 72
“covers,” for each unit of Quaternary cover outcrop along the slopes; and iii. 73
“landslides,” both newly activated and pre-existing. 74
3. The System for Gathering Data on the Ground for PARSIFAL
75
To guarantee orderly and complete acquisition of the geological/technical data 76
necessary for applying PARSIFAL in the areas affected by the seismic microzonation 77
studies done after the Amatrice quake, paper modules were prepared for the 78
gathering of data by the surveyors (Figure 1). The modules had the purpose of 79
guaranteeing the systematic, univocal gathering of the necessary information, and 80
of easing the acquisition work without hindering the priority surveying [15]. The 81
modules refer to a single observation/measurement station. To aid the surveyor, 82
tables were also provided for definitions and classes from which to obtain the codes 83
of the specific geological/technical data to be entered into the modules (Figure 2). 84
85
Figure 1. Example of the form (for rock masses) for data collecting used in the field survey (modified
86
from the original form in Italian).
88
Figure 2. Example of tables for geotechnical data codes (adapted from ISRM [16]).
89
Specifically, there were three paper modules. Each of them was designed to 90
gather the data on the three types of subjects observed by the surveyors for the 91
purposes of applying PARSIFAL: rock masses, covers, and landslides. 92
The study of the modules directly provided the properties characterizing the 93
database implemented in this work, as there is no other documentation beyond these 94
modules. 95
4. Hardware
96
The fundamental instruments used in this work were: 97
• A Microsoft Surface Pro 3 Tablet PC (Intel Core i5, Processor 256 Gb of SSD 98
and 8Gb of RAM) with Windows 10 operating system, which allowed for very 99
rapid management of the thematic mapping and of the georeferenced raster 100
aerial images; 101
• A 51-channel Bluetooth GPS receiver (NMEA protocol, WAAS EGNOS 102
correction), since the tablet that was used has no internal GPS receiver, and 103
because the one employed guarantees greater precision. 104
The following accessories werealso used: 105
• a dedicated digital pen with Bluetooth link, to be used in place of a mouse, 106
and to draw and write notes using dedicated software tools; 107
• a dedicated cover in plastic and rubber with ergonomic support at the wrist 108
for the tablet’s transportability and protection; 109
• several different models of digital cameras. 110
These instruments have the advantages of lightness and manageability, 111
including in “uncomfortable” conditions like those operators in the field often have 112
to deal with, and as such they are easy to use. The costs which, while being higher 113
than for a laptop with similar technical characteristics, have diminished drastically 114
over the years, permitting their greater availability among geologists. 115
Lastly, there is no denying that the use of the pen on the screen, in addition to 116
greatly facilitating operations that would normally have to be done with a mouse, 117
makes it possible to maintain the “feel” of the traditional, “pen-on-map” surveying 118
method. 119
Of great importance, however, is the availability of software packages allowing 120
the best achievable exploitation of the possibilities the hardware has to offer. 121
5. Software
122
The software used was QGIS (version 2.18), which has been employed for years 123
in field research. The choice of this GIS software is linked to its simple use and to its 124
spread, as well as to the Open Source approach that allows the customization and 125
creation of new tools suited to the requirements of the work in the field. 126
In particular, some plug-ins conceived in the laboratory were developed, thanks 127
to the efforts of some students in their thesis work, and those of outside collaborators 128
[17]. 129
These include BeePen, for free-handed drawing and writing, BeeGPS, to manage 130
GPS data, and BeePic, for the georeferencing of the photos. 131
BeePen creates particular layers of annotation and permits writing by digital pen 132
directly on the map, choosing colours, transparencies, and line thickness, while also 133
inserting notes. Using this tool, the surveyor can use the tablet’s screen like a map 134
on which to annotate any element, as can be done on paper maps. 135
BeeGPS adds functionalities to the GPS module already existing in QGIS, 136
making it possible to enter values that personalize the acquisition of GPS data by 137
choosing an acquisition interval (in seconds). This option is useful when taking 138
points in movement on different modes of transport (on foot, by bike, by car, etc.). 139
The distance threshold, within which the software does not record data, is helpful 140
when the operator stops to make observations or acquire data, thereby eliminating 141
the useless and annoying cloud of points typical of this kind of GPS [18]. 142
BeePic makes it possible to georeference photographs taken using any camera 143
or smartphone, including those not equipped with GPS. The acquisition of the GPS 144
of the mobile GIS, and the EXIF format of the images—containing both sets of 145
temporal information—allow the photos to be synchronized and therefore 146
geolocalised. 147
Moreover, using QT Designer installed along with QGIS, the data acquisition 148
forms—the central object of this work—can be created and customized. 149
6. Database
150
An SQLite/SpatiaLite geographic database was implemented in accordance with 151
the scheme shown in Figure 3, in which the tables lSLide, rMass, cover and disc contain 152
the attributes corresponding to the fields present in the paper modules for acquiring 153
the geological/technical data needed to apply PARSIFAL. 154
The database, called parsifal, contains five main tables and 17 reference tables 155
(Figure 3). The structure of the five main tables (Figure 3a) reflects the organization 156
of the PARSIFAL method’s modules and meets all the prerogatives described in the 157
note by Della Seta et al. [15] and Martino et al. [4]. Three of the five tables store the 158
information regarding the landslide bodies, already censused or newly identified, 159
the fractured rock masses, and the cover terrain. The three tables are respectively 160
named “lSLide,” “rMass,” and “cover” (Figure 3a), and also contain the type of 161
geometry datum for representing the spatial-point elements.
162
Regarding the rock masses, in particular, the PARSIFAL method also calls for 163
entering data regarding the discontinuity systems that relate to the mass, for which 164
an additional table (disc) is provided. This table describes all the information 165
regarding the geometry and characteristics of the discontinuity (Figure 3a). The two 166
tables, rMass and disc, are then associated by means of a “one-to-many” relationship. 167
The photographic documentation is stored in the ph table associated with the 168
three tables—lSLide, rMass, and cover—by means of “one-to-many” relationships 169
(Figure 3a). Each individual landslide, rock mass, or cover terrain can be 170
documented by one or more photographic images. 171
The database also includes six geographic reference tables (Figure 3b) which 172
serve to recover the data regarding the landslides in the inventory of landslide 173
phenomena in Italy (Inventario dei Fenomeni Franosi d’Italia—IFFI [19]), as they are 174
pre-existing landslides. Moreover, it links the recorded information to its territory, 175
by means of the municipality’s ISTAT (Italian National Institute of Statistics) code. 176
Eleven other tables code the specific geological/technical data required by the 177
PARSIFAL method (Figure 3c), such as the type of rock mass, its degree of alteration, 178
the roughness of the profile of the rock surface, the degree of alteration of the rocky 179
material, and the grain size classification of the landslide material. 180
181
Figure 3. Parsifal database schema: (a) core tables; (b) reference geographic tables; (c) reference tables
182
for geotechnical data coding (for all tables attributes and codes see the HTML file mentioned in
183
Appendix A and linked here http://www.geologiapplicata.uniurb.it/download/parsifal.html).
184
The attributes of the database’s tables are linked to the fields of a series of forms 185
made using Qt Designer. The forms are designed for use within the QGIS graphic 186
interface; they, in turn, constitute the graphic interface with the PARSIFAL 187
geographic database, which allows the surveyor to quickly record the data whose 188
proper entry and integrity the databaseis ensured. 189
The SQL source code for creating the database, and the corresponding 190
documentation, can be downloaded from the links reported in Appendix A. 191
7. Input Forms
192
Three forms were configured for the purpose of easing the acquisition of data 193
on the ground and storing it directly in the “parsifal” database, and they correspond 194
to the main elements being surveyed: landslides, rock masses, and covers. Each of 195
the three forms is a tabbed form composed of multi-pages, accessible through the 196
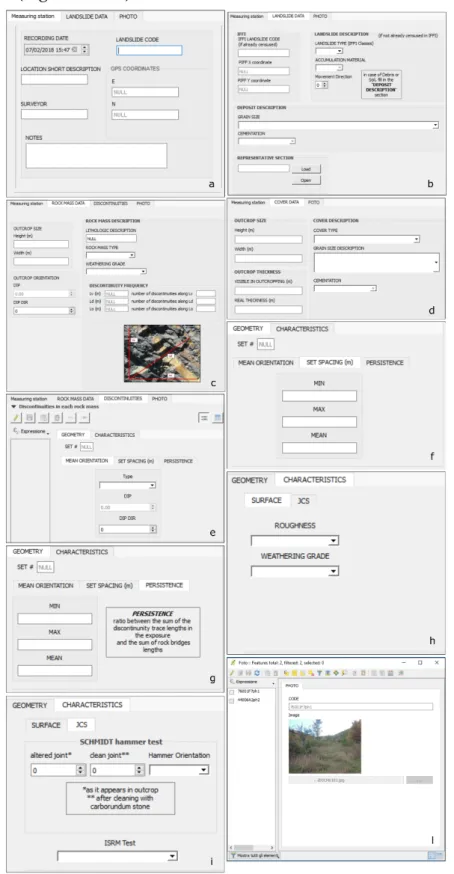
respective tabs (Figure 4a,c,d). 197
198
Figure 4. Data acquisition forms: (a) Landslide data recording form where the “Landslide Code” and
199
“GPS Coordinates” fields are automatically filled; (b) “Landslide” tab attributes; (c) Attributes of the
200
“Rock Mass” tab; (d) Attributes of the “Cover” tab for recording cover Quaternary deposits data; (e)
201
“Discontinuities” tab showing the two main form pages “Geometry” and “Characteristics”; (f) Fields
202
of “Set Spacing (m)” tab where minimum, maximum and mean spacing values of a single set of
203
discontinuities can be recorded; (g) Fields of “Persistence” tab where minimum, maximum, and mean
persistence values of a single set of discontinuities can be recorded; (h) “Characteristics” tab showing
205
the form pages “JCS” and “Surface” where the “Roughness” and “Weathering Grade” fields are
206
included; (i) “JCS” form page showing the fields to be populating with the joint wall compressive
207
strength test results; (l) “Photo” tab including “Photo Code” showing the image preview and file path.
208
The first form page (Figure 4a), common to the three types of elements observed, 209
allows the common data (measuring station, surveyor, and date) to be entered. The 210
station coordinates (“GPS Coordinates”) are automatically recorded thanks to the 211
action of a trigger, which is executed at the moment of the digitization of the point 212
representing the station (see the SQL code mentioned in Appendix A, from line 111 213
to line 117, for the “Landslide” element; from line 283 to line 289 for the “Mass” 214
element; and from line 413 to line 419 for the “Cover” element). 215
The “Landslide Code,” “Rock Mass Code,” and “Cover Code” fields, in the 216
respective “Measuring station” form pages, are also compiled by the action of the 217
respective triggers performed at the moment the data are saved (from line 82 to line 218
106 for the “Landslide Code”; from line 254 to line 278 for the “Rock Mass Code” 219
and from line 384 to line 408 for the “Cover Code” in the SQL code mentioned in 220
Appendix A). 221
The second form page, named “Landslide” in the case of landslides, “Rock 222
Mass” in the case of rock masses, and “Cover” in the case of covers, contains the 223
attributes whose values must be recorded for the application of the Parsifal method, 224
and differs depending on the type of element observed. 225
1. In the case of landslides, the attributes are (Figure 4b): 226
• “IFFI Landslide Code”, to be compiled in the event of a landslide already 227
present in the inventory of landslide phenomena in Italy (IFFI). The code’s 228
value may be obtained by querying the PIFF point (Punto Identificativo del 229
Fenomeno Franoso—“landslide event identification point”) from the map
230
and copying the value contained in the “IDFRANA” field, the univocal 231
identifier of the landslides on the national inventory. 232
• “PIFF X coordinate” and “PIFF Y coordinate” of the IFFI’s landslide event 233
identification point (PIFF): the fields of the two attributes are automatically 234
populated once the “IFFI Landslide Code” is entered and the data are 235
saved, through execution of the trigger as per line 124 to line 147 of the SQL 236
code mentioned in Appendix A. 237
• “Landslide Type”, “Accumulation Material”, “Grain Size”, and 238
“Cementation” are attributes whose values may be selected from the 239
respective drop-down lists present in the form. The fields are linked to the 240
attributes of the database’s reference tables containing the codes of the 241
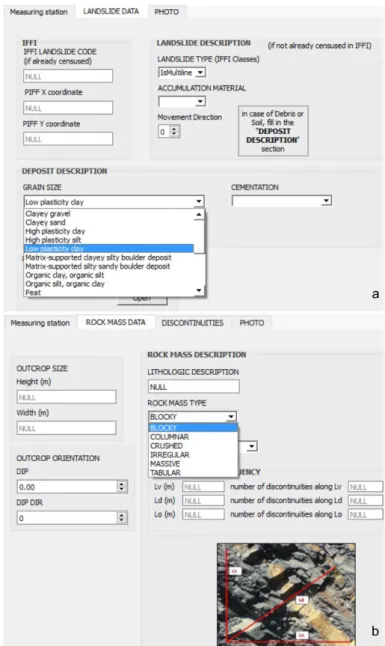
geological/technical data required by the Parsifal method (Figure 5a). 242
243
Figure 5. Input forms with combo boxes containing a drop-down list of the geotechnical data values
244
required by the Parsifal method: (a) example of “Grain Size” attributes; (b) example of “Rock Mass
245
Type” attributes.
246
2. In the case of rock masses, the fields to be compiled consider the following 247
attributes (Figure 4c): 248
• “Height” and “Width” to enter the outcrop’s dimensions. 249
• “Outcrop Orientation” to record bedding measurements (“DIP” and “DIP 250
DIR”). 251
• Three fields which, together, contribute to the description of the rock mass: 252
“Lithologic Description”, “Rock Mass Type”, and “Weathering Grade”, 253
whose values may be selected from the respective drop-down lists present 254
in the form. In this case the fields are linked to the attributes of the 255
database’s reference tables containing the codes of the geological/technical 256
data required by the Parsifal method (Figure 5b). 257
• “Discontinuity Frequency” is a characteristic defined by the set of six 258
attributes represented by the “number of discontinuities along 259
‘Lv’|‘Ld’|‘Lo’”— respectively, for the directions Lv, Ld, Lo, their lengths 260
expressed in metres are entered. 261
262
3. In the case of covers, the fields to be filled in consider the following attributes 263
(Figure 4d): 264
• “Height” and “Width” to enter the dimensions related to the outcrop. 265
• “Outcrop Thickness” to be evaluated to the visible cover in outcropping, 266
and “Real Thickness (m)” when this may be measured. 267
• “Cover Type”, “Grain Size Description”, and “Cementation”, whose 268
values may be selected from the respective drop-down lists present in the 269
form (Figure 4d). In this casethe fields are linked to the attributes of the 270
database’s reference tables containing the codes of the geological/technical 271
data required by the PARSIFAL method. 272
273
The “Discontinuities” form page (Figure 4e) is used to record a series of 274
parameters necessary to characterize the discontinuity sets recognized in the mass 275
being observed. The discontinuity sets may be one or more than one in number; the 276
“SET #” field visible under the “Geometry” tag shows the number of discontinuity 277
sets to which the parameters refer. 278
The data on the discontinuities are stored in the “parsifal” database’s “disc” 279
table. This table is associated with the “rMass” table by means of an external key in 280
accordance with a one-to-many relationship, and therefore each mass is associated 281
with one or more discontinuity sets. 282
For each set, it is possible to record a set of parameters distributed in two 283
additional form pages of the “Discontinuity” form: “Geometry” and 284
“Characteristics” (Figure 4e). 285
a. The “Geometry” form has three additional form pages: 286
1. “Mean Orientation”: the fields to be compiled consider the following 287
attributes: 288
• “Type”: values may be selected from a drop-down list of 289
discontinuity types. 290
• “DIP”: inclination of the discontinuity surface. 291
• “DIP DIR”: direction of immersion of the discontinuity. 292
2. “Set Spacing (m)”: contains the fields related to the attributes (Figure 293
4f): 294
• “MIN”: minimum spacing of the individual discontinuity set. 295
• “MAX”: maximum spacing of the individual discontinuity set. 296
• “MEAN”: average value of the spacing of the individual 297
discontinuity set. 298
3. “Persistence”: presents the following fields to be compiled (Figure 4g): 299
• “MIN”: minimum value of the persistence of the individual 300
discontinuity set. 301
• “MAX”: maximum value of the persistence of the individual 302
discontinuity set. 303
• “MEAN:” average value of the persistence of the individual 304
discontinuity set. 305
306
b. The “Characteristics” form (Figure 4h) has two additional pages: 307
1. “Surface”: the fields to be compiled, which consider the following 308
attributes: 309
• “Roughness”: descriptive of the ISRM [16] standards, and may 310
be selected from a drop-down list. 311
• “Weathering Grade”, whose values express the degree of 312
alteration in accordance with ISRM [16] standards, and may be 313
selected from a drop-down list. 314
2. “JCS” (Joint wall Compressive Strength), which marks the tab, is the 315
compressive strength of the joints’ walls. It is defined by the values of 316
the characteristic results of the “Schmidt hammer test” and of the 317
“Manual index test” (ISRM Test) to be entered into the following fields 318 (Figure 4i): 319 • “altered joint”. 320 • “clean joint”. 321
• “Hammer Orientation”: the description may be selected from a 322
drop-down list. 323
• “ISRM Test”: this is intended as the result of the “Manual index 324
test”, whose value may be selected from a drop-down list. 325
326
The third form page (“Photo”) is common to the three elements that may be 327
observed (landslides, rock masses, and covers), and is used to enter the information 328
regarding the images depicting their characteristics (Figure 4l). The data related to 329
the images are stored in the “parsifal” database’s “ph” table. This table is associated 330
with the “lSlide”, “rMass”, and “cover” tables, using the external keys in accordance 331
with one-to-many relationships, for which each landslide, mass, or cover is 332
associated with one or more images. The form page has the following fields: 333
• The “Photo Code” is compiled by the action of a series of triggers (from line 334
491 to line 537 of the SQL code mentioned in Appendix A) performed at the 335
moment the data are saved. 336
The photo’s code is composed of the code previously assigned by the system to 337
the element observed on the ground to which the image refers (landslide, rock 338
masses, or cover), by the initial (“L” in the case of landslide, “R” in the case of rock 339
mass, and “C” in the case of cover), and by the primary serial key of the recorded 340
image. 341
• “Photo”: the name of the “ph” table’s field present in the database, in which 342
the image’s path and file name are stored. To load an image’s path and file 343
name from the folder where it was saved and store it in the database, the 344
QGIS “Photo” widget is used, which also allows the image to be previewed 345
in an area of the form page (Figure 4l). 346
8. Other Data and Information
347
In addition to acquiring data "structured" in tabular form using the survey 348
sheets system illustrated above, mobile GIS, customized with certain plug-ins and 349
other accessory programs, made it possible to capture and manage information that 350
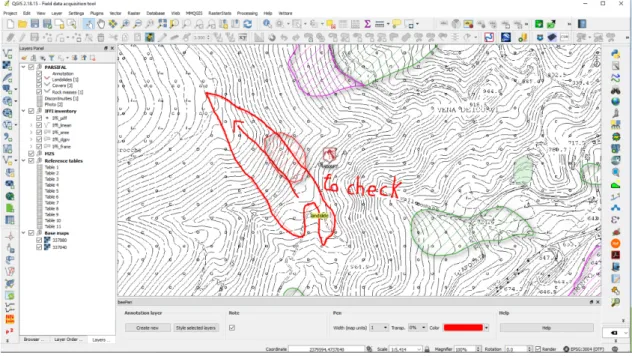
was useful for the final processing. In particular, the BeePen module allowed the 351
digital pen to draw certain notes quickly and directly on the monitor map (Figure 352
6). In fact, speed is an important requirement in digital fieldwork. In this case, for 353
example, some quick corrections were made to the landslide and outcrop limits that 354
were available from the IFFI mapping (Landslides Catalogue from the “Italian 355
National Geoportal”) or new acquisitions of landslides not surveyed earlier were 356
made, perhaps while entering some indications and comments. These lines were 357
then digitized in a new layer. 358
359
Figure 6. QGIS window with layers of the PARSIFAL project. The BeePen plug-in (at the bottom)
360
allows sketches and annotations on the map, as shown.
361
BeePic, on the other hand, made it possible to geolocalise the photos taken with 362
a number of devices, and also by different operators. This method is the result of 363
extreme utility in positioning the picture-taking points on subsequent days in the 364
laboratory, thus making the work in the field quicker and more efficient. 365
9. Comparative Experiences on the Field and in the Laboratory
366
The work of data gathering in the field was done for some days by two 367
surveyors. The first used paper sheets and maps, while the second used the digital 368
tools described above. 369
At the start of the survey, the "analog" operator gathered data using paper 370
sheets, maps, a field notebook, and a digital camera. 371
The collected photos, sheets, and information reported on the map were then 372
transcribed and digitised, georeferencing them to a GIS project after it was back in 373
the laboratory. 374
The “digital” operator carried out the survey using the same procedures as the 375
first operator, but accelerating and often improving the positioning thanks to the 376
GPS. The greater difference, at any rate, was the entry of the data within the GIS 377
project directly in the field. Some photos were entered into the sheets directly and 378
others at a later time, both during some phases of interruption of the survey and in 379
the laboratory, using BeePic. In addition to reporting the points of the stations, it was 380
possible to draw in the same manner as drawing on paper—which is to say using a 381
pen on the map—the indications of landslides not reported by the official inventories 382
(some of very recent activation), which were then redrawn on a special layer in the 383
laboratory. 384
The first, “analog” case required a longer working time. Moreover, in some 385
cases, it was modified in subsequent checks, where errors, doubts, or inconsistencies 386
were highlighted. 387
In the digital survey, subsequent laboratory work was also needed to better 388
arrange or complete tables and photo insertions, howerver, in addition to taking 389
place in a decisively quicker timeframe than in the first case, doubts and errors were 390
promptly resolved by the sketches or annotations outlined directly on the map. It 391
was then possible to maintain in the design both the layers used for the survey and 392
the subsequent ones of laboratory synthesis of the mapping product and final 393
databases. 394
10. Conclusions
395
In this experience, in nearly emergency conditions, the digital surveying method 396
turned out to be a considerable aid both in the acquisition phase and in the data 397
processing phase. 398
In particular, the method’s strong points may be defined as follows: 399
1. Surveying efficiency: the times both of the survey on the ground and those 400
following processing and synthesis were reduced. 401
2. Precision in positioning: the GPS that made it possible to follow the 402
movements and the positioning of the station points in many cases were more 403
accurate, particularly when far from certain map references (e.g. climbing up 404
a ditch in a wooded area). 405
3. Elimination of errors due to subsequent transcriptions/digitisations: this error 406
is frequent during the transfer of data from a paper map to a digital one [20], 407
in addition to the transcription of data from paper sheets to database tables. 408
In this case, the intervention was completed with changes after entry, while 409
this further checking work was not necessary for the data digitally captured 410
in the field. 411
4. Maintenance of the traditional “pen-on-map” surveying system: in some way, 412
the traditional surveying system was maintained thanks to the use of tools 413
that display the mapping and permit writing and drawing as can be done on 414
paper. 415
5. Ability to acquire “non-structured” information of importance for subsequent 416
interpretations: the information reported through annotations with signs and 417
drawings on the map was of use for processing with greater precision in the 418
laboratory (when it was a matter, for example, of redrawing the landslide 419
bodies), and also for recalling certain elements of use for processing data. 420
6. Simplification of group work among surveyors: although in this project, the 421
two surveyors actually used two different systems (analog and digital), the 422
simplification in gathering data digitally is clear, thereby in some cases 423
reducing surveyor subjectivity. 424
Author Contributions: Conceptualization, Mauro De Donatis, Giulio Fabrizio Pappafico and Roberto Walter
425
Romeo; Funding acquisition, Mauro De Donatis; Methodology, Mauro De Donatis; Project administration,
426
Mauro De Donatis; Software, Giulio Fabrizio Pappafico; Supervision, Mauro De Donatis; Validation, Mauro De
427
Donatis and Roberto Walter Romeo; Writing – original draft, Mauro De Donatis, Giulio Fabrizio Pappafico and
428
Roberto Walter Romeo; Writing – review & editing, Mauro De Donatis, Giulio Fabrizio Pappafico and Roberto
429
Walter Romeo.
430
Acknowledgments: This work is part of the project "Identification and characterization of the system of
431
seismogenic faults in the earthquake of Cagli in 1781" of "Research enhancing program 2017" funded by DISPEA
432
(Department of Pure and Applied Sciences) of Urbino University.
433
Conflicts of Interest: The authors declare no conflict of interest.
434
The founding sponsors had no role in the design of the study; in the collection, analyses, or interpretation of
435
data; in the writing of the manuscript, and in the decision to publish the results
436
Appendix A
437
The RDBMS SQLite/SpatiaLite database is available as an SQL file at this web 438
page: https://listauniurb.jimdo.com/parsifal/, where an HTML file (parsifal.html) is 439
also available for textual and graphic documentation of the database tables and 440
fields. 441
A QGIS project ready for field survey with data entry forms and IFFI (Inventory 442
of Landslide Phenomena in Italy) database can be downloaded from the same web 443
page. 444
References
445
1. De Donatis, M.; Susini, S.; Foi, M. Geology from real field to 3D modeling and Google Earth virtual
446
environments: Methods and goals from the Apennines (Furlo Gorge, Italy). GSA Special Papers In Google
447
Earth and Virtual Visualizations in Geoscience Education and Research; Whitmeyer, S. J., Bailey, J. E., De Paor,
448
D. G., Ornduff, T., Eds.; Geological Society of America, 2012; Volume 492, ISBN 978-0-8137-2492-8, doi:
449
10.1130/2012.2492(16).
450
2. Esposito, C.; Martini, G.; Martino, S.; Pallone, F.; Romeo, R. W. A methodology for a comprehensive
451
assessment of earthquake-induced landslide hazard, with an application to pilot sites in Central Italy. In
452
Proceedings of the XII International Symposium on Landslides (ISL), Naples, Italy, 12-19 June 2016, pp.
453
869-877.
454
3. Della Seta, M.; Di Martino, G.; Esposito, C.; Giannini, L. M.; Martini, G.; Martino, S.; Pallone, F.; Troiani, F.
455
Application of the Parsifal approach for providing scenarios of earthquake-induced landslide in the
456
Accumoli Municipality. In Riassunti Estesi delle Comunicazioni, GNGTS 36° Convegno Nazionale, Trieste,
457
Italy, 2017, pp. 345-346. ISBN: 978-88-940442-8-7.
4. Martino, S.; Battaglia, S.; Delgado, J.; Esposito, C.; Martini, G.; Missori, C. Probabilistic Approach to Provide
459
Scenarios of Earthquake-Induced Slope Failures (PARSIFAL) Applied to the Alcoy Basin (South Spain).
460
Geosciences 2018, 8(2), 57, doi: 10.3390/geosciences8020057.
461
5. Jordan, C. J.; Bee, E. J.; Smith, N. A.; Lawley, R. S.; Ford, J.; Howard, A. S.; Laxton, J. L. The Development
462
of Digital Field Data Collection Systems to Fulfil the British Geological Survey Mapping Requirements. In
463
GIS and Spatial Analysis, Proceedings of IAMG ’05: The Annual Conference of the International
464
Association for Mathematical Geology, Toronto, August 21-25, 2005; Cheng, Q., Bonham-Carter, G., Eds.;
465
2005; pp. 886-891.
466
6. Clegg, P.; Bruciatelli, L.; Domingos, F.; Jones, R. R.; De Donatis, M.; Wilson, R. W. Digital geological
467
mapping with tablet PC and PDA: a comparison. Computers & Geosciences 2006, 32, 1682-1689.
468
7. De Donatis, M.; Bruciatelli, L. MAP IT: the GIS software for field mapping with tablet pc. Computers &
469
Geosciences 2006, 32, 673-680, doi:10.1016/j.cageo.2005.09.003.
470
8. Gallerini, G.; De Donatis, M.; Baioni, D.; Bruciatelli, L. Landslide field mapping with tablet pc. A new
471
integrated approach. In Landslides and Avalanches, Proceedings of the 11th International Conference and
472
Field Trip on Landslides, Norway, 1.10 September 2005; pp. 107-113.
473
9. Baioni, D.; De Donatis, M.; Gallerini, G.; Bruciatelli, L. Il mobile-gis per la geologia ambientale: il
474
rilevamento digitale applicato alle frane. Geologia dell'Ambiente 2007, 15, 21-26.
475
10. Gallerini, G.; De Donatis, M. Rilevamento digitale delle frane: applicazione della scheda IFFI. Rendiconti
476
della Società Geologica Italiana 2007, Volume 4, 49-53.
477
11. Evans, H.; Pennington, C.; Jordan, C.; Foster, C. Mapping a Nation’s Landslides: A Novel Multi-Stage
478
Methodology. In Landslide Science and Practice, Margottini C., Canuti P., Sassa K., Eds.; Springer: Berlin,
479
Heidelberg, 2013; Volume 1, pp. 21–27, doi: 10.1007/978-3-642-31325-7_2.
480
12. Chousianitis K., Del Gaudio V., Sabatakakis N., Kavoura K., Drakatos G., Bathrellos G.D., Skilodimou H.D.
481
(2016): Assessment of earthquake-induced landslide hazard in Greece: From Arias Intensity to spatial
482
distribution of slope resistance demand. B Seismol Soc Am, 106 (1): 174–188, doi: 10.1785/0120150172.
483
13. Luo H., Chen T. (2016): Three-Dimensional Surface Displacement Field Associated with the 25 April 2015
484
Gorkha, Nepal, Earthquake: Solution from Integrated InSAR and GPS Measurements with an Extended
485
SISTEM Approach. Remote Sens., 8 (7): 559, doi: 10.3390/rs8070559.
486
14. Zhou, S.; Chen, G.; Fang, L. Distribution Pattern of Landslides Triggered by the 2014 Ludian Earthquake
487
of China: Implications for Regional Threshold Topography and the Seismogenic Fault Identification. ISPRS
488
International Journal of Geo-Information 2016, 5, doi:10.3390/ijgi5040046.
489
15. Della Seta, M.; Esposito, C.; Martini, G.; Martino, S.; Romeo, R. W.; Troiani, F. Nota introduttiva sul metodo
490
PARSIFAL in vista della sua applicazione negli studi di MS dei comuni terremotati dal sisma di Amatrice
491
del 24 Agosto 2016. Allegato alla documentazione per l’applicazione del metodo Parsifal negli studi di MS.
492
Retrieved from https://listauniurb.jimdo.com/parsifal/. (unpublished).
493
16. ISRM Suggested methods for the quantitative description of discontinuities in rock masses. International
494
Journal of Rock Mechanics and Min. Sciences & Geomechanics, 1978, Abstracts, 15, pp. 319-368.
495
17. De Donatis, M.; Alberti, M.; Cesarini, C.; Menichetti, M.; Susini, S. Open Source GIS for geological field
496
mapping: research and teaching experience. PeerJ Preprints 2016, doi: 10.7287/peerj.preprints.2258v3.
497
18. Mussumeci, G.; Scianna, A.; Siligato, G.; Villa, B. Impiego dei ricevitori GPS a basso costo per applicazioni
498
GIS e catastali: limiti e potenzialità. In GEOMATICA standardizzazione, interoperabilità e nuove
499
tecnologie, Proceedings 8a Conferenza Nazionale ASITA, Roma; 2004; ISBN 88–900943-6-2, pp. 1535-1539.
500
19. ISPRA Landslides in Italy.Special Report 2008, ISPRA Rapporti 83/2008; ISBN 978-88-448-0355-1.
501
20. Campbell, E.; Duncan, I.; Hibbitts, H. Analysis of Errors Occurring in the Transfer of Geologic Point Data
502
from Field Maps to Digital Data Sets. Digital Mapping Techniques '05-Workshop Proc. 2005, 61-65.
503
21.
504
22.
505
© 2018 by the authors. Submitted for possible open access publication under the terms and
506
conditions of the Creative Commons Attribution (CC BY) license
507
(http://creativecommons.org/licenses/by/4.0/).

![Figure 2. Example of tables for geotechnical data codes (adapted from ISRM [16]).](https://thumb-eu.123doks.com/thumbv2/123dokorg/4773082.48008/4.892.269.623.117.679/figure-example-tables-geotechnical-data-codes-adapted-isrm.webp)