2 Sustainable Development and Sustainability Indicators
2.1 Definition of sustainability
2.1.1 The origin of sustainability
The concept of sustainable development is deep-rooted, even if the term “sustainable” was firstly used for referring to the use of resources. Only with the emerging perceptions of a global environmental crisis during the 1960s the concept began to link larger and more important dimensions, such as the economic development and the environmental degradation.
The term “sustainable development” was used for the first time during the World Conservation Strategy (1980) in the International Union for the Conservation of Nature (IUCN) for defining the maintenance of essential ecological processes and life support systems, the preservation of genetic diversity, and the sustainable utilization of species and ecosystems.
But in 1987, the publication of the report of the World Commission on Environment and Development (Our Common Future, also called the Brundtland report because of the Commission’s Chair, Norwegian Prime Minister Grö Harlem Brundtland) expressed a definition of sustainable development that is the one most quoted and used in literature (WCED, 1987):
“Humanity has the ability to make development sustainable to ensure that it meets the needs of the present without compromising the ability of future generations to meet their own needs. The concept of sustainable development does imply limits [...] imposed by the present state of technology and social organization on environmental resources and by the ability of the biosphere to absorb the effects of human activities. But technology and social organization can be both managed and improved to make way for a new era of economic growth.”
In 1991, the report of the second World Conservation Strategy was published by the same bodies which were responsible for the first Strategy in 1980 (IUCN, UNEP and WWF). That report (Caring for the Earth) gave a wider meaning to the concept of sustainable development, defining it as a strategy for improving the quality of human life whilst living within the carrying capacity of the ecosystems.
In 1992, the United Nations Conference on Environment and Development (UNCED), held in Rio (and commonly referred to as the “Earth Summit”) established the principles of sustainability as a goal for the development strategies of the 178
countries that were represented. Among the several agreements reached at the UNCED, the most important was Agenda 21, a plan for achieving sustainable development during the twenty-first century.
2.1.2 The concept
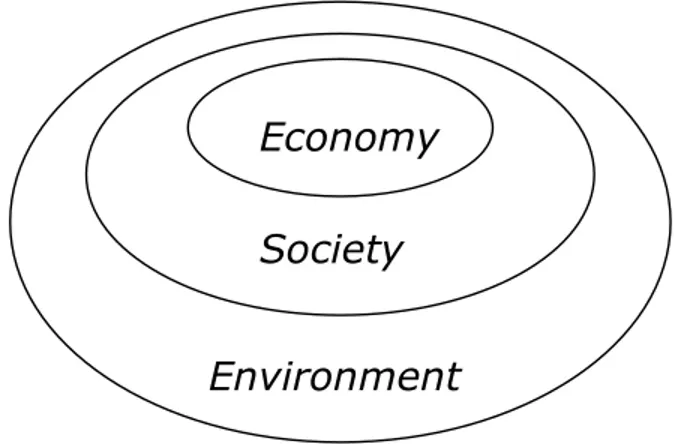
Sustainable development is classically explained as a link between the economy, the environment and the society. An approach to sustainability can not consider separately these three pillars, but takes into account the connections among these aspects. The relations between the environment, the society and the economy can be visually explained and understood illustrating three concentric circles as in the figure below:
Figure 2-1: Environment, Society and Economy links in the sustainable development concept.
The economy exists entirely within society because all parts of the human economy require interactions among people. However, society is much more than just economy. Friends and families, culture, religion and ethics are important elements of society, but are not primarily based on exchanging goods and services. Society exists entirely within the environment. The human basic requirements, such as air, food and water, come from the environment, as do the energy and raw materials for housing, transportation and the products we depend on. Finally, the environment surrounds society because the environment largely determined the shape of society, which is to say that the human need for air, food, water, energy and raw materials can never be larger than the environment. Sustainability requires an understanding of these interconnections in order to meet local and global sustainability objectives.
Economy Society
The next section of the thesis investigates all the aspects that the concept of sustainable development can concern. A great number of definitions has been found from a literature review and the following dimensions have been explicitly identified:
• Future generations • Use of resources • Environment • Society • Economics • Institution • Technology • Health • Equity
It can be observed the width of the dimensions that are related to the concept of sustainable development. Furthermore, the identified aspects of sustainability are the ones explicitly expressed in the definitions that have been found. In fact, a lot of other concepts can be closely related to the dimensions that have been listed above.
Sustainable development and sustainability are often considered as synonymously but a useful distinction can be made. Sustainability is referred to as a desirable state, where human needs are met without undermining natural resources. Sustainable development is referred to as the process towards sustainability (Lundin, 1999).
2.2 Analysis of sustainability and sustainable water management definitions
A great work of research has been done and a large number of definitions have been found in a literature review. The broad concept of sustainability is related to a great number of dimensions and aspects that have to be considered. Thus, every definition treats different aspects of the sustainable development in a different way and this brings to a complex analysis of the term. There are a lot of dimensions to consider and a new definition can introduce a new concept or a different way of thinking about an aspect related to sustainability. Putting all the definitions in a chronological order, one can see that a great amount of concept have been published after 1987, when the World Commission on Environment and Development expressed the most used definition of sustainable development (Brundtland report, Our Common Future, 1987). For that reason, it is not easy to find definitions of sustainability that have been given before 1987, even because the word sustainability was not developed as a key term for scientists and researchers.
The chronological order and the analysis of the concepts that are included in the various definitions of the term can help to see the evolution of the definitions and of the dimensions that have been considered.
For simplifying the next analysis and work, the concepts that are explicitly expressed in the definitions have been considered.
2.2.1 Qualitative aspects: the concepts
The analysis shows interesting aspects about the evolution of the definitions and of the dimensions treated by the term. We can identify two great periods in which definitions were expressed. The first analysis refers to the period before the definition given by the Brundtland report, the second part looks at the years from 1987 until today.
The World Commission on Environment and Development explained sustainable development as the development that meets the needs of the present without compromising the ability of future generations to meet their own needs (Brundtland report, WCED, 1987). It contains within it two key concepts: the concept of needs, in particular the essential needs of the world’s poor, to which overriding priority should be given; and the idea of limitations imposed by the state of technology and social organization on the environment’s ability to meet present and future needs.
For the first time, one can find the technological aspect that is explicitly expressed in the definition of the term. This aspect is reported for explaining the limiting factor represented by the old and traditional technologies towards a so broad target.
Brundtland himself, in 1986, expressed for the first time the economic, social and environmental dimensions in the same definition of sustainable development. These three aspects of the concept are those which appear more frequently in the successive definition of the term. Furthermore, the three dimensions expressed above are the main concepts on which the definitions are based, as much as until 1990 when the researchers and scientists tried to extend the sustainability term to more dimensions at the same time.
In the years before 1987, sustainability was a term not completely developed. The basic concept of the first definitions was connected with a more suitable use of resources in order to do not compromise the needs of the future generations. These were the only two aspects explicitly included in the concept, but actually they could have some consequences related to the economic, technological and social development (even if these implications were not clearly expressed).
From the middle of the ’80, the published definitions were referred even at the same time to several aspects of the same concept, such as the environmental, the social, the economic and the institutional dimension.
Immediately after the WCED definition (1987), publications about sustainable development were mainly referred to the economic, social and environmental aspect of the definition. The two big concepts expressed before (the prudent use of resources and the respect for the future generations) lost their central importance. But one can explicitly find again these two dimensions some years later, when they were included in a broader concept which considered new aspects.
In fact, after the Brundtland report, new definitions considering other aspects of sustainability (the technological, the healthy and the equity aspects appeared more explicitly and frequently) were published. But the concept of sustainable development was still based on the economic, social and environmental pillars (and, following alternate phases as expressed above, on a prudent use of resources and the respect of the future generations).
2.2.2 Statistical aspects
The researches based on the literature have brought 93 definitions of sustainability. The explicit aspects that one can meet more frequently are those of society (57) and environment (56). Then one can observe a great number of definitions based on the concepts of economics (48), use of resources (43) and future generations (36). The explicit concepts of institution (18), equity (13) and health (13) appear very few times. The less present dimension that has been considered in all the found definitions is that of technology (9).
None of the definitions explicitly considered all the listed concepts. There are four definitions related to the greatest number of dimensions (7) and we can observe that two of these considered the same concepts.
There are several (11) definitions in which one can notice the explicit reference to only one of the concepts that are expressed from the other publications. In four of the found definitions, the only aspect that has been considered is the respect for the future generations; the economy is the main pillar for other three of the “one-dimension” definitions.
Ordering the definitions in a chronological order, one can observe that three definitions based on only one concept were expressed before the 1987, when the most used definition of sustainable development was published in the Brundtland report (actually one of theses definitions was expressed in the same year). This related-time aspect can explain the narrowness of the expressed concepts.
After the WCED report, eight of the listed definitions tried to include in one only dimension (four definitions about the future generations, two about the resources and their use, one about economics and another one about the social dimension) a concept that is broader and harder to understand and to explain.
The definitions that consider one aspect among the several that have been expressed in a great number from other definitions can be limited for various reasons.
The first and simpler reason is that some definitions could be expressed because they were part of previous studies or researches and therefore they have to be understood as additions or reformulations of old concepts. For instance, Pearce gave a lot of definitions of sustainability and in 1993, when he published new aspects for three times in the same year, he explained twice the concept of sustainable development basing on one only dimension (the economy and the future generations). The second reason is that a definition that is based on one dimension could be related to some more specific study or research, so having a more particular objective (for instance a researcher that wants to study the environmental aspect of sustainable development).
Furthermore, it has already been noticed that the most discussed theme in the “one-dimension” definitions is the respect for the future generations. This aspect explicitly refers to a specific dimension, but actually it can involve many aspects of the concepts related to sustainability, such as protection of environment, economic growth, evolution of technologies, development towards a social equity, new approach for the use of resources, etc. But all these aspects should be explicitly expressed in a definition of sustainable development.
2.2.3 Suggestions
It has already been noticed that the most considered concepts in the definitions found on a literature review were the ones related to society, environment and economics. These are the three pillars that have been developed in the definitions published after the Brundtland report and especially by the Triple Bottom Line model. These three dimensions underline the very broad linkages to consider in the sustainable development concept.
It is important that the economic, environmental and social dimensions are expressed at the same time in the same definition in order to explain that the sustainable development is not referred to one only aspect. The previous analysis showed the great number of dimensions and linkages to be considered in the sustainability term.
The economic dimension is important in order to consider all the costs, all the profits and benefits and all the economic aspects of the management system.
Since before the Brundtland definition of sustainable development one of the most important dimension that was considered was the use of resources, this concept has been classified separately from the environmental field, even though these were often expressed in the same definition (and in fact this dimension usually appears in
the listed explanations of sustainability). In trying to define sustainable development, it is convenient to explicitly refer to the use of resources concept, keeping it separate from the broader dimension of respect of environment.
In suggesting and identifying criteria for the selection of sustainability indicators, the use of resources has been involved in the concept of environment. The general criterion “Environment and Use of Resources” can be divided in more specific sub-criteria as well as the one referred to the use of resources.
A similar consideration can be made for the institutional dimension. This concept is not much included explicitly in the definitions found on the literature and this can be due to the fact that the institutional aspect can be involved in a broader dimension of society or culture. In fact, the analysis showed that the institutional concept is often related to the social one in the same definition.
Furthermore, in the social-cultural concept all the aspects of the everyday life can be considered, such as the poverty degree (related, for instance, to the willingness or the possibility to pay for a certain service), the quality of life or the ethic aspects of a society (equity, religion, corruption, participation in public decisions, etc.).
This is the reason why institutional, social and cultural dimensions can be considered as the part of one only criterion which hence considers the political and the legislative issues of sustainable development.
Very few times the analysed sustainability definitions included the concept of inter- and intra-generational equity. It is clear that the meaning itself of sustainable development is related to equity as a consequence, but an explicit reference can be a useful general aspect to consider in a definition of the term. The equity concept can be taken into account in the economic or in the institutional, social and cultural criteria.
A very important aspect to be considered in the sustainability definition is the one of health. This dimension can be related to other broader concepts, such as the social aspect, the inter- and intra-generational equity, the respect for future generations, socio-economical growth, etc. But when a research involves the study of water management system it is important to explicitly express a specific criteria related to health and hygiene in order to consider the risk that is connected with the development of waterborne infections and diseases.
The technological aspect is the less frequent analysed by the found definitions of sustainable development. This fact can be explained considering that the willingness to reach new and broader targets includes the use of new technologies, different from the traditional ones. In fact, when the technological aspect was explicitly expressed in a definition it always referred to new solutions and new innovations.
Thus the explicit reference to more developed and more pursuit technologies is very important. It is the explanation that a change has to happen as soon as possible and that the scientific studies and researches have to move towards sustainability.
Furthermore, the explicit concept of the technological challenge can be useful for considering the risks that are due to technical, human or external factors.
2.2.4 Definitions of sustainable of water management systems
The definitions of sustainable water management found from a literature review are connected with aspects that have to be considered in a different way in comparison with the general aspects of sustainable development.
In fact some definitions tried to fix the general principles guides that a water management system has to follow. But in many other situations, the definitions were related to the studies and the researches in which they were expressed. The consequences were that few dimensions were used to define a sustainable water management system. In the analysed cases of “one-dimension” definitions, the technological aspect was the most considered. In fact, since the basic principles and dimensions of the general term of sustainability have been already explained and fixed, science has to develop in order to satisfy the demands of the sustainability concept.
In the specific projects related to the water and wastewater management, besides the technological aspect discussed above, the dimensions that have been considered in the most of the definitions are those of environment, society and economy, which are the three pillars of the general term of sustainable development. Even the aspect of resources and of their use becomes of primary importance.
In several definitions, the institutional and health dimensions are considered more than in the general definitions of sustainable development.
The former is explicitly explained because it is very useful to consider the political, the legislative, the participative and the communicative aspects of the problem, i.e. the linkages among all the parts that are part of the society.
As far as a water and wastewater management system concerns, health becomes one of the fundamental theme to respect and consider. The protection of human health is the main goal of providing safe drinking water and sanitation. To underline this vital aspect, a further criterion (Health and Hygiene) has been explicitly considered in order to refer specific sub-criteria to the safe water supply (and therefore the aspects connected with the quality of drinking water), the sanitation and the risk of waterborne infections and diseases.
It can be noticed that the concepts of respect for the future generations and of a long-time perspective are included in the definitions of water management systems in a similar percentage in comparison with the definitions of a more general aspect of sustainable development. This can be explained with the assumption that the long-term perspective is a fundamental aspect of the concept of sustainability and it is sufficient to observe that the most common definition of sustainable development,
from the Brundtland report, is explicitly based on this dimension of the concept. Thus the researchers, with this concept fixed in mind, did not explicitly refer to this aspect. Furthermore, a definition which considers the broad aspects of new technologies, protection of environment, prudent use of resources and improvement of health has to be based on the cares of future generations.
An important fact that should be noted is that the equity concept explicitly appears just once in all the definitions that have been found (Uhlmann expressed a list of principles to form the basis of a definition of a sustainable water utility, 2003). This concept is one of the most important dimensions to be considered because the general term of development should consider the equal possibility to access to basic services (especially the fundamental services as well as the access to water) for everyone, without distinctions between rich or poor people or between developed or developing countries.
Since equity is a dimension that is included (even though not very often) in a more general definition of sustainable development as showed in the last section, then it is important to explicitly refer to it when more specific studies are developing (in this case the water and wastewater management) or when using more detailed tools (for instance the use of particular criteria).
2.3 Choice of general criteria
None of the definitions of sustainability that have been found in literature consider at the same time all the dimensions that have been analysed in this chapter. It is very hard to explain a definition of a so broad concept referring in an explicit manner to all these aspects.
A definition is a concise phrase that explains the meaning of a word or of a concept. Probably, the Brundtland definition of sustainable development is the most common used concept just because it summarises in few words, even not explicitly, the general terms of development (therefore the economic, social, environmental and technological aspects are considered), of equity and of a more prudent use of resources.
In many publications, the definition of sustainable development was expressed as a list of principles that have to be respected. It is the best way to explicitly explain the concepts to which one wants to relate, but those cases can not be called “definitions”, because they do not represent a brief description of the term.
The definitions which have been found in literature and which are related to the greatest number of concepts are in fact expressed either as a list of principles that a sustainable process must follow or (in other few definitions) as a review or a new formulation of concepts that were already been expressed.
The only exceptions are from FAO (1992) and from the President’s Council on Sustainable Development (1999) which, instead of a list of principles, showed the characteristics that a process has to follow to move towards sustainability.
The aims of this work are not to pass a judgement on the definitions that have been analysed or to give or suggest a definition of a concept that is so broad such as the sustainable development concept. The literature review has been carried out in order to understand and discuss the concepts that we developed in this thesis. In fact, the treated concepts and all the reflections and considerations that have been made were been useful for identifying criteria and tools that can explain how and how much a water and wastewater management system moves towards sustainability.
Furthermore, another aspect has to be considered here. This thesis is related to the DIM-SUM (Innovative Decision Making for Sustainable Management of Water in Developing Countries) EU project, that aims at providing tools for an integrated and participatory decision-making process in management of water. Focusing on water supply and sanitation, the DIM-SUM project will carry out one case study in one river basin in each participating partner country (Indonesia, Maharashtra-India, Malaysia and Nepal) in order to evaluate and develop these tools. Thus, the proposed criteria and indicators have to relate with the general aspects of a sustainable water and wastewater management in developing countries in order to represent a useful tool that in a decision-making process enables to evaluate which aspects of the system move towards or away from sustainability.
The aspects to consider for developing recommendations for a sustainable decision-making process can be can be summarised as follows:
• Socio-economic aspects • Governmental issues • Environmental issues
• Increasing recycle and re-use
• Improvement of sanitation and hygiene • Technological aspects
• Technical, economic, social and environmental risks
The previous analysis and the related discussions guided us towards the following set of sustainability criteria that can be used in the study of a water management system:
• Health and Hygiene
• Environment and Use of Resources • Economics
• Institution, Society and Culture • Technology
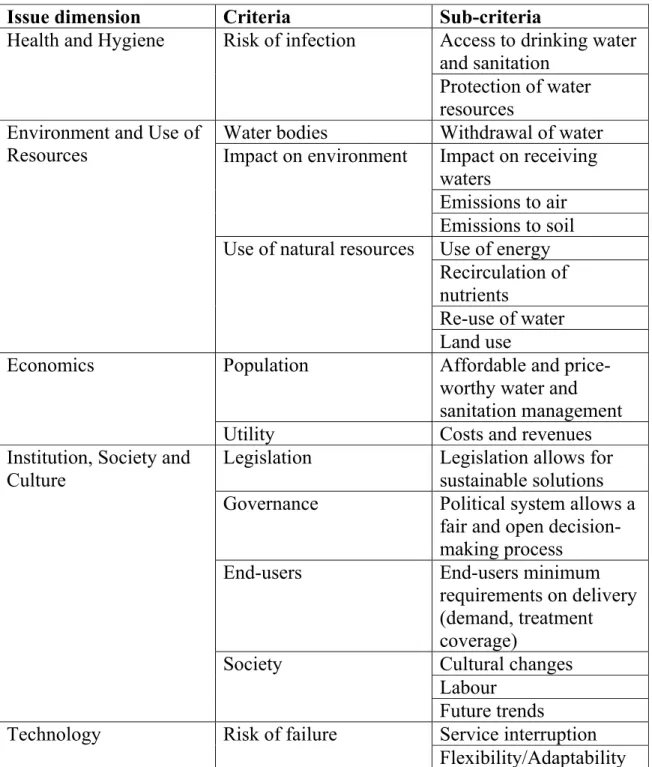
As discussed above, each of these criteria can be analysed using a list of sub-criteria that are more specifically related to the various aspects of sustainability. The suggested sub-criteria are listed in the following table:
Table 2-1: Suggested criteria and sub-criteria.
Issue dimension Criteria Sub-criteria
Access to drinking water and sanitation
Health and Hygiene Risk of infection
Protection of water resources
Water bodies Withdrawal of water
Impact on receiving waters Emissions to air Impact on environment Emissions to soil Use of energy Recirculation of nutrients Re-use of water Environment and Use of
Resources
Use of natural resources
Land use
Population Affordable and
price-worthy water and sanitation management Economics
Utility Costs and revenues
Legislation Legislation allows for
sustainable solutions
Governance Political system allows a
fair and open decision-making process
End-users End-users minimum
requirements on delivery (demand, treatment coverage)
Cultural changes Labour
Institution, Society and Culture
Society
Future trends Service interruption
Technology Risk of failure
2.4 Sustainability indicators
An indicator generally is a tool that is used for observing how far you are from where you want to be. It can be useful for understanding if a system is working towards the defined goal or if different methodologies and different approaches are needed to reach the desired target.
Indicators of sustainability are different from traditional indicators of economic, social and environmental progress. These traditional measures illustrate only partial changes in one part of a community as if they are entirely independent of the other parts, not considering the many linkages that exist between the various issues.
Since sustainable development requires a global view of the study, sustainability indicators have to relate to all the aspects that we want to consider. Therefore, these types of indicators are quantitative or qualitative tools which should be able to answer the question: Are we moving towards sustainability? (Lundin et al., 1997) Indicators for monitoring progress towards sustainable development are needed in order to assist decision-makers and policy-makers at all levels and to increase focus on sustainable development.
Sustainability indicators can be derived from criteria that try to define all the dimensions of the sustainable development concept. An indicator that is related to a criterion, an objective or a target is referred to a performance indicator; a number of indicators that are combined are called an index; while a number of indicators that represents a larger issue are referred to as a set (Bakkes et al., 1994). Indexes are instruments of simplification as they summarise large amounts of measurements to a simple and understandable form in order to highlight the main characteristics of a system. On the other hand, the aggregation causes a loss of information, but if the indicator is planned properly, the lost information will not gravely deform the result. The primary data, that are simple measurements, is analysed and combined to indicators, e.g. the crime rate in a region or life expectancy at birth. These are converted to a dimensionless range, forming a sub-index that is related to a specific issue, and then they are aggregated to an overall index consisting of a single number. Indices include all aspects that are significant for the question under consideration, such as economic, social, environmental and other issues. Clearly, the application of indicators and indices is constrained by data availability.
Indicators are as varied as the types of systems they monitor. However, there are certain characteristics that indicators have in common. In fact they are:
• Relevant: they must fit the purpose for measuring in order to show something about the monitored system that have to be known;
• Easy to understand: indicators should be understood even by the people who are not experts;
• Reliable: everyone can trust the information that the indicators are providing; • Based on accessible data: the information is available or can be gathered
while there is still time to act.
These are all qualities that are helpful in a decision-making process. One of the most essential functions of an indicator is to quantify, while further relevant functions are (Gallopín, 1997):
• To assess conditions and trends
• To provide information for spatial comparisons • To provide early warning information
• To anticipate future conditions and trends
In the next section, international sustainability indicators literature will be screened. Indicators that have been proposed and developed for the water sector by research projects or international organizations will be analysed, trying to identify the differences in methods applied and in resulting indicators.
2.5 Frameworks for sustainability indicators selection
A large number of frameworks and methodologies has been adopted for identifying, developing and communicating aspects of sustainable development through sustainability indicators. A framework can be viewed as a structure that can be used to select relevant indicators by identifying information needed for the stated purpose (Lundin, 2002).
Depending on the view of sustainability of the person that proposes indicators, the approach will be different. For example, an economist will probably use a model that has its roots in economics, while a natural scientist will perhaps use a model that is based on pressure or effects on the environment; others have focused on the relation between society and the environment. Another factor that has influenced the frameworks and methodologies has been the intended audience, whether it is politicians, a private company or the general public as whole.
In the following, a selection of frameworks representing different models for sustainability indicators is presented and summarised.
2.5.1 Models with roots in economics
Some of the oldest indicators that are still used are these measuring the Gross Domestic Product (GDP). This has more recently been refined to measure the Genuine Progress Indicator (GPI), while the Human Development Index (HDI) has been developed to concern more social issues. Both the GPI and HDI include parameters that the GDP neglect, such as ozone depletion, cost of unemployment and loss of old-growth forests. These non-market values are subtracted to provide an adjusted and more correct indicator (Lundin, 1999).
One problem with both HDI and GDP is that, since they assume that the natural capital and manufactured capital are close substitutes, they measure “weak sustainability” (Jacobsson, 2000). Briefly, proponents of “weak sustainability” simply require that the capital stock (consisting of man-made capital together with natural capital) be maintained and thus believe that a fall in natural capital can be compensated by an increase in man-made capital. In contrast, the “strong sustainability” school questions the substitutability between these two forms of capital and hence believes it insufficient to simply maintain the aggregate capital stock irrespective of the relative size of its components (Cole, 1999).
Environmental Accounting and Sustainable Development Records are two methods which are less aggregated than HDI and GDP and which can determine environmental performance in monetary and physical units (Lundin, 1999).
Environmental accounting
Environmental Accounting is intended as a tool to determine the use of natural resources at a national level, but can also be applied at a corporate level, for management purposes. The goal is to develop a system in which it is possible to deal with the use of natural resources and the environment in the same way as financial resources are dealt with. Since it is difficult to value certain natural resources, such as aquifers or healthy ecosystems, Environmental Accounting can not deal with them and these values are therefore not taken into account (Lundin, 1999).
Sustainable Development Records (SDR)
Several Swedish municipalities and companies have used Sustainable Development Records (SDR) for evaluating their economical and environmental performance. The SDR model measures the flow of resources used for a certain service that has been performed. The link between the generated services and the resources used in their production (social, material and financial) results in three different types of SDR indicators (Nilsson et al., 1995):
• Effectiveness ratio (service / operation), which links the service to the size of the operation;
• Thrift ratio (operation / throughput), which links the operation to the use of the resources (inverted efficiency);
• Margin ratio (throughput / resource base), which links the use of resources to the total resource base.
The model has been used to develop a set of indicators, which was used to assess the sustainability of different wastewater systems (Nilsson and Bergström, 1995).
The SDR model has been criticised by Carlson (1997) for not providing an explicit description of sustainability and for essentially being a book-keeping system for material and energy flows. It tends to focus on whether an operation moves in the direction of sustainability. Furthermore, several of the indicators are difficult to categorise and sometimes overlap (Lundin, 1999).
2.5.2 Models with roots in environmental sciences
There are many environmental models that are used to describe and assess environmental conditions and trends. The Pressure-State-Response model, the DPSIR model and the Media approach are common frameworks that are used by several organisations and countries. The advantage with these models is that they are developed for companies and therefore widely used (Lundin, 1998).
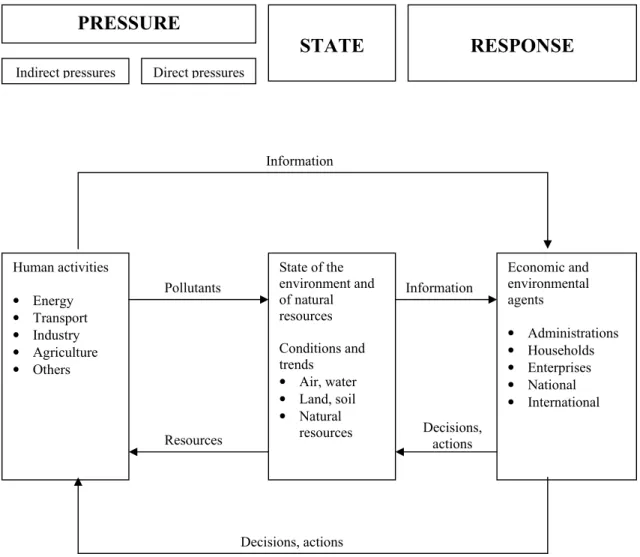
Pressure-State-Response (PSR) model
The Pressure-State-Response (PSR) model was developed by different organisations including the OECD. This model is separated into three different parts:
• Pressure indicators describe the environmental pressures from human activities, which influence the environment through emissions and the use of natural resources;
• State indicators refer to the state of the environment, like the quality or quantities of natural resources, and provide an overview of the situation in the environment;
• Response indicators represent what actions society takes in responding to environmental changes and concerns.
Figure 2-2: The PSR framework.
It is generally accepted that a universal set of indicators does not exist for the PSR framework and that the appropriate set should be tailored to the needs of the users. This has led to a core set of environmental indicators that covers the issues of climate change, ozone depletion, air quality, waste, water quality, water resources, forest resources, fish resources and biodiversity. The PSR model may be useful for describing causes of environmental problems and for communicating an understanding of the linkages between emissions and impact. However, it is less useful in describing the economic and social dimensions of sustainable development. The set of indicators may also be useful for authorities at a national level, but needs to be linked to regional goals and complemented with indicators at a lower (sectoral, company, individual) level (Lundin, 1999).
Human activities • Energy • Transport • Industry • Agriculture • Others State of the environment and of natural resources Conditions and trends • Air, water • Land, soil • Natural resources Economic and environmental agents • Administrations • Households • Enterprises • National • International Information Decisions, actions Pollutants
Resources Decisions, actions
Information
PRESSURE
STATE RESPONSE
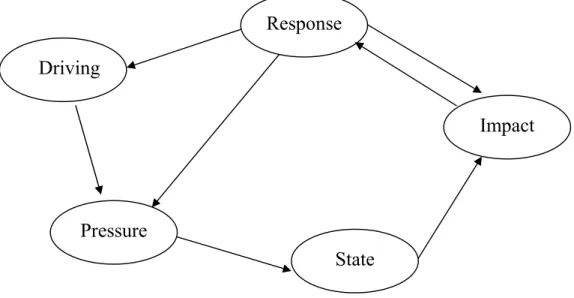
DPSIR model
The European Environmental Agency (EEA) and the European Statistical Office (Eurostat) have extended the PSR model to include Driving forces and Impacts (DPSIR model). The five types of indicators for DPSIR are:
• Driving forces, includes economic development, population, education and life style
• Pressure, includes emissions, physical impact and use of natural resources • State, includes concentrations of pollutants, natural resources and biodiversity • Impact, includes health-related aspects and biological effects
• Response, includes environmental policies, taxes and regulations and technical improvements presented for the different actors (government and parliament, municipalities, sectors, companies, organisations and the general public).
Figure 2-3: The DPSIR framework.
As the DPSIR model is an extension of the PSR model, it is more complicated, but on the other hand more flexible.
Media approach
The US Office of Water, in an attempt to make water quality information available to the public, has created a holistic tool for water management and established a national baseline, using a media-based framework. Here, information concerning water resources, drinking water quality and the state of aquatic ecosystems is provided. The two types of indicators suggested by this method
Driving force Pressure Response State Impact
correspond to the Pressure and State of the PSR model, although here they are referred to as the vulnerability and condition of the aquatic ecosystems.
2.5.3 Models that link societal activities and the environment
Some approaches, e.g. Socio-Ecological Indicators and Ecological Footprints, have focused on the physical influence of society on nature and attempt to link human activities to the environment (Lundin, 1999).
Socio-Ecological Indicators
Holmberg (1995) defines Socio-Ecological Indicators as indicators that focus early in the causal chain, i.e. are directed towards societal causes rather than towards environmental effects (therefore they hoped to provide an earlier warning than environmental quality indicators would), and are based on the four principles for sustainability defined by this research group:
• Substances extracted from the lithosphere must not systematically accumulate in the ecosphere;
• Society-produced substances must not systematically accumulate in the ecosphere;
• The physical conditions for production and diversity within the ecosphere must not become systematically deteriorated;
• The use of resources must be effective and just with respect to meeting human needs.
There have been attempts to develop indicators for urban water systems (one of them suggested both indicators of Pressure and State as well as Efficiency, E, defined as benefit per resource input), but they have ended up with indicators that can only be used for large geographical areas, national or larger, due to the difficulties in locating adequate data for the types of indicators for municipalities or water companies (Lundin, 1999).
Ecological Footprint and Sustainable Process Index
A widely known index of sustainability is the Ecological Footprint, developed by Wackernagel and Rees (1996). This index is based on the idea that one can assess sustainability in terms of the amount of land that is required to produce services for a person or a country. To do this, five major categories are included: food, housing, transportation, consumer goods and services. In theory, all the land and water area required to produce all goods consumed and to assimilate all generated waste should be included.
Another area-based index is the Sustainable Process Index, which focuses on process technologies. The total area required to produce raw materials, process energy, provide installation and area required for the staff and the accumulation of products and by-products is calculated and compared to available area (Narodoslawski and Krotscheck, 1995).
The use of area as a basic unit (instead of money) is an interesting approach since land area is limited. However, the calculations of the Ecological Footprint and the Sustainable Process Index involve a number of simplifying assumptions that are not always realistic, but they are necessary to achieve a single number (Lundin, 1999).
2.6 Lists from literature and analysis
A work of literature review was conducted to identify sustainability indicators related to the water context. A large amount of indicators relevant for water management have been proposed in the past by several research projects and international organisations. In this chapter an analysis of the lists which have been found will be developed in order to compare all the indicators and to understand the purposes and the reasons why they were selected.
Here are the international organisations sources: • World Health Organization (WHO)
• United Nations Commission on Sustainable Development (UNCSD) • Organization for Economic Co-operation and Development (OECD) • European System of Environmental Pressure Indices (ESEPI)
• Blue Plan for the Environment and Development in the Mediterranean
• The Water Strategy Man (WSM) project (supported by the European Commission)
• The GOUVERNe project (funded by the UE Fifth Framework Programme) Other projects and researches also gave important information about discussion and suggestion of sustainability indicators. The consulted studies were from Australia (The Sustainable Water Utilities project), Malta (The Sustainability Indicators Malta Observatory, SIMO), Great Britain (Water UK; The Sustainable Water industry Asset Resource Decisions project, SWARD), Sweden (Swedish EPA, the MISTRA-programme “Sustainable Urban Water Management”; Lundin; Nilsson and Bergström; Palme), Germany (Weigert and Steinberg; Mayer-Spohn), Netherlands (Balkema; Graf) and Zimbabwe (Gumbo).
All the collected information will be discussed in the next section of the work (selection phase), when the most suitable sustainability criteria and indicators that
have been proposed for the water and wastewater management context will be chosen.
World Health Organization (WHO)
Water supply and sanitation facilities represent the greatest requirements for sustainable services in developing countries. The constraints identified as contributing to or causing the failure of water supply systems range from poor organizational structures in the responsible agency, lack of spare parts, inappropriate technology, lack of trained staff, tied aid, absence of career opportunities, insufficient funds, legal framework problems, lack of motivation by sector personnel, non-involvement of the users, the low profile of operation and maintenance in the sector in general, inadequate tariff and collection systems and negative political interference.
Unaccounted-for water is another major water supply problem. In many large developing countries cities it has been reported as amounting to more than 50% of supplies. Most of this water is lost through leaking pipes or overflowing service reservoirs after abstraction, pumping or treatment, or during distribution. Those who suffer most from this inefficiency are populations living in impoverished, outlying urban areas. But if measures to ensure the sustainability and organization of facilities were implemented, extension of coverage to the fringe and poor areas of large cities would be possible. This would bring about considerable improvements in health (WHO).
The list of indicators that has been developed, promoted and applied by WHO is the result of significant efforts which are being made to promote institutional and management approaches and techniques conducive to the sustainability and optimization of water supply and sanitation services (WHO). The tools and the methodologies that have been considered for the formulation, improvement and monitoring of the programmes involved: ensuring the continuous availability of sufficient quantities of water of sufficient quality, within adequate institutional frameworks; applying sound management practices, appropriate technologies and full-cost accounting, and effectively maintaining facilities and equipment (WHO).
Table 2-2: The list of indicators proposed by WHO.
Group Indicator Formula
User satisfaction % of interviewees satisfied with service operation, classified by degree of satisfaction Five main O&M
problems
% of interviews
identifying each of the five most frequently listed problems for both water supply and
sanitation Roles and
responsibilities
Who is perceived by the users to be responsible for O&M of water and sanitation services? Who actually carries out O&M work?
Care and use of facilities Evidence of facilities being used and looked after
Approaching formal institution and outcome
Number of successful outcomes divided by the number of approaches during the period Users’ opinion and
satisfaction
Complaints dealt with Number of actions dealing with complaints in a given period divided by the number of
complaints logged in that period
Direct work Number of activities
divided by the duration of the period
Managed work Number of activities
divided by the duration of the period
Financial expenditure Total amount divided by the duration of the period Community and
household management
Labour expenditure Number of days in each category divided by the duration of the period
Problems resolved by internal actions
Number of problems resolved divided by the duration of the period Revenue collection
efficiency
Total collected divided by the total billed Billing efficiency Total billed divided by
the number of
connections required to pay
Informal water cost Average amount paid to vendors divided by the local household tariff rate for an equal volume Informal sanitation cost Average amount paid
annually per household Operating costs per
connection
O&M cost divided by the number of
connections
Revenue per connection Tariff revenue divided by the number of connections Financial indicators
Cost-recovery ratio Total tariff revenue plus subsidies and
miscellaneous income divided by the total O&M cost Access to functioning water supply points/latrines/septic tanks Number functioning divided by the total number in the locality Cleanliness of
public/shared facilities
% of interviewees satisfied with service operation, classified by degree of satisfaction
Reliability Functioning time during
a particular period divided by the duration of that period
Level of service
Piped water supply continuity
Average number of hours of supply per day divided by 24
Water quality Number of supply points at which E.coli samples are greater than the target value divided by the total number of supply points for which samples are taken
Flow rating Actual discharge from
tap or handpump divided by the design discharge Outstanding repairs Number of repairs not
carried out due to the lack of spare parts at any given point in time Location of spares Travel and/or distance to
the nearest place to buy supplies for latrines, taps, sand, cement, etc.
Accessibility Time elapsed between
identifying the need for the spare and the arrival of the spare where it is required
Spare parts use Number of spare parts requisitioned for a particular scheme divided by the duration of the period
Materials
Delivery time Time elapsed between
placing an order with a supplier and receipt of the order
Maintenance team indicator
Number of vehicles on the road divided by the total number of vehicles in the fleet Training (community-based) Number of people trained in a particular community divided by the number of supply points/latrines
Personnel
Training (centralized) Number of days spent on training divided by 365
Idle time Number of days of idle time divided by the number of days worked in a particular month
Overtime Number of days of
overtime divided by the number of days worked in a particular month Mean time to repair
(MTTR)
Total time spent on repairs divided by the number of repairs in the given period
Mean time before failure (MTBF)
Duration of the period divided by the number of failures in that period Leakage repair rate Number of leakages
repaired divided by the duration of the period Parts and equipment
indicators
Unaccounted-for water Total annual production minus the total annual metered consumption minus the estimated annual non-metered consumption
Work control indicator Number of outstanding or unfinished jobs at any point in time
Work control indicators
Workload Number of jobs carried
out in each classification divided by the duration of the period
United Nations Commission on Sustainable Development (UNCSD)
The Commission on Sustainable Development approved 1995 the Programme of Work on Indicators of Sustainable Development and called upon the organizations of the UN system, intergovernmental and non-governmental organizations with the coordination of its Secretariat to implement the key elements of the work programme. The main objective of the UNCSD Work Programme was to make indicators of sustainable development accessible to decision-makers at the national level, by defining them, elucidating their methodologies and providing training and other capacity building activities (UNCSD).
The Nineteenth Special Session of the General Assembly held in 1997 affirmed the importance of the UNCSD Work Programme on Indicators of Sustainable Development in coming up with a practical and agreed set of indicators that are suited to country-specific conditions and can be used in monitoring progress towards sustainable development at the national level.
The final report, that has been prepared as the culmination of the UNCSD Work Programme (1995-2000), provides a detailed description of key sustainable development themes ands sub-themes and the UNCSD approach to the development of indicators of sustainable development for use in decision-making processes at the national level (UNCSD).
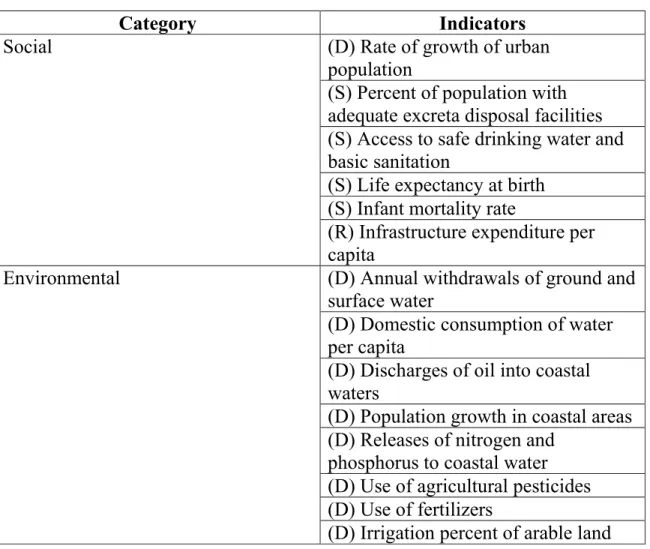
They have used a modified PSR model by substituting the concept of Pressure (P) for Driving forces (D) and explaining it to include not only environmental but also social, economic and institutional issues. Both the directly and indirectly water-related indicators have been considered in this work.
Table 2-3: The list of water-related indicators proposed by UNCSD.
Category Indicators
(D) Rate of growth of urban population
(S) Percent of population with adequate excreta disposal facilities (S) Access to safe drinking water and basic sanitation
(S) Life expectancy at birth (S) Infant mortality rate Social
(R) Infrastructure expenditure per capita
(D) Annual withdrawals of ground and surface water
(D) Domestic consumption of water per capita
(D) Discharges of oil into coastal waters
(D) Population growth in coastal areas (D) Releases of nitrogen and
phosphorus to coastal water (D) Use of agricultural pesticides (D) Use of fertilizers
Environmental
(S) Groundwater reserves
(S) Concentration of faecal coliform in freshwater
(S) Biochemical oxygen demand in water bodies
(S) Algae index
(S) Area affected by salinization and waterlogging
(R) Wastewater treatment coverage (R) Density of hydrological networks (R) Agricultural education
(R) Expenditure on waste management (R) Waste recycling and reuse
(R) Municipal waste disposal
(R) Number of chemical s banned or severely restricted
(D) Annual energy consumption (S) Share of renewable energy (S) Intensity of material use Economic
(R) Environmental protection expenditures as a percent of GDP
Organization for Economic Co-operation and Development (OECD)
A set of environmental indicators have been developed by the Organization for Economic Co-Operation and Development in consequence of a demand that has been expressed along two complementary lines. First, the OECD Council in 1989 called for further work to integrate environment and economic decision-making. This was reiterated in consecutive G-7 summits and led to the approval of an OECD Council Recommendation of Environmental Indicators and Information by OECD Governments in 1991. Second, the OECD has been entrusted by its Member countries to launch a new programme of environmental performance reviews with the principal aim of helping Member countries to improve their individual and collective performance in environmental management. Reviews are conducted under the auspices of the Group on Environmental Performance and evaluate individual countries’ environmental performance in respect of environmental quality, national objectives and international commitments (OECD).
Efforts of the OECD programme of environmental performance reviews are directed at promoting sustainable development, with the principal aim of improving the individual and collective performances in environmental management.
Environmental performance reviews are structured to further the following principal goals:
• Reducing the overall pollution burden and managing natural resources in a sustainable way;
• Integrating environmental and economic or sectoral policies; • Strengthening international co-operation (OECD)
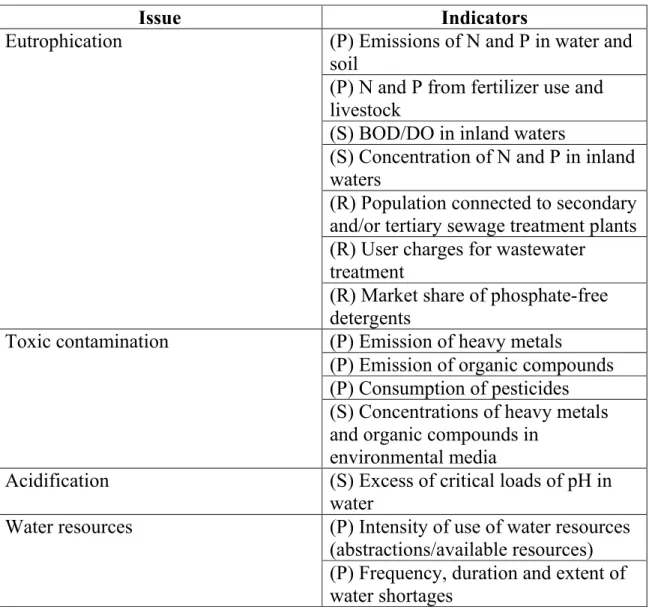
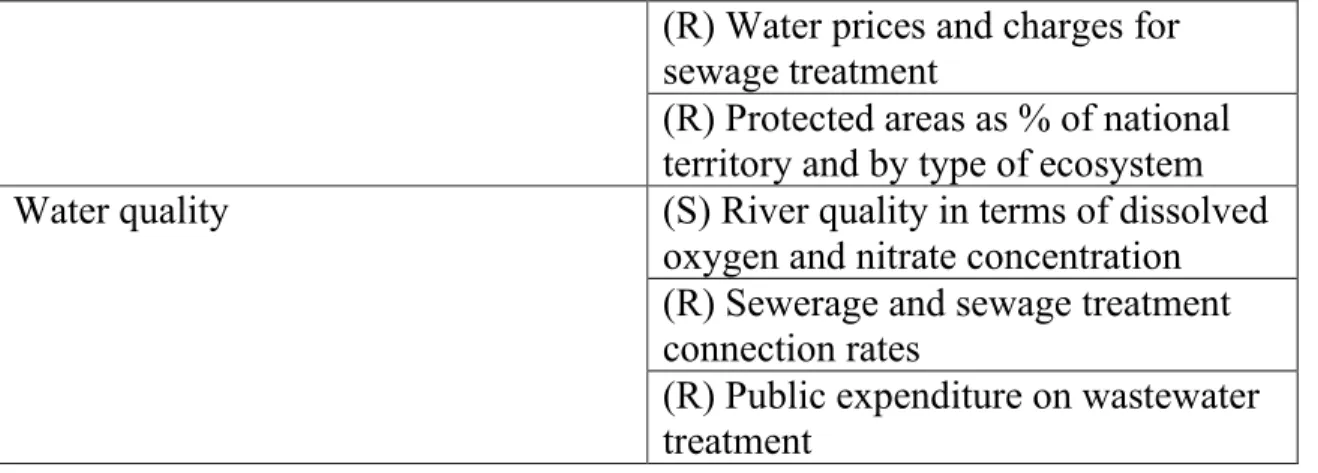
A core set of environmental indicators, which covers the issues of climate change, ozone depletion, air quality, waste, water quality, water resources, forest resources, fish resources and biodiversity, has been developed in accordance with the Pressure-State-Response (PSR) approach. In this section, only water-related indicators have been considered.
Table 2-4: The list of water-related indicators proposed by OECD.
Issue Indicators
(P) Emissions of N and P in water and soil
(P) N and P from fertilizer use and livestock
(S) BOD/DO in inland waters
(S) Concentration of N and P in inland waters
(R) Population connected to secondary and/or tertiary sewage treatment plants (R) User charges for wastewater
treatment Eutrophication
(R) Market share of phosphate-free detergents
(P) Emission of heavy metals
(P) Emission of organic compounds (P) Consumption of pesticides Toxic contamination
(S) Concentrations of heavy metals and organic compounds in
environmental media
Acidification (S) Excess of critical loads of pH in
water
(P) Intensity of use of water resources (abstractions/available resources) Water resources
(P) Frequency, duration and extent of water shortages
(R) Water prices and charges for sewage treatment
(R) Protected areas as % of national territory and by type of ecosystem (S) River quality in terms of dissolved oxygen and nitrate concentration (R) Sewerage and sewage treatment connection rates
Water quality
(R) Public expenditure on wastewater treatment
European System of Environmental Pressure Indices (ESEPI)
In the follow-up of the 1992 Rio Conference a group of European Commission officials, consisting of environmental experts working in the General Directorates of the Commission (e.g. environment, agriculture, energy, transport, economic instruments, research, and regional development) has been reunited for providing environmental policy with statistical tools.
The group started with an assessment of the on-going projects at national and international level, such as the Pressure-State-Response indicator model proposed by the OECD. However, because of the great basic differences between economic sectors (putting the focus on material wealth and employment) and environmental organizations (stressing the long-term aspects and the global distribution issues included in the concept of sustainable development), a consensus on a common valuation procedure was hardly achieved.
The European Commission’s Environmental Directorate financed an initiative, called European System of Environmental Pressure Indices (ESEPI), to develop a set of environmental pressure indicators for the EU in order to describe harmful human activities (“pressures”) that have a negative impact on the environment. 48 indicators were defined structured according to the DPSIR-approach, including several connected to water.
Table 2-5: The list of water-related indicators proposed by ESEPI.
Category Indicator
Water consumption Resource depletion
Inputs of phosphate to agricultural land
Dispersion of toxic substances Index of heavy metal emissions to water
Emissions of persistent organic pollutants (POPs)
Consumption of toxic chemicals Emissions of nutrients by households Emissions of nutrients by industry Pesticides used per hectare of utilised agriculture area
Nitrogen quantity used per hectare of utilised agriculture area
Emissions of organic matter from households
Emissions of organic matter from industry
Water pollution
Non-treated urban wastewater Urban environmental problems Non-treated urban wastewater Marine environment and coastal zones Tourism intensity
Plan Bleu
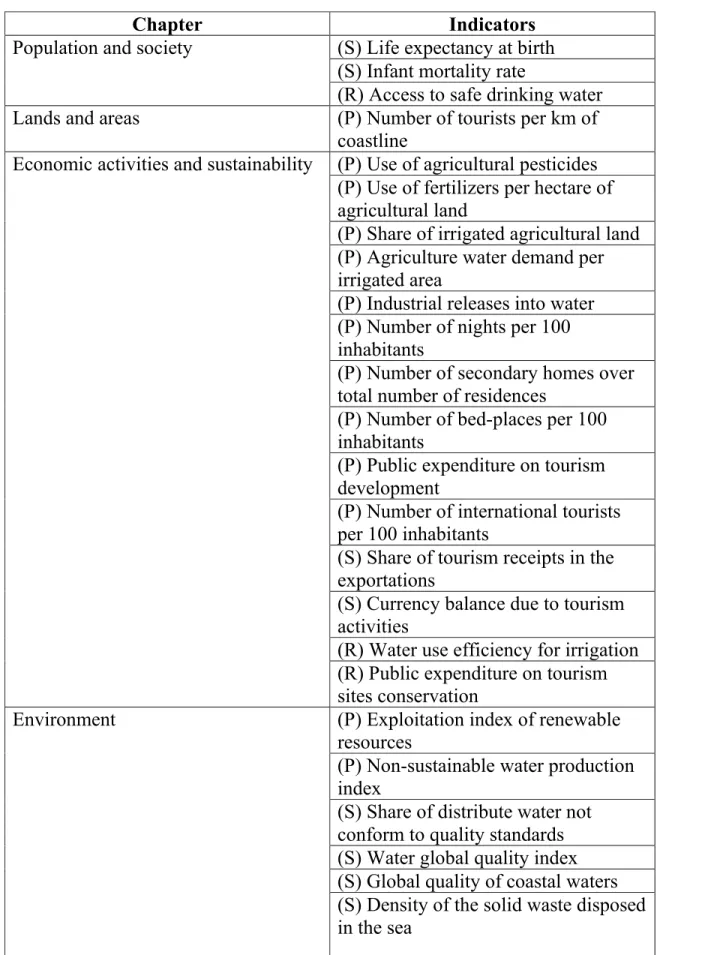
The Mediterranean Commission on Sustainable Development (MCSD) has the target to provide a tool to measure progress to sustainable development in the Mediterranean countries. For that reason, its activity centre, called “Plan Bleu pour l’environnement et le développement en Méditerranée” (Blue Plan for the Environment and Development in the Mediterranean), developed a set of 130 indicators structured according to the PSR-approach.
The Blue Plan’s work draws attention to the non-sustainable nature of certain developments in the Mediterranean, which are both very rapid and weighty in consequence (demographic and economic changes, the degradation of environment and the gap in living standards between the northern and southern sides of the Mediterranean). It also shows the decisive importance of water resources and the coastal regions as well as certain service sectors (like tourism) for which the quality of the environment constitutes a basic condition for development. The Blue Plan’s work aims at lead to a better understanding of a long-term approach (especially for the environment) in the decision-making and the implementation of renewed co-operation between the North-South and the South-South.
The included directly and indirectly water-related indicators have been considered in this thesis.
Table 2-6: The list of water-related indicators proposed by Plan Bleu.
Chapter Indicators
(S) Life expectancy at birth (S) Infant mortality rate Population and society
(R) Access to safe drinking water
Lands and areas (P) Number of tourists per km of
coastline
(P) Use of agricultural pesticides (P) Use of fertilizers per hectare of agricultural land
(P) Share of irrigated agricultural land (P) Agriculture water demand per irrigated area
(P) Industrial releases into water (P) Number of nights per 100 inhabitants
(P) Number of secondary homes over total number of residences
(P) Number of bed-places per 100 inhabitants
(P) Public expenditure on tourism development
(P) Number of international tourists per 100 inhabitants
(S) Share of tourism receipts in the exportations
(S) Currency balance due to tourism activities
(R) Water use efficiency for irrigation Economic activities and sustainability
(R) Public expenditure on tourism sites conservation
(P) Exploitation index of renewable resources
(P) Non-sustainable water production index
(S) Share of distribute water not conform to quality standards (S) Water global quality index (S) Global quality of coastal waters Environment
(S) Density of the solid waste disposed in the sea
(S) Coastal waters quality in some main “hot spots”
(R) Share of collected and treated wastewater by the public sewerage system
(R) Existence of economic tools to recover the water cost in various sectors
(R) Drinking water use efficiency (R) Share of industrial wastewater treated on site
(R) Wastewater treatment rate before sea release for coastal agglomeration over 100000 inhabitants
(R) Public expenditure on environmental protection as a percentage of GDP
The sustainable development: actors and policies
(R) Existence of environment national plans and/or sustainable development strategies
The Sustainable Water Utilities project
The Sustainable Water Utilities project is a doctoral research conducted at the Advanced Wastewater Management Centre, University of Queensland, Australia, that aims at develop an affordable, practical and user-friendly tool for use by water utilities in assessing and improving their sustainability. Other purposes of the research are related to addressing the following questions:
• How sustainable can an urban water utility be without a total catchment focus? Can storm-water be ignored by a water utility in managing its sustainability?
• Are sustainability benchmarks needed, and if so how could they be developed and applied?
The research program is divided into three stages:
• Development of sustainability management tool. Contributions from a number of fields – economics, engineering, environmental sciences, social sciences and sustainability – have been applied to urban water system management to develop an operational triple bottom line approach
• Water utility input. Feedback on the draft tool was obtained from a survey sample of utilities of varying sizes and coastal and inland locations via workshops/meetings held across Queensland
• Case studies to trial and refine tool are currently being conducted.
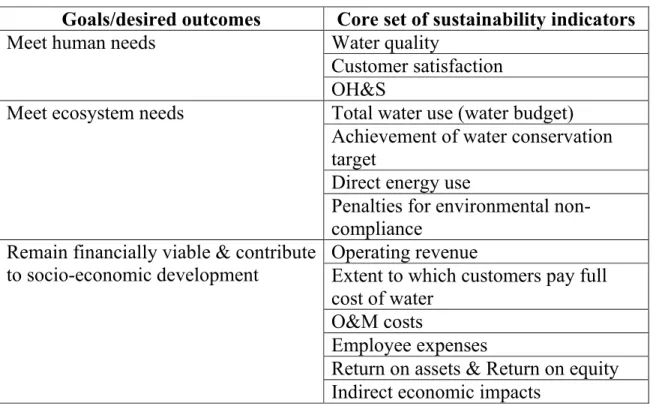
In 2002, the Victorian Water Industry Association (VicWater) developed the Triple Bottom Line Reporting Guidelines for use by its members in their annual reporting (Victorian Water Industry Association 2002). The result was a set of sustainability indicators focusing on urban water systems. Careful selection of key indicators which best suit the Sustainable Water Utilities project needs and are affordable and practical but still reasonably representative of sustainability, becomes a priority for the research. A model core set of sustainability indicators was chosen by application of selection criteria to VicWater’s indicator set.
Table 2-7: The list of indicators proposed by the Sustainable Water Utilities project.
Goals/desired outcomes Core set of sustainability indicators Water quality
Customer satisfaction Meet human needs
OH&S
Total water use (water budget) Achievement of water conservation target
Direct energy use Meet ecosystem needs
Penalties for environmental non-compliance
Operating revenue
Extent to which customers pay full cost of water
O&M costs
Employee expenses
Return on assets & Return on equity Remain financially viable & contribute
to socio-economic development
Indirect economic impacts
The Water Strategy Man project (WSM)
The goal of the Water Strategy Man project (“Developing Strategies for Regulating and Managing Water Resources and Demand in Water Deficient Regions”), supported by the European Commission, is the study of the differences between quantity and quality dimensions in water management and the development of alternative options and long-term scenarios. The project aims at developing an
integrated water resources management that takes into account economic, technical, social, institutional and environmental implications, to meet both directly and indirectly the EU requirements concerning preservation and enhancement of the quality of the environment and the availability of natural resources and sustainable development.
The central idea of the project recognises that the existing framework of water management infrastructures, natural environment, water supply and consumption, socio-economic and institutional conditions is the main factor in determining the appropriate strategies that may direct to improved water resources management. The WSM project methodology is based in the following steps:
• Application of holistic policy analysis that enables decision-makers to coordinate various governing authorities, delineate and assess a wider range of alternatives and finally select and implement relevant water pricing plans • Development of a methodology, based on the above analysis, which may
make possible the application of an integrated management approach that should primarily focus on the identification of sustainable alternatives for water cost recovery according to participatory planning, on providing control and alarm criteria and finally on implementation strategies of significant value for the stakeholders
• Usage of the information technology in the form of a decision support tool through which improvement in decision-making may occur in analysing quantitative and qualitative impacts in describing the entire potential responses and in suggesting appropriate solutions.
As the general idea of the Decision Support System that has been developed in the WSM project is to compare the performance of different water management strategies over a sufficiently long period of time, the evaluation approach that is implemented is based on a two step procedure.
In the first step, a set of indicators has been selected for measuring the performance of a strategy compared to the primary objectives of a water management (environmental compatibility, cost recovery of water services and coverage of demand for all sectors). Weights have been assigned to indicator values to reflect the preference structure of the decision-maker.
The second step aims at providing time series of indicators and indices as additional information to the decision-maker. Their purpose is to provide the user with additional information on the evaluation process.
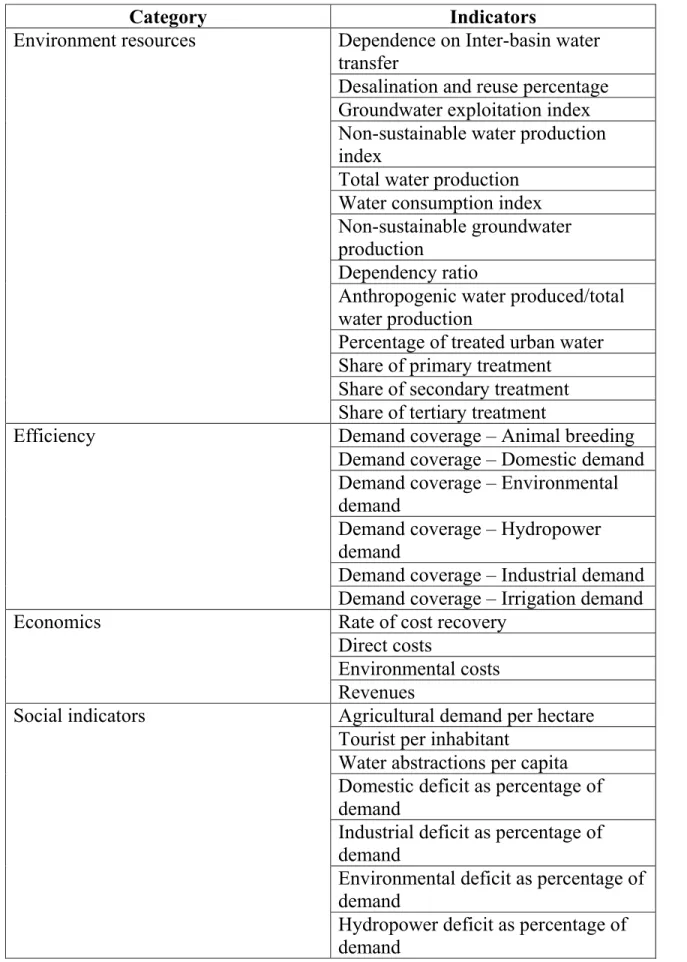
Table 2-8: The list of indicators proposed by the WSM project.
Category Indicators
Dependence on Inter-basin water transfer
Desalination and reuse percentage Groundwater exploitation index Non-sustainable water production index
Total water production Water consumption index Non-sustainable groundwater production
Dependency ratio
Anthropogenic water produced/total water production
Percentage of treated urban water Share of primary treatment
Share of secondary treatment Environment resources
Share of tertiary treatment
Demand coverage – Animal breeding Demand coverage – Domestic demand Demand coverage – Environmental demand
Demand coverage – Hydropower demand
Demand coverage – Industrial demand Efficiency
Demand coverage – Irrigation demand Rate of cost recovery
Direct costs
Environmental costs Economics
Revenues
Agricultural demand per hectare Tourist per inhabitant
Water abstractions per capita Domestic deficit as percentage of demand
Industrial deficit as percentage of demand
Environmental deficit as percentage of demand
Social indicators
Hydropower deficit as percentage of demand